Field-induced intermediate ordered phase and anisotropic interlayer interactions in -RuCl3
Abstract
In -RuCl3, an external magnetic field applied within the honeycomb plane can induce a transition from a magnetically ordered state to a disordered state that is potentially related to the Kitaev quantum spin liquid. In zero field, single crystals with minimal stacking faults display a low-temperature state with in-plane zigzag antiferromagnetic order and a three-layer periodicity in the direction perpendicular to the honeycomb planes. Here, we present angle-dependent magnetization, ac susceptibility, and thermal transport data that demonstrate the presence of an additional intermediate-field ordered state at fields below the transition to the disordered phase. Neutron diffraction results show that the magnetic structure in this phase is characterized by a six-layer periodicity in the direction perpendicular to the honeycomb planes. Theoretically, the intermediate ordered phase can be accounted for by including spin-anisotropic couplings between the layers in a three-dimensional spin model. Together, this demonstrates the importance of interlayer exchange interactions in -RuCl3.
I Introduction
Frustrated magnets with strong spin-orbit coupling have attracted great interest, largely because of the possibility that they may provide realizations of quantum spin liquids (QSLs): highly-entangled topological states of matter with fractionalized excitations and emergent gauge fields. The Kitaev model on the honeycomb lattice Kit06 is a unique and solvable example, in which spin-flip excitations fractionalize into itinerant Majorana fermions and Ising gauge-field excitations.
The search for realizations of the Kitaev model has uncovered a number of insulating honeycomb-lattice magnets, in which strong spin-orbit coupling generates local moments subject to bond-dependent Ising interactions Jac09; Cha10; Tak19; janssen2019. These include the stoichiometric crystalline materials IrO3 () and -RuCl3; however, antiferromagnetic long-range order is realized at low temperatures in these materials. Among them, -RuCl3 has attracted immense attention Plu14; Sea15; Ban16 for two reasons: (i) Spectroscopic experiments have detected Ban16; Ban17; Ban18; Bal19 clear signatures of fractionalized excitations over a significant range of energies, which have been interpreted in terms of proximate spin-liquid behavior Goh17. (ii) Magnetic fields applied in the honeycomb plane suppress magnetic order, leading to a spin-liquid-like state, the precise nature of which is under debate Wol17; Sea17; Bae17; Zhe17; Lea17; Win18; Hen18; Yokoi20; Gas20; Bac20; Chern20; janssen2019. In fact, the overall temperature-magnetic field (-) phase diagram of -RuCl3 is currently under intense scrutiny. In zero field, single crystals with minimal stacking faults show a transition near K to a low-temperature ordered phase that has a zigzag antiferromagnetic (AFM) structure in a single honeycomb plane, with a three-layer periodicity perpendicular to the planes Ban16. Some recent experimental results show that at low temperatures there is evidence for a field-induced transition to an additional ordered state before the zigzag-ordered phase is suppressed. Preliminary evidence for this was seen in ac susceptibility measurements Ban18, and the thermodynamic nature of the transition was confirmed by heat capacity Tan20, magnetocaloric effect (MCE) Bal19, and magnetic Grüneisen parameter Bac20 data.
Questions also remain about the full - phase diagram at higher fields. The reported quantized thermal Hall conductivity at fields above the disorder threshold Kas18; Yokoi20 suggests the presence of an additional topological phase transition at a second, higher field. This appears consistent with reported MCE and inelastic neutron scattering measurements Bal19. However, recent Raman Sah19; Wul19, terahertz Wang17, and electron spin resonance spectroscopy Pon20, as well as Grüneisen parameter measurements Bac20, do not show a clear signature of such a transition. On the theoretical front, there is still considerable discussion about the appropriate microscopic Hamiltonian describing the magnetism of -RuCl3 Kim11; Cha13; Rau14; Per14; Rou15; Win16; Win17; Jan17; Lam18; Suz18; Jan20; Mak20. Clearly, the correct Hamiltonian must account for all of the experimentally observed phases and transitions.
In this paper, multiple experimental probes are used to investigate the intermediate-field ordered phase prev_note. Orientation-dependent magnetization and susceptibility measurements map the phase diagram as a function of magnetic field direction, strength, and temperature; see Fig. 1. Neutron-diffraction measurements show that the intermediate-field ordered state features a periodicity in the direction perpendicular to the honeycomb plane that is different from that of the low-field ordered state, implying that interlayer exchange interactions must be accounted for in order to understand the transition between these two states. To that end, an effective spin Hamiltonian modeling these interactions is introduced, and is shown to describe well the field-induced transition between the two zigzag phases for appropriately chosen model parameters.
The rest of this paper is organized as follows: In Sec. II, we provide experimental details about the measurements performed. The presentation of the experimental results starts with the bulk properties in Sec. III, before the neutron diffraction is addressed in Sec. IV. In Sec. V, we present a modeling of the magnetic structure factor. Section VI discusses the properties of a three-dimensional (3D) spin model in an in-plane magnetic field, which is shown to reproduce the key features of the experiment. The paper ends with a discussion in Sec. VII.
II Experimental methods
Susceptibility measurements were performed on -RuCl3 single crystals prepared by a vapor transport method described elsewhere Ban17 and oriented by X-ray Laue diffraction using a conventional unit cell, see definition in Fig. 2. Angle-resolved dc magnetization measurements were collected using a sample rotation stage in a 7 T SQUID magnetometer. dc magnetization, ac susceptibility, and thermal-transport measurements were performed up to 14 T at various fixed angles in a Physical Property Measurement System (Quantum Design).
Neutron diffraction measurements were performed on the CORELLI instrument at the Spallation Neutron Source using an 8 T vertical-field cryomagnet. CORELLI is a time-of-flight instrument with a pseudo-statistical chopper, which separates the elastic contribution Ros08. For this experiment, a 2 g single crystal of -RuCl3 studied earlier Bal19 was mounted on an aluminum sample holder and aligned with the plane in the horizontal scattering plane. This way, the magnetic field of the 8 T vertical-field cryomagnet is aligned parallel to a -equivalent direction. The crystal was rotated through in steps of . Large vertical detector coverage at CORELLI allows access to the full set of magnetic Bragg peaks in the honeycomb 2D Brillouin zone, which is oriented vertically in this configuration. For all data shown, a measurement at 8 T is subtracted as a background after it was confirmed that no elastic magnetic intensity remained at this field strength. The data was reduced using Mantid Arn14.

III Bulk properties
When a magnetic field is applied parallel to a Ru-Ru bond [corresponding to one of the symmetry-equivalent , , or directions, see Fig. 2], the magnetization at 2 K shows a single kink at T in the vicinity of the well-documented field-induced suppression of the zigzag ordered phase Wol17; Sea17; Bae17; Zhe17; Lea17; Win18; Hen18, see Fig. 3(a). Minor variation between samples is present, as shown in Fig. 3(b). Rotating the magnetic field perpendicular to a bond, i.e., along a -equivalent direction, reveals a second feature near 6 T, well below the purported transition into the field-induced disordered phase. The anisotropy of the critical fields within the honeycomb plane is clearly visible in ac susceptibility measurements, Fig. 3(b). Two well-separated anomalies in at T and T as a function of field strength converge and shift slightly higher to T in a field. This behavior repeats every , consistent with the symmetry of the honeycomb lattice, and has been reproduced in a number of samples.
Figs. 3(c) and (d) show the angle dependence of the magnetization obtained via sample rotation in a field up to 7 T at 2 K and 10 K, respectively. Here, is the angle between the magnetic field and the reciprocal lattice vector , cf. Fig. 2. At moderate fields T, angle-resolved magnetization below K exhibits a sixfold symmetry with maxima at , where the field coincides with a bond-parallel direction. The amplitude of this oscillation decreases with increasing field. At elevated fields T, a distinct set of maxima appear in a narrow range of around the directions , also clearly visible in Fig. 3(g). Above the oscillation in the angle dependence of the magnetization disappears (Fig. 3(d).
The double-peak behavior in in a magnetic field emerges several Kelvin below the Néel transition, becoming distinct only for K, Fig. 3(e). Thermal-conductivity measurements exhibit consistent behavior, as shown in Fig. 3(f). A minimum in marking the critical field for the suppression of the zigzag order in -RuCl3 has been previously reported Lea17; Hen18; Yu18. With this feature splits into two distinct minima below 5 K. We note that the minima near 7 and 7.8 T are larger than the analogous critical fields in susceptibility data; the detailed field-dependence of magnetic contributions to phonon scattering and enhancement across the two transitions are not well understood and likely play a role in the discrepancy.
IV Neutron diffraction
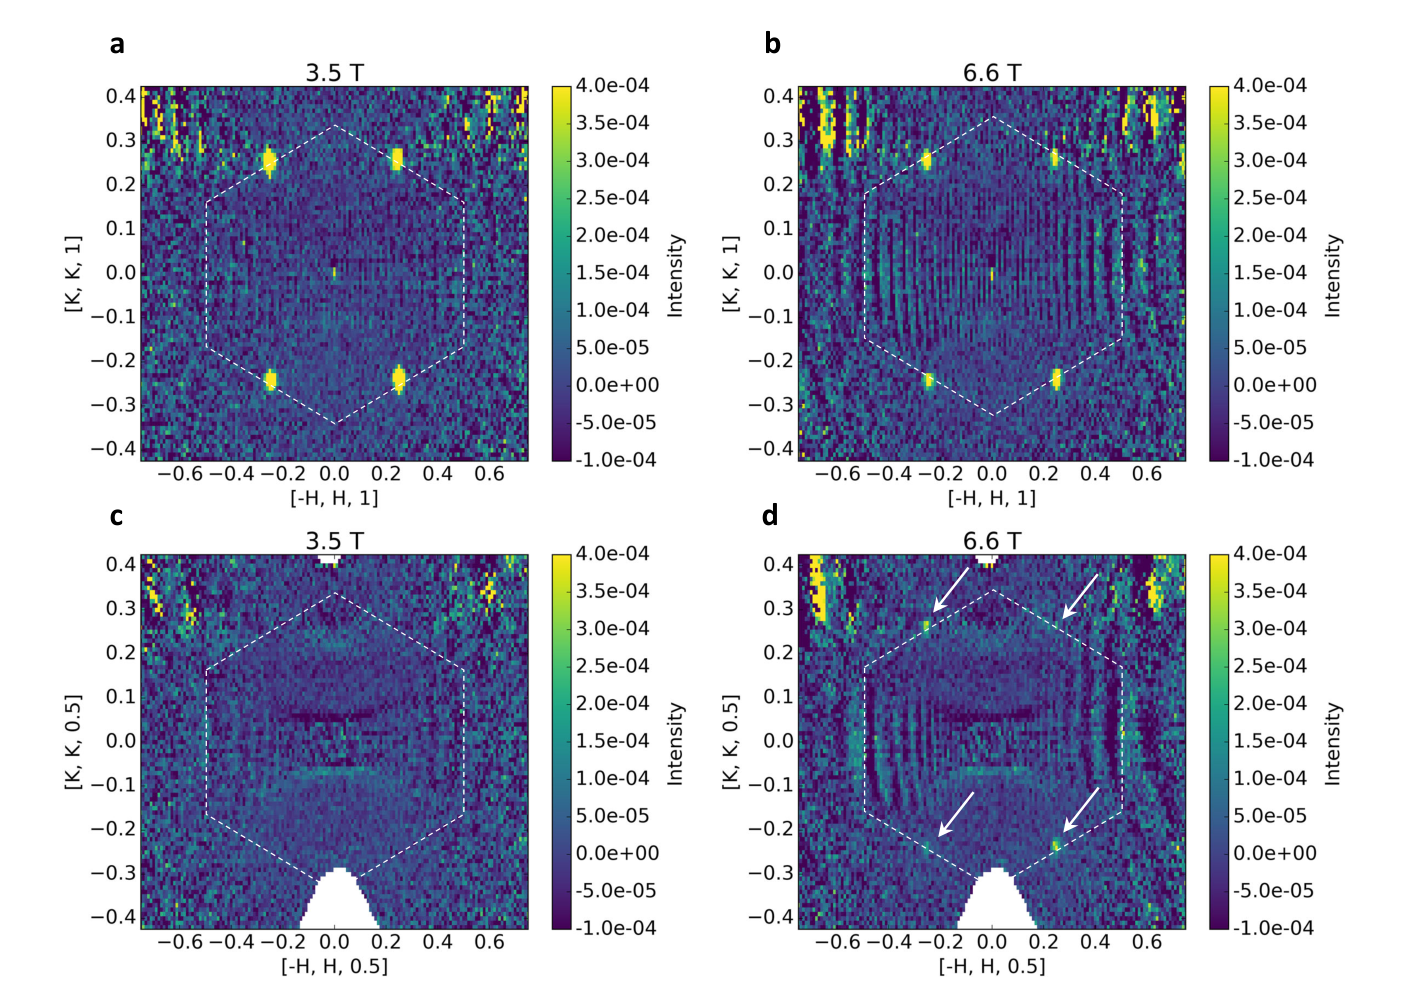
In order to characterize the intermediate-field phase, neutron diffraction data were taken in fields , for which the two critical fields are separated the most, cf. Fig. 1(b). In Fig. 4 2D slices of the honeycomb Brillouin zone for field strengths of 3.5 T and 6.6 T are shown. The perpendicular wavevector transfer along was integrated for narrow ranges around and respectively and averaged over positive and negative values. At 3.5 T the intensity of the zig-zag magnetic Bragg peaks that remain above the domain re-population field of 2 T was found to be the strongest Ban18. The field of 6.6 T is centered in the intermediate phase in between and . Fig. 4(a) shows the four -point Bragg peaks at 3.5 T. These four peaks also appear in the intermediate phase at 6.6 T and remain at commensurate positions, as shown in Fig. 4(b) and in one-dimensional (1D) cuts within the honeycomb plane in the appendix. The most striking feature of the intermediate phase is the appearance of new zigzag Bragg peaks at half-integer values of , as shown in Figs. 4(d) and 5(a). No intensity was observed at these values at lower fields, see Fig. 4(c) for the same slice at 3.5 T.
Since the intermediate phase is also characterized by Bragg peaks of the zigzag structure, we chose the naming convention zz1 and zz2 for the two ordered phases. Most importantly, the phase transition represents a change of the 3D magnetic structure as indicated by Bragg peaks appearing at different values of , but at the same positions within the honeycomb plane. The 3D character of the magnetic exchange interactions in -RuCl3 has been discussed already in Refs. Bal19; Jan20 and is confirmed by the observation of this transition.
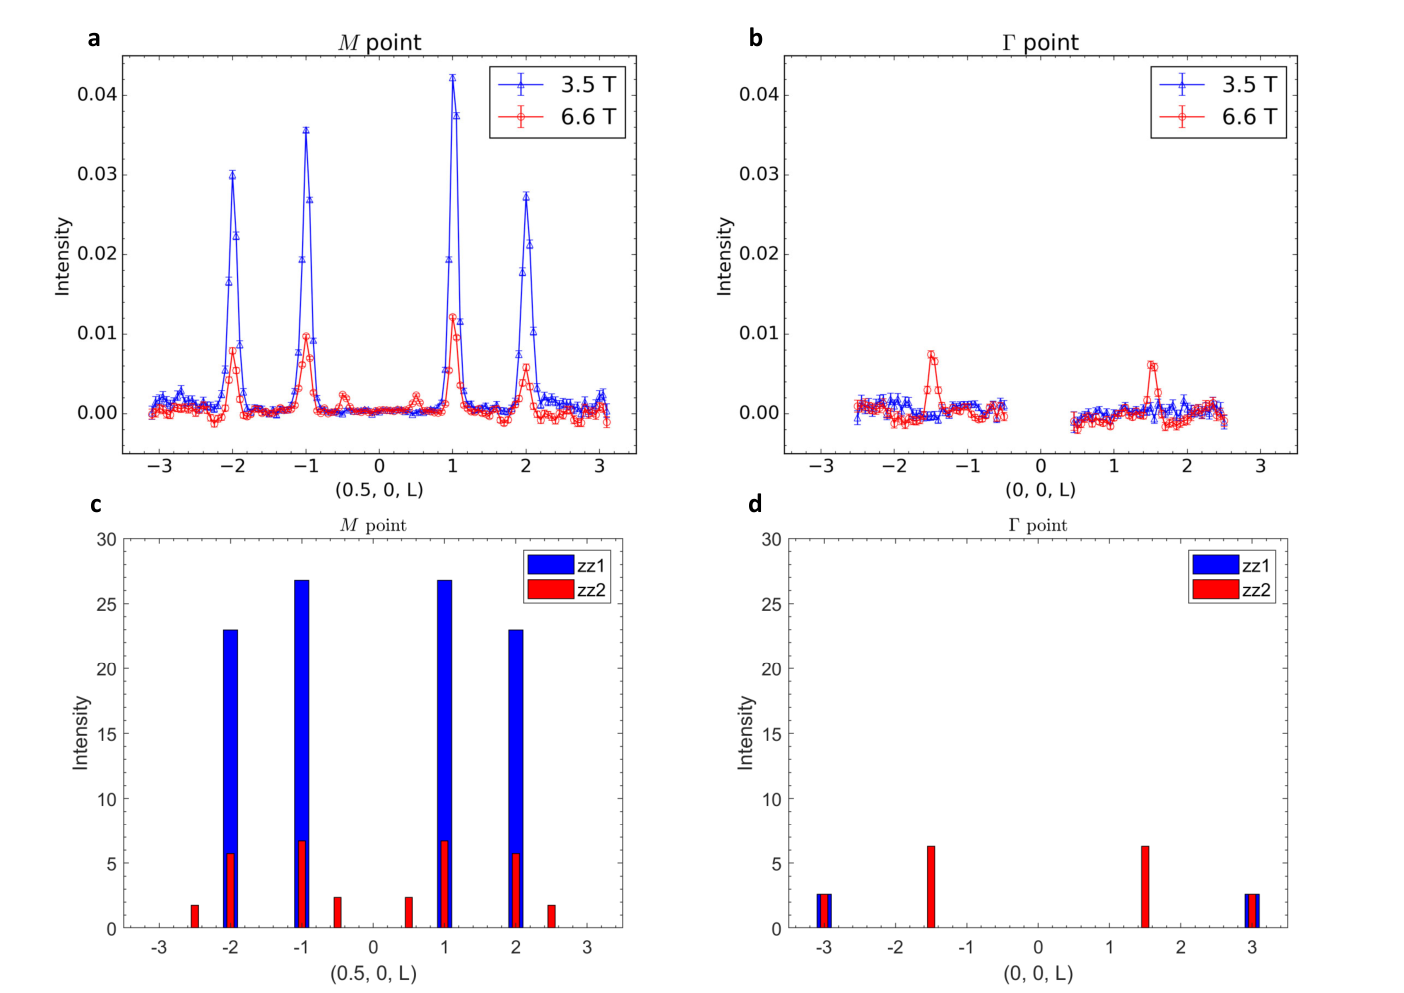
To explore the nature of the zz2 phase in more detail, we show 1D cuts along the out-of-plane wavevector transfer in Fig. 5(a,b). The -point intensities in the zz1 phase appear at values of , consistent with the three-layer stacking of the crystal structure in the space group and an obverse-reverse twining ratio of approximately 50%, as observed in large single-crystals of -RuCl3 Par16; Cao21. The Bragg peaks with appear weaker because of (i) the magnetic form factor and (ii) the neutron polarization factor, which allows only the magnetic moment component perpendicular to the wavevector transfer to be measured. At 6.6 T, within the zz2 phase, the -point Bragg peaks with lose intensity, which can be understood as a consequence of the destabilization of the zigzag order in the vicinity of the transition to the disordered high-field phase. Most importantly, Fig. 5(a) again demonstrates the appearance of the new -point Bragg peaks at in the zz2 phase. The cut along for the 2D point in Fig. 5(b) reveals another set of magnetic Bragg peaks appearing at in the zz2 phase.
The magnetic-field dependence of the different sets of peak is presented in Fig. 6. At the transition to the zz2 phase, the intensity of peaks with integer exhibit a kink while the half-integer peaks start to emerge. The intensity of the latter goes through a maximum near 6.6 T and at the transition to the disordered phase, all peaks simultaneously lose their intensities.
V Structure factor modeling
In order to understand the zz2 phase, we performed magnetic structure factor modeling in the space group for a zigzag magnetic structure on the honeycomb lattice. The crystal structure is illustrated in Fig. 7. The ordered moments are chosen to lie perpendicular to a Ru-Ru bond in the honeycomb plane and the angle between the ordered moments and the honeycomb plane was fixed to 15°, as refined from polarized and unpolarized single-crystal neutron diffraction data Cao21. However, with the exception of the relative intensity of the peaks, the results do not depend on this angle. Two different stackings of the in-plane zigzag configurations along the out-of-plane direction are possible, as illustrated in Fig. 8. The first one is characterized by an antiferromagnetic configuration between nearest interlayer neighbors and is compatible with the threefold stacking of the crystal structure (3f-zz). All Bragg peak intensities in the zz1 phase are correctly reproduced by the 3f-zz stacking, see the blue intensities in Fig. 5(c). The second one is characterized by a ferromagnetic alignment between nearest interlayer neighbors. This doubles the magnetic unit cell in the out-of-plane direction and leads to a sixfold zigzag stacking (6f-zz) as shown in Fig. 8(b). This structure consequently leads to magnetic intensities at half-integer positions along , which in the space group appear at . The observation of coexisting integer and half-integer peaks in Fig. 5(a) leads us to assume phase coexistence of the 3f-zz and 6f-zz structures in the narrow field regime between 6 and 7.3 T, representing the zz2 phase. This assumption is supported by our microscopic model below, which characterizes the transition at 6 T as first-order, implying hysteresis effects. The volume fractions of the 3f-zz and 6f-zz structures in the zz2 phase can be obtained from the field-dependent peak intensities within the first Brillouin zone. As visible in Fig. 6 the intensity of the (0,-1/2,1/2) peak goes through a maximum at 6.6 T and at this field value the 6f-zz structure accounts for 1/4 of the ordered moment while 3/4 is still ordered in the 3f-zz structure. It is important to note that the -RuCl3 crystal was zero-field cooled for this experiment and the field was gradually increased at the base temperature of 2 K.
In order to model the -point intensities in the zz2 phase at 6.6 T (Fig. 5(a)), the magnetic structure factor is calculated for a superposition of the 3f-zz and 6f-zz structures with a ratio of 3/4 to 1/4. For comparison with the experimental data, the overall intensity is reduced by a factor of 4 compared to the zz1 phase calculation at 3.5 T which is explained by the overall decrease of the order parameter. The resulting structure factor in Fig. 5(c) agrees well with the observed intensities. From the experimental data, it is not clear whether intensity is present at , since the expected signal is within the level of the experimental noise. The -point intensities from Fig. 5(b) are modeled in Fig. 5(d). Two additional effects of the external field on the ordered structure are included. First, a 10% uniform moment in the honeycomb planes along the field direction, which produces the magnetic peaks at . These were unobservable in the experiment, since they lie on top of intense nuclear peaks. This net ferromagnetic moment is independent of the 3D magnetic structure. Second, a 10% AFM moment perpendicular to the field direction that is uniform in each plane, but staggered between neighboring planes. This AFM moment has different effects on the magnetic structure factor in the 3f-zz and 6f-zz configurations. In the three-layer structure, this AFM moment cancels out completely and does not contribute to the structure factor. In the six-layer structure, it causes additional magnetic peaks at half the value of the nuclear peaks. In , these magnetic peaks appear at consistent with the observation from the experiment. In sum, we were able to account for all observed magnetic Bragg peaks with a simple magnetic structure factor model based on two different stackings of the in-plane zigzag configurations.
VI Microscopic spin model
In this section, we aim at constructing a microscopic spin model that describes the experimental findings. As the experiments indicate a field-driven change in the 3D magnetic structure, this requires a model involving interlayer couplings. Here, we construct such a model and show that it displays a first-order transition from 3f-zz to 6f-zz order for appropriately chosen parameters.
VI.1 3D spin model
Restricting our attention to low temperatures, we assume a rhombohedral crystal structure with an space group, implying an undistorted symmetry Par16; Gla17. The unit cell contains three honeycomb layers with two spins each, see Fig. 7.
Each spin has one interlayer neighbor that is located either right above or below it, depending on the sublattice index. The strictly vertical spin-spin exchange interaction is compatible with the symmetry only for a Heisenberg coupling, denoted as in Fig. 7(b). On the level of the next-nearest interlayer neighbors, bond-dependent interactions, such as a Kitaev coupling or an off-diagonal , become symmetry allowed. We note that the nine next-nearest interlayer neighbors of each spin fall into two classes (with six and three members, respectively) that are distinguished by the presence or absence of a nearest-neighbor intralayer bond in one of the participating layers Jan20. In what follows, we will not distinguish between these different next-nearest interlayer neighbors for simplicity.
As noted above, assuming a zigzag magnetic pattern within the honeycomb layers allows two different stackings in the out-of-plane direction, see Fig. 8. () favors threefold (sixfold) stacking, respectively, independent of the particular spin directions. In order to assess the possibility of a field-induced transition between the different zigzag stackings, it is therefore mandatory to take spin-anisotropic interlayer couplings into account, as are symmetry-allowed for the next-nearest-neighbor interlayer bonds. Here, we consider a simple model with the two interlayer couplings only. A Heisenberg nearest-neighbor interlayer coupling and a Kitaev next-nearest interlayer neighbor coupling . The Hamiltonian may then be written as
| (1) |
where the indices label the layers and the sites within a given layer. In the above equation, the first two lines correspond to the usual intralayer interaction Win16; Win17; Jan17, while the third line denotes the interlayer interactions. The fourth line is the Zeeman term for a uniform magnetic field , with the Bohr magneton. We assume a diagonal tensor, in the crystallographic basis, with isotropic in-plane elements , consistent with symmetry. For the intralayer interactions, we use Win17; Jan17; Win18
| (2) |
where sets the overall energy scale. Within a purely 2D modeling, this set of intralayer couplings fits well various experiments Ban17; Ban18; Wol17; Wang17; Gas20; Bac20, but might require modifications upon the inclusion of sizable interlayer couplings Jan20. In order to constrain the parameter space, we hence assume for simplicity that both interlayer couplings are much smaller than the intralayer couplings, . Apart from the individual signs of and , which will be constrained below, this leaves us with a single free parameter in our model, corresponding to the ratio . This turns out to be sufficient to describe well the qualitative features of the experiment.
VI.2 Phase diagram
In the limit of , the classical ground state of can be found by minimizing the energy within each layer first and then considering the coupling between the layers as a perturbation. The ground state of the system with is a zigzag pattern in each layer with the different stackings being degenerate. Small, but finite, and lift the degeneracy and stabilize either 3f-zz or 6f-zz, depending on the signs and relative sizes of the interlayer couplings. Previous modeling of the magnon spectrum at high fields Jan20 suggested antiferromagnetic . Antiferromagnetic favors the 3f-zz configuration. This configuration is in agreement with the measurements at low field in the zz1 phase of -RuCl3, as discussed above. At intermediate fields between and in the zz2 phase of -RuCl3, the structure factor modeling indicated a coexistence of 3f-zz and 6f-zz. The change of the zigzag stackings as a function of field suggests an exchange frustration mechanism arising from the interlayer couplings. With antiferromagnetic , such an interlayer frustration can be achieved by assuming ferromagnetic . In fact, using this sign structure of the two interlayer couplings and appropriate chosen magnitudes, we indeed find a transition between a 3f-zz configuration at low fields and a 6f-zz configuration at intermediate fields, before the zigzag order is completely destabilized at the transition to the disordered phase, in agreement with the experiment. Within our simple interlayer model and for the present set of intralayer couplings [Eq. (2)], this occurs for within a narrow parameter range . The emergence of this field-induced transition between the different zigzag stackings can be understood as a consequence of the inhomogeneous canting of the spins for , which leads to a different dependence on the canting angles of the energies of the 3f-zz and 6f-zz states.
By contrast, for , the canting is homogenous and the difference between the 3f-zz and 6f-zz energies can be written as
| (3) |
where parametrizes the direction of the spins at zero field Jan17 and is the homogeneous canting angle. is the total number of spins and for -RuCl3. For fixed couplings, the energy difference is therefore always either positive or negative, but cannot change sign as a function of the field strength . For , a field-induced transition between 3f-zz and 6f-zz is therefore not possible within our classical model and for infinitesimal interlayer couplings. We have checked that this remains true when small off-diagonal interlayer couplings are taken into account.
The full classical phase diagram of our microscopic model as a function of the in-plane angle is shown in Fig. 9. Here, we have chosen with . We recall that we work in the limit , where the phase diagram only depends on the ratio of and and not on their individual magnitudes. The phase diagram illustrates that the threefold zigzag stacking (3f-zz) is stabilized for small fields, while a transition to an intermediate ordered phase with sixfold zigzag stacking (6f-zz) is found at elevated in-plane fields perpendicular to Ru-Ru bonds. The minimal microscopic theory presented here gives a satisfactory explanation for the observed features in the zz1 and zz2 phases with one exception: It does not predict the small inter-layer staggered antiferromagnetic component necessary to produce the peaks seen in the zz2 phase at . Importantly, the transition at is first-order, such that coexistence of the 3f-zz and 6f-zz configurations, and therefore their Bragg peaks, can be naturally expected in its vicinity as a consequence of hysteresis effects. We note that a first-order transition from zz1 to zz2 at is consistent with other thermodynamic measurements reported in the literature Bac20; Sch20; Bac21.
VI.3 Magnetization curves
The magnetization at fixed field strengths as a function of the in-plane angle is shown in Fig. 10. The low-field limit of this magnetization curve has previously been discussed in Ref. Jan17. In this limit, the magnetization is maximal for fields along Ru-Ru bonds and minimal for fields perpendicular to Ru-Ru bonds, with a characteristic kink that can be understood as a domain switching effect. Increasing the field strength now shifts these minima upwards, such that the magnetization becomes nearly independent for fields just below , until eventually the maxima and minima exchange for fields between and , in qualitative agreement with the experiment. In the polarized phase, the magnetization curve is flat, which is a classical property that will change upon the inclusion of quantum fluctuations Jan17.
VII Discussion
The comparison of the experimental and theoretical results in terms of the angle-dependent phase diagrams [Figs. 1(b) and 9], as well as the magnetization curves [Figs. 3(g) and 10], reveals that the key features of the experiment are reproduced by the model calculation: (i) A first-order phase transition occurs at a critical field between zigzag structures with threefold and sixfold stacking. (ii) Both the critical fields and the magnetization curves have (approximately) a 60∘ periodicity, consistent with the rotational symmetry of the honeycomb lattice. (iii) The critical fields are maximal for fields along Ru-Ru bonds () and minimal for fields perpendicular to a bond (). (iv) The width of the intermediate phase is maximal when the critical field is minimal, and vice versa. (v) For fixed low fields, the magnetization is maximal for and has kink-like minima at . (vi) At fixed elevated fields close to the transition to the disordered phase, on the other hand, maxima and minima in the magnetization as function of exchange.
VIII Conclusions
We have demonstrated the existence of a field-induced intermediate ordered phase in -RuCl3 at fields just below the field where the magnetic order is found to be suppressed completely. This phase is characterized by an in-plane zigzag configuration with a stacking periodicity in the out-of-plane direction that is doubled in comparison with the low-field zigzag phase. The fact that the transition at involves a change of the 3D magnetic structure shows that interlayer interactions are important in -RuCl3 and should be included in the minimal model Hamiltonian Jan20. We have proposed a simple model including Heisenberg as well as Kitaev interlayer interactions that describes the two different zigzag stackings, their field-induced transition, as well as the magnetization measurements qualitatively well. We emphasize, however, that this analysis does not enable us to draw conclusions concerning the absolute value of the interlayer interactions in -RuCl3. The previous 3D modeling Jan20 of the out-of-plane neutron scattering data Bal19 suggested a nearest-neighbor interlayer coupling of the order of meV. The present results indicate that bond-dependent interlayer interactions of the same order may play an equally important role. While such interactions are allowed by symmetry and therefore likely to be present, a microscopic mechanism that explains their significance is currently not known.
Finally, we note that the data presented here are not of sufficient resolution at high fields to comment on potential additional phase transitions in the disordered regime Kas18; Bal19; Wul19; Yokoi20. The ac susceptibility data appears mostly featureless above 8 T, however, an additional small kink can be seen between 8 and 10 T in Fig. 3(e), also visible in the false color plot in Fig. 1(a). This might be related to the topological transition out of a potential QSL phase Kas18; Bal19.
Acknowledgements.
We thank E. C. Andrade, B. Büchner, P. M. Cônsoli, S. Koch, S. Rachel, and A. U. B. Wolter for illuminating discussions and collaborations on related work. This research used resources at the Spallation Neutron Source, a DOE Office of Science User Facility operated by the Oak Ridge National Laboratory. CB, AB, YHL, and SEN were supported by the Division of Scientific User Facilities, Basic Energy Sciences US DOE, PLK and DGM by the Gordon and Betty Moore Foundation’s EPiQS Initiative through Grant GBMF4416, JQY by the U.S. Department of Energy, Office of Science, Office of Basic Energy Sciences, Materials Sciences and Engineering Division. AB and SEN acknowledges support by the Quantum Science Center (QSC), a National Quantum Information Science Research Center of the U.S. Department of Energy (DOE). LJ and MV acknowledge financial support from the Deutsche Forschungsgemeinschaft (DFG) through SFB 1143 (project id 247310070) and the Würzburg-Dresden Cluster of Excellence on Complexity and Topology in Quantum Matter – ct.qmat (EXC 2147, project id 390858490). The work of LJ is funded by the DFG through the Emmy Noether program (JA2306/4-1, project id 411750675).References
- (1) A. Kitaev, Ann. Phys. (N.Y.) 321, 2 (2006).
- (2) G. Jackeli and G. Khaliullin, Phys. Rev. Lett. 102, 017205 (2009).
- (3) J. Chaloupka, G. Jackeli, and G. Khaliullin, Phys. Rev. Lett. 105, 027204 (2010).
- (4) H. Takagi, T. Takayama, G. Jackeli, G. Khaliullin, and S. E. Nagler, Nature Rev. Phys. 1, 264 (2019).
- (5) L. Janssen and M. Vojta, J. Phys. Condens. Matter 31, 423002 (2019).
- (6) K. W. Plumb, J. P. Clancy, L. J. Sandilands, V. V. Shankar, Y. F. Hu, K. S. Burch, H. Y. Kee, and Y. J. Kim, Phys. Rev. B 90, 041112(R) (2014).
- (7) J. A. Sears, M. Songvilay, K. W. Plumb, J. P. Clancy, Y. Qiu, Y. Zhao, D. Parshall, and Y.-J. Kim, Phys. Rev. B 91, 144420 (2015).
- (8) A. Banerjee, C. A. Bridges, J.-Q. Yan, A. A. Aczel, L. Li, M. B. Stone, G. E. Granroth, M. D. Lumsden, Y. Yiu, J. Knolle, S. Bhattacharjee, D. L. Kovrizhin, R. Moessner, D. A. Tennant, D. G. Mandrus, and S. E. Nagler, Nat. Mater. 15, 733 (2016).
- (9) A. Banerjee, J.-Q. Yan, J. Knolle, C. A. Bridges, M. B. Stone, M. D. Lumsden, D. G. Mandrus, D. A. Tennant, R. Moessner, and S. E. Nagler, Science 356, 1055 (2017).
- (10) A. Banerjee, P. Lampen-Kelley, J. Knolle, C. Balz, A. A. Aczel, B. Winn, Y. Liu, D. Pajerowski, J.-Q. Yan, C. A. Bridges, A. T. Savici, B. C. Chakoumakos, M. D. Lumsden, D. A. Tennant, R. Moessner, D. G. Mandrus, and S. E. Nagler, npj Quantum Mater. 3, 8 (2018).
- (11) C. Balz, P. Lampen-Kelley, A. Banerjee, J. Q. Yan, Z. Lu, X. Hu, S. M. Yadav, Y. Takano, Y.H. Liu, D. A. Tennant, M. D. Lumsden, D. Mandrus, and S. E. Nagler Phys. Rev. B 100, 060405(R) (2019).
- (12) M. Gohlke, R. Verresen, R. Moessner, and F. Pollmann, Phys. Rev. Lett. 119, 157203 (2017).
- (13) A. U. B. Wolter, L. T. Corredor, L. Janssen, K. Nenkov, S. Schönecker, S.-H. Do, K.-Y. Choi, R. Albrecht, J. Hunger, T. Doert, M. Vojta, and B. Büchner, Phys. Rev. B 96, 041405(R) (2017).
- (14) J. A. Sears, Y. Zhao, Z. Xu, J. W. Lynn, and Y.-J. Kim, Phys. Rev. B 95, 180411(R) (2017).
- (15) S.-H. Baek, S.-H. Do, K.-Y. Choi, Y. S. Kwon, A. U. B. Wolter, S. Nishimoto, J. van den Brink, and B. Büchner, Phys. Rev. Lett. 119, 037201 (2017).
- (16) J. Zheng, K. Ran, T. Li, J. Wang, P. Wang, B. Liu, Z.X. Liu, B. Normand, J. Wen, and W. Yu, Phys. Rev. Lett. 119, 227208 (2017).
- (17) I. A. Leahy, C. A. Pocs, P. E. Siegfried, D. Graf, S.-H. Do, K.-Y. Choi, B. Normand, and M. Lee, Phys. Rev. Lett. 118, 187203 (2017).
- (18) S. M. Winter, K. Riedl, D. Kaib, R. Coldea, and R. Valentí, Phys. Rev. Lett. 120, 077203 (2018).
- (19) R. Hentrich, A. U. B. Wolter, X. Zotos, W. Brenig, D. Nowak, A. Isaeva, T. Doert, A. Banerjee, P. Lampen-Kelley, D. G. Mandrus, S. E. Nagler, J. Sears, Y.-J. Kim, B. Büchner, and C. Hess, Phys. Rev. Lett. 120, 117204 (2018).
- (20) T. Yokoi, S. Ma, Y. Kasahara, S. Kasahara, T. Shibauchi, N. Kurita, H. Tanaka, J. Nasu, Y. Motome, C. Hickey, S. Trebst, and Y. Matsuda arXiv:2001.01899.
- (21) S. Gass, P. M. Cônsoli, V. Kocsis, L. T. Corredor, P. Lampen-Kelley, D. G. Mandrus, S. E. Nagler, L. Janssen, M. Vojta, B. Büchner, and A. U. B. Wolter, Phys. Rev. B 101, 245158 (2020).
- (22) S. Bachus, D. A. S. Kaib, Y. Tokiwa, A. Jesche, V. Tsurkan, A. Loidl, S. M. Winter, A. A. Tsirlin, R. Valentí, and P. Gegenwart, Phys. Rev. Lett. 125, 097203 (2020).
- (23) L. E. Chern, E. Z. Zhang, and Y. B. Kim; arXiv:2008.12788.
- (24) O. Tanaka, Y. Mizukami, R. Harasawa, K. Hashimoto, N. Kurita, H. Tanaka, S. Fujimoto, Y. Matsuda, E.-G. Moon, T. Shibauchi, arXiv:2007.06757.
- (25) Y. Kasahara, T. Ohnishi, Y. Mizukami, O. Tanaka, S. Ma, K. Sugii, N. Kurita, H. Tanaka, J. Nasu, Y. Motome, T. Shibauchi, and Y. Matsuda, Nature 559, 227 (2018).
- (26) A. Sahasrabudhe, D. A. S. Kaib, S. Reschke, R. German, T. C. Koethe, J. Buhot, D. Kamenskyi, C. Hickey, P. Becker, V. Tsurkan, A. Loidl, S. H. Do, K. Y. Choi, M. Grüninger, S. M. Winter, Z. Wang, R. Valentí, and P. H. M. van Loosdrecht, Phys. Rev. B 101, 140410(R) (2020).
- (27) D. Wulferding, Y. Choi, S.-H. Do, C.H. Lee, P. Lemmens, C. Faugeras, Y. Gallais, and K.-Y. Choi, Nat. Commun. 11, 1603 (2020).
- (28) Z. Wang, S. Reschke, D. Hüvonen, S.-H. Do, K.-Y. Choi, M. Gensch, U. Nagel, T. Rõõm, and A. Loidl, Phys. Rev. Lett. 119, 227202 (2017).
- (29) A. N. Ponomaryov, L. Zviagina, J. Wosnitza, P. Lampen-Kelley, A. Banerjee, J.-Q. Yan, C. A. Bridges, D. G. Mandrus, S. E. Nagler, and S. A. Zvyagin, Phys. Rev. Lett. 125, 037202 (2020).
- (30) I. Kimchi and Y.-Z. You, Phys. Rev. B 84, 180407(R) (2011).
- (31) J. Chaloupka, G. Jackeli, and G. Khaliullin, Phys. Rev. Lett. 110, 097204 (2013).
- (32) J. G. Rau, E. K.-H. Lee, and H-Y. Kee, Phys. Rev. Lett. 112, 077204(R) (2014).
- (33) Y. Sizyuk, C. Price, P. Wölfle, and N. B. Perkins, Phys. Rev. B 90, 155126 (2014).
- (34) I. Rousochatzakis, J. Reuther, R. Thomale, S. Rachel, and N. B. Perkins, Phys. Rev. X 5, 041035 (2015).
- (35) S. M. Winter, Y. Li, H. O. Jeschke, and R. Valentí, Phys. Rev. B 93, 214431 (2016).
- (36) S. M. Winter, K. Riedl, A. Honecker, and R. Valentí, Nat. Commun. 8, 1152 (2017).
- (37) L. Janssen, E. C. Andrade, and M. Vojta, Phys. Rev. B 96, 064430 (2017).
- (38) T. Suzuki and S.I. Suga, Phys. Rev. B 97, 134424 (2018).
- (39) P. Lampen-Kelley, S. Rachel, J. Reuther, J.-Q. Yan, A. Banerjee, C. A. Bridges, H. B. Cao, S. E. Nagler, and D. Mandrus, Phys. Rev. B 98, 100403(R) (2018).
- (40) L. Janssen, S. Koch, and M. Vojta, Phys. Rev. B 101, 174444 (2020).
- (41) P. A. Maksimov and A. L. Chernyshev, Phys. Rev. Research 2, 033011 (2020).
- (42) The present paper supersedes Ref. Kel18b. That reference proposed that the intermediate-field ordered phase displays an in-plane magnetic order different from zigzag, which was disproven by subsequent neutron diffraction measurements reported here. The model calculations in Ref. Kel18b are correct, but do not apply to -RuCl3.
- (43) P. Lampen-Kelley, L. Janssen, E. C. Andrade, S. Rachel, J.-Q. Yan, C. Balz, D. G. Mandrus, S. E. Nagler, and M. Vojta, arXiv:1807.06192v1.
- (44) S. Rosenkranz and R. Osborn, Pramana – J. Phys. 71, 705 (2008).
- (45) O. Arnold, J.-C. Bilheux, J. M. Borreguero, A. Buts, S.I. Campbell, L. Chapon, M. Doucet, N. Draper, R. Ferraz Leal, M. A. Gigg, V. E. Lynch, A. Markvardsen, D. J. Mikkelson, R. L. Mikkelson, R. Miller, K. Palmen, P. Parker, G. Passos, T. G. Perring, P. F. Peterson, S. Ren, M. A. Reuter, A. T. Savici, J. W. Taylor, R. J. Taylor, R. Tolchenov, W. Zhou, J. Zikovsky, Nucl. Instrum. Methods Phys. Res. A 764, 156 (2014).
- (46) Y. J. Yu, Y. Xu, K. J. Ran, J. M. Ni, Y. Y. Huang, J. H. Wang, J. S. Wen, and S. Y. Li, Phys. Rev. Lett. 120, 067202 (2018).
- (47) S.-Y. Park, S.-H. Do, K.-Y. Choi, D. Jang, T.-H. Jang, J. Schefer, C.-M. Wu, J. S. Gardner, J. M. S. Park, J.-H. Park, and S. Ji, arXiv:1609.05690.
- (48) H. B. Cao, C. Balz, et al. (unpublished).
- (49) A. Glamazda, P. Lemmens, S.-H. Do, Y. S. Kwon, and K.-Y. Choi, Relation between Kitaev magnetism and structure in -RuCl3, Phys. Rev. B 95, 174429 (2017).
- (50) R. Schonemann, S. Imajo, F. Weickert, J.Q. Yan, D. G. Mandrus, Y. Takano, E. L. Brosha, P.F.S. Rosa, S. E. Nagler, K. Kindo, and M. Jaime, Phys. Rev. B 102, 214432 (2020).
- (51) S. Bachus, D. A. S. Kaib, A. Jesche, V. Tsurkan, A. Loidl, S. M. Winter, A. A. Tsirlin, R. Valentí, and P. Gegenwart, arXiv:2101.07275.
*
Appendix: Detailed cuts through the neutron diffraction data

Fig. 11 shows cuts through the points taken within the honeycomb plane. Each of the four points , , , and is cut in two different directions indicated in the inset of Fig. 11(a). While panels (a), (b), (e), and (f) are cuts along , panels (c), (d), (g), and (h) are cuts along .
Panels (a-d), which are taken at integer , show that the magnetic Bragg peaks remain at commensurate positions upon entering the zz2 phase (red data points). The only difference between 3.5 T and 6.6 T is a reduction in intensity. This agrees with the expectation for an overall order parameter upon approaching the point at which magnetic order is destroyed, cf. Fig. 6. The difference in intensities between the four points, which also changes under increasing magnetic field, is attributed to the presence of different crystallographic and magnetic domains and their nontrivial field evolutions.
Panels (e-h) show the appearance of new magnetic peaks in the zz2 phase (red data points) at half-integer values, which are approximately one order of magnitude weaker compared to the ones at integer . These also appear at commensurate positions and again show differences in intensities between the four points. Since they are absent in the zz1 phase (blue data points), their appearance clearly marks the entrance into a new thermodynamic phase.