Tantalum-Palladium: hysteresis-free optical hydrogen sensor over 7 orders of magnitude in pressure with sub-second response
Abstract
Hydrogen detection in a reliable, fast, and cost-effective manner is a prerequisite for the large-scale implementation of hydrogen in a green economy. We present thin film Ta1-yPdy as effective optical sensing materials with extremely wide sensing ranges covering at least seven orders of magnitude in hydrogen pressure. Nanoconfinement of the Ta1-yPdy layer suppresses the first-order phase transitions present in bulk and ensures a sensing response free of any hysteresis. Unlike other sensing materials, Ta1-yPdy features the special property that the sensing range can be easily tuned by varying the Pd concentration without a reduction of the sensitivity of the sensing material. Combined with a suitable capping layer, sub-second response times can be achieved even at room temperature, faster than any other known thin-film hydrogen sensor.
I Introduction
Hydrogen is projected to fuel tomorrow’s green economy Brandon and Kurban 2017; nat 2020; Abe et al. 2019; Glenk and Reichelstein 2019; Bannenberg et al. 2020a; El Kharbachi et al. 2020. Reliable and inexpensive hydrogen sensors are a vital ingredient for the large scale adaptation of hydrogen, being an odorless, colorless and tasteless gas with a wide flammability range in air. As such, any leaks of hydrogen must be detected immediately, calling for efficient, fast, reliable and cost-effective hydrogen sensors. Apart from safety applications, precise monitoring of hydrogen concentrations and pressures is crucial for the efficient and reliable operation of hydrogen fuel cells, CO2 conversion devices, and in a variety of industrial processes Bakenne et al. 2016; El Kharbachi et al. 2020.
Optical metal-hydride hydrogen sensors are an attractive candidate for large scale implementation in the future hydrogen economy Bannenberg et al. 2020b; Darmadi et al. 2020; Sterl et al. 2020; Koo et al. 2020; Chen et al. 2021. Their working principle is based on the fact that the optical properties change when metal hydrides partly hydrogenate when they are exposed to a hydrogen atmosphere. These changes are probed by for example measuring the fraction of transmitted or reflected light or the frequency shift of the (localized) surface plasmon resonance peak and from one of these optical signals the partial hydrogen pressure can be determined. Compared to conventional ways of detecting hydrogen such as catalytic resistor detectors and electrochemical devices, optical fiber hydrogen sensors are inherently safe and can be made small and inexpensive Hughes et al. 1991; Butler 1991; Hübert et al. 2011; Perrotton et al. 2011; Slaman et al. 2012; Javahiraly and Perrotton 2014; Bannenberg et al. 2020b; Darmadi et al. 2020; Koo et al. 2020; Chen et al. 2021.
An ideal hydrogen sensing material should feature a large sensing range, hysteresis-free response, high sensitivity and fast response to changing hydrogen pressures. Palladium, being the metal hydride considered most frequently for hydrogen sensing applications Hughes et al. 1991; Butler 1991; Silva et al. 2012; Perrotton et al. 2013; Wadell et al. 2014, features some of these properties: it is capable of dissociating hydrogen at room temperature and has a modest sensing range of three orders of magnitude in pressure. However, the first-order transition from the dilute -PdHx to the higher hydrogen concentration PdHx -phase occurring upon hydrogenation causes relatively long response times and renders the optical response highly hysteric and non-linear. Alloying Pd with elements including Au Zhao et al. 2006; Westerwaal et al. 2013; Wadell et al. 2015; Nugroho et al. 2018; Nugroho et al. 2019; Bannenberg et al. 2019a; Palm et al. 2019, NiDai et al. 2012; Dai et al. 2014, Ag Wang and Feng 2007 and Cu Darmadi et al. 2019 partly overcomes these serious shortcomings: it eliminates the first order phase transition but also significantly reduces the optical contrast and thus reduces the sensitivity of the sensor. Moreover, hysteresis arising from the expansion of the film upon hydrogenation and its clamping of the film to the support remains present Bannenberg et al. 2019a. Alternatively, hydrogen sensors with separate hydrogen dissociation and sensing functionality can be developed Slaman et al. 2007; Boelsma et al. 2017; Bannenberg et al. 2019b. For example, Pd-capped Hf thin films were shown to be able to hysteresis-free sense hydrogen over a large pressure range. However, its functionality has only been demonstrated at elevated temperatures ( 90C) and modest hydrogen pressures of 102 Pa.
As such, new sensing materials have to be discovered to simultaneously meet the requirements of a large sensing range, hysteresis-free response, high sensitivity and fast response to changing hydrogen pressures both at room and elevated temperatures. In terms of material properties, this can be realized by a large solubility of hydrogen within one thermodynamic phase, a profound change of the optical properties upon hydrogenation and a high diffusivity of hydrogen Fukai 2006; Bannenberg et al. 2020b. Tantalum is in principle a suitable candidate: TaHx has a large solubility window of 0 0.9 for 61 C within one thermodynamic phase that would thus result in a wide sensing range without hysteresis. Furthermore, the optical properties of Ta show a relatively large and gradual change upon hydrogenation, thus ensuring a high sensitivity of the sensor Bannenberg et al. 2019b while the body-centered cubic structure of Ta results in a high hydrogen diffusivity that allows fast response times Bannenberg et al. 2019b. However, below its critical temperature of = 61 C a series of phase transitions reported for bulk Ta and associated nucleation of domains render the hydrogenation slow and, most importantly, highly hysteric, which makes Ta in principle unsuitable for sensing purposes.
Using a combination of nanoconfinement and alloying, we tailor the properties of Ta and design hysteresis-free hydrogen sensors with extremely wide sensing ranges of at least seven orders of magnitude in hydrogen pressure. The nanoconfinement of Ta1-yPdy suppresses the first-order phase transitions present in bulk at room temperature and ensures a sensing response free of any hysteresis. Unlike other sensing materials, the sensing range of Ta1-yPdy can be easily tuned by varying the Pd concentration in the alloy without a reduction of the optical contrast and thus the sensitivity of the sensing material. Combined with a capping layer of Pd0.6Au0.35Cu0.05 covered with a 30 nm polytetrafluoroethylene (PTFE) layer, it features a sub-second response at room temperature in a pressure range of 10+2 10+5, i.e. a concentration of 0.1 to 100% under ambient conditions. As such, the Ta1-yPdy based thin film sensor meets the most stringent set of criteria for hydrogen sensors of the U.S. Department of Energy U.S. Department of Energy and Renewable Energy EERE, which, combined with its relatively easy and cheap manufacturing, make it exceptionally well-suited for the large scale adaptation in tomorrow’s hydrogen economy.
II Results and discussion
II.1 Optical response
A suitable optical hydrogen sensing material should feature a monotonic and gradual change of the optical properties in a large range in hydrogen pressures without any dependence on the (pressure) history of the sensor. To study the behavior of the Ta1-yPdy thin films, we measure the changes of the white-light optical transmission relative to that of the as-prepared state when applying a series of increasing and decreasing hydrogen pressure steps at room temperature.




The results for the Pd capped 40 nm Ta and Ta0.88Pd0.12 thin films are displayed in Figure 1 and reveal a complicated optical response: the response of these films is highly non-linear and hysteretic as a result of interference between the optical response of the Pd-capping layer and the Ta1-yPdy sensing layer. To deconvolute the response of the Pd capping layer and the Ta1-yPdy sensing layers, we subtract the optical response of a Pd-capped Ta0.5Pd0.5 thin film from the film of interest (Fig. 1). Ta0.5Pd0.5 does not show any optical response in the investigated pressure range to hydrogen and provides similar adhesion conditions to the Pd cap layer, ensuring that the response of the Pd layer to hydrogen mimics the one on top of the film of interest. The resulting deconvolution displays a remarkable result. The non-linear and hysteretic optical response to hydrogen of the Pd capped Ta1-yPdy thin films is completely the result of the Pd capping layer. Indeed, the optical transmission of the Ta1-yPdy sensing layer decreases monotonically with increasing pressure, is stable, well-defined and free of any hysteresis.
To obtain a hysteresis-free monotonic response without the need of such a deconvolution we need a different capping layer for which we select Pd0.60Au0.35Cu0.05. The introduction of Au and Cu in this alloy ensures that this layer hardly hydrogenates, thus not generating a sizable optical contrast (Figure S1). Moreover, the source of the hysteresis, the first-order metal-to-metal hydride transition in Pd, is completely suppressed Sakamoto et al. 1991; Darmadi et al. 2019. In addition, we cover this capping layer by a 30 nm PTFE layer to promote the hydrogenation kinetics Ngene et al. 2014; Nugroho et al. 2019. Figure 2 displays the changes in white-light optical transmission of the Ta0.88Pd0.12 thin film capped with 10 nm of Pd0.6Au0.35Cu0.05 in three different pressure regions with 4.010-1 1.510+5 Pa. In all three pressure regions, the optical transmission shows a substantial and monotonic decrease with increasing pressure. The levels of transmission are well-defined and stable for a given partial hydrogen pressure, and, importantly, free of any hysteresis: the optical transmission is, in accordance with the in-situ XRD measurements (See Section 2.2), the same after increasing and decreasing pressure steps. We note that the sharp peaks in optical transmission during desorption in Fig. 2 are the results of undershoots in hydrogen pressure during the measurements. As such, these peaks are exemplary of the fast response of the material to changing hydrogen pressures.
In Figure 3 we summarize the optical transmission measurements performed for a set of different pressures between 1.010-1 1.010+6 Pa, for various Pd/Ta ratios of 0.0 0.36, and for temperatures of 28, 60, 90 and 120 C. In this figure, we plot the pressure-transmission-isotherms (PTIs) of the sensing layers, where each closed data-point corresponds to the optical transmission obtained after exposing the film for at least one hour to a constant pressure after an increase in pressure, and the open points to the transmission after decreasing pressure steps.
The PTIs at room temperature (Figure 3(a)) reveal for all Ta1-yPdy films with 0.12 including pure Ta an excellent optical response with no hysteresis and a large and almost constant sensitivity over an extremely wide sensing range of at least 7 orders of magnitude in pressure. This makes this material unique, as the metal hydride known so far with the largest sensing range at room-temperature, Pd1-yAuy, only features a sensing range of roughly 4 orders in magnitude.
The hydrogenation of metal-hydrides depends in general on the temperature, with the result that the PTIs and thus the sensing range shifts to higher pressures with increasing temperatures. Nevertheless, we find that for all temperatures measured the Ta1-yPdy thin films with 0.12 keep their sensing-range of at least 7 orders in magnitude between 10-1 10+6 Pa, ensuring that the sensing material can be used for a wide range of applications and under various operating conditions. Differently, the films with 0.12 display a more complex optical response to hydrogen. As this response involves substantial hysteresis in the optical response, these alloys are unsuitable for most hydrogen sensing applications.
In contrast to many other sensing materials such as Pd1-yAuy, Pd1-yAgy and Mg-alloys, Ta1-yPdy has the major benefit that the compositional tuning of the sensing range does not decrease the optical contrast and thus the sensitivity of the sensor. Despite the fact that the hysteresis-free sensing range in Ta1-yPdy can be tuned by varying between 0 0.12, we envision that Ta0.88Pd0.12 is the most attractive composition for the majority of applications. It has an exceptionally large sensing range of at least 1.0 1.0 Pa, i.e. seven orders in magnitude, for a wide temperature window ranging from room temperature up to = 120 C (Figure 3(c)). This massive sensing range is larger than any other material reported so far and highlights the versatile nature of the material: it can be used both to discover tiny hydrogen leaks at extremely low hydrogen pressures as well as to probe hydrogen concentrations in environments where hydrogen is omnipresent such as in fuel cells or in various industrial processes.
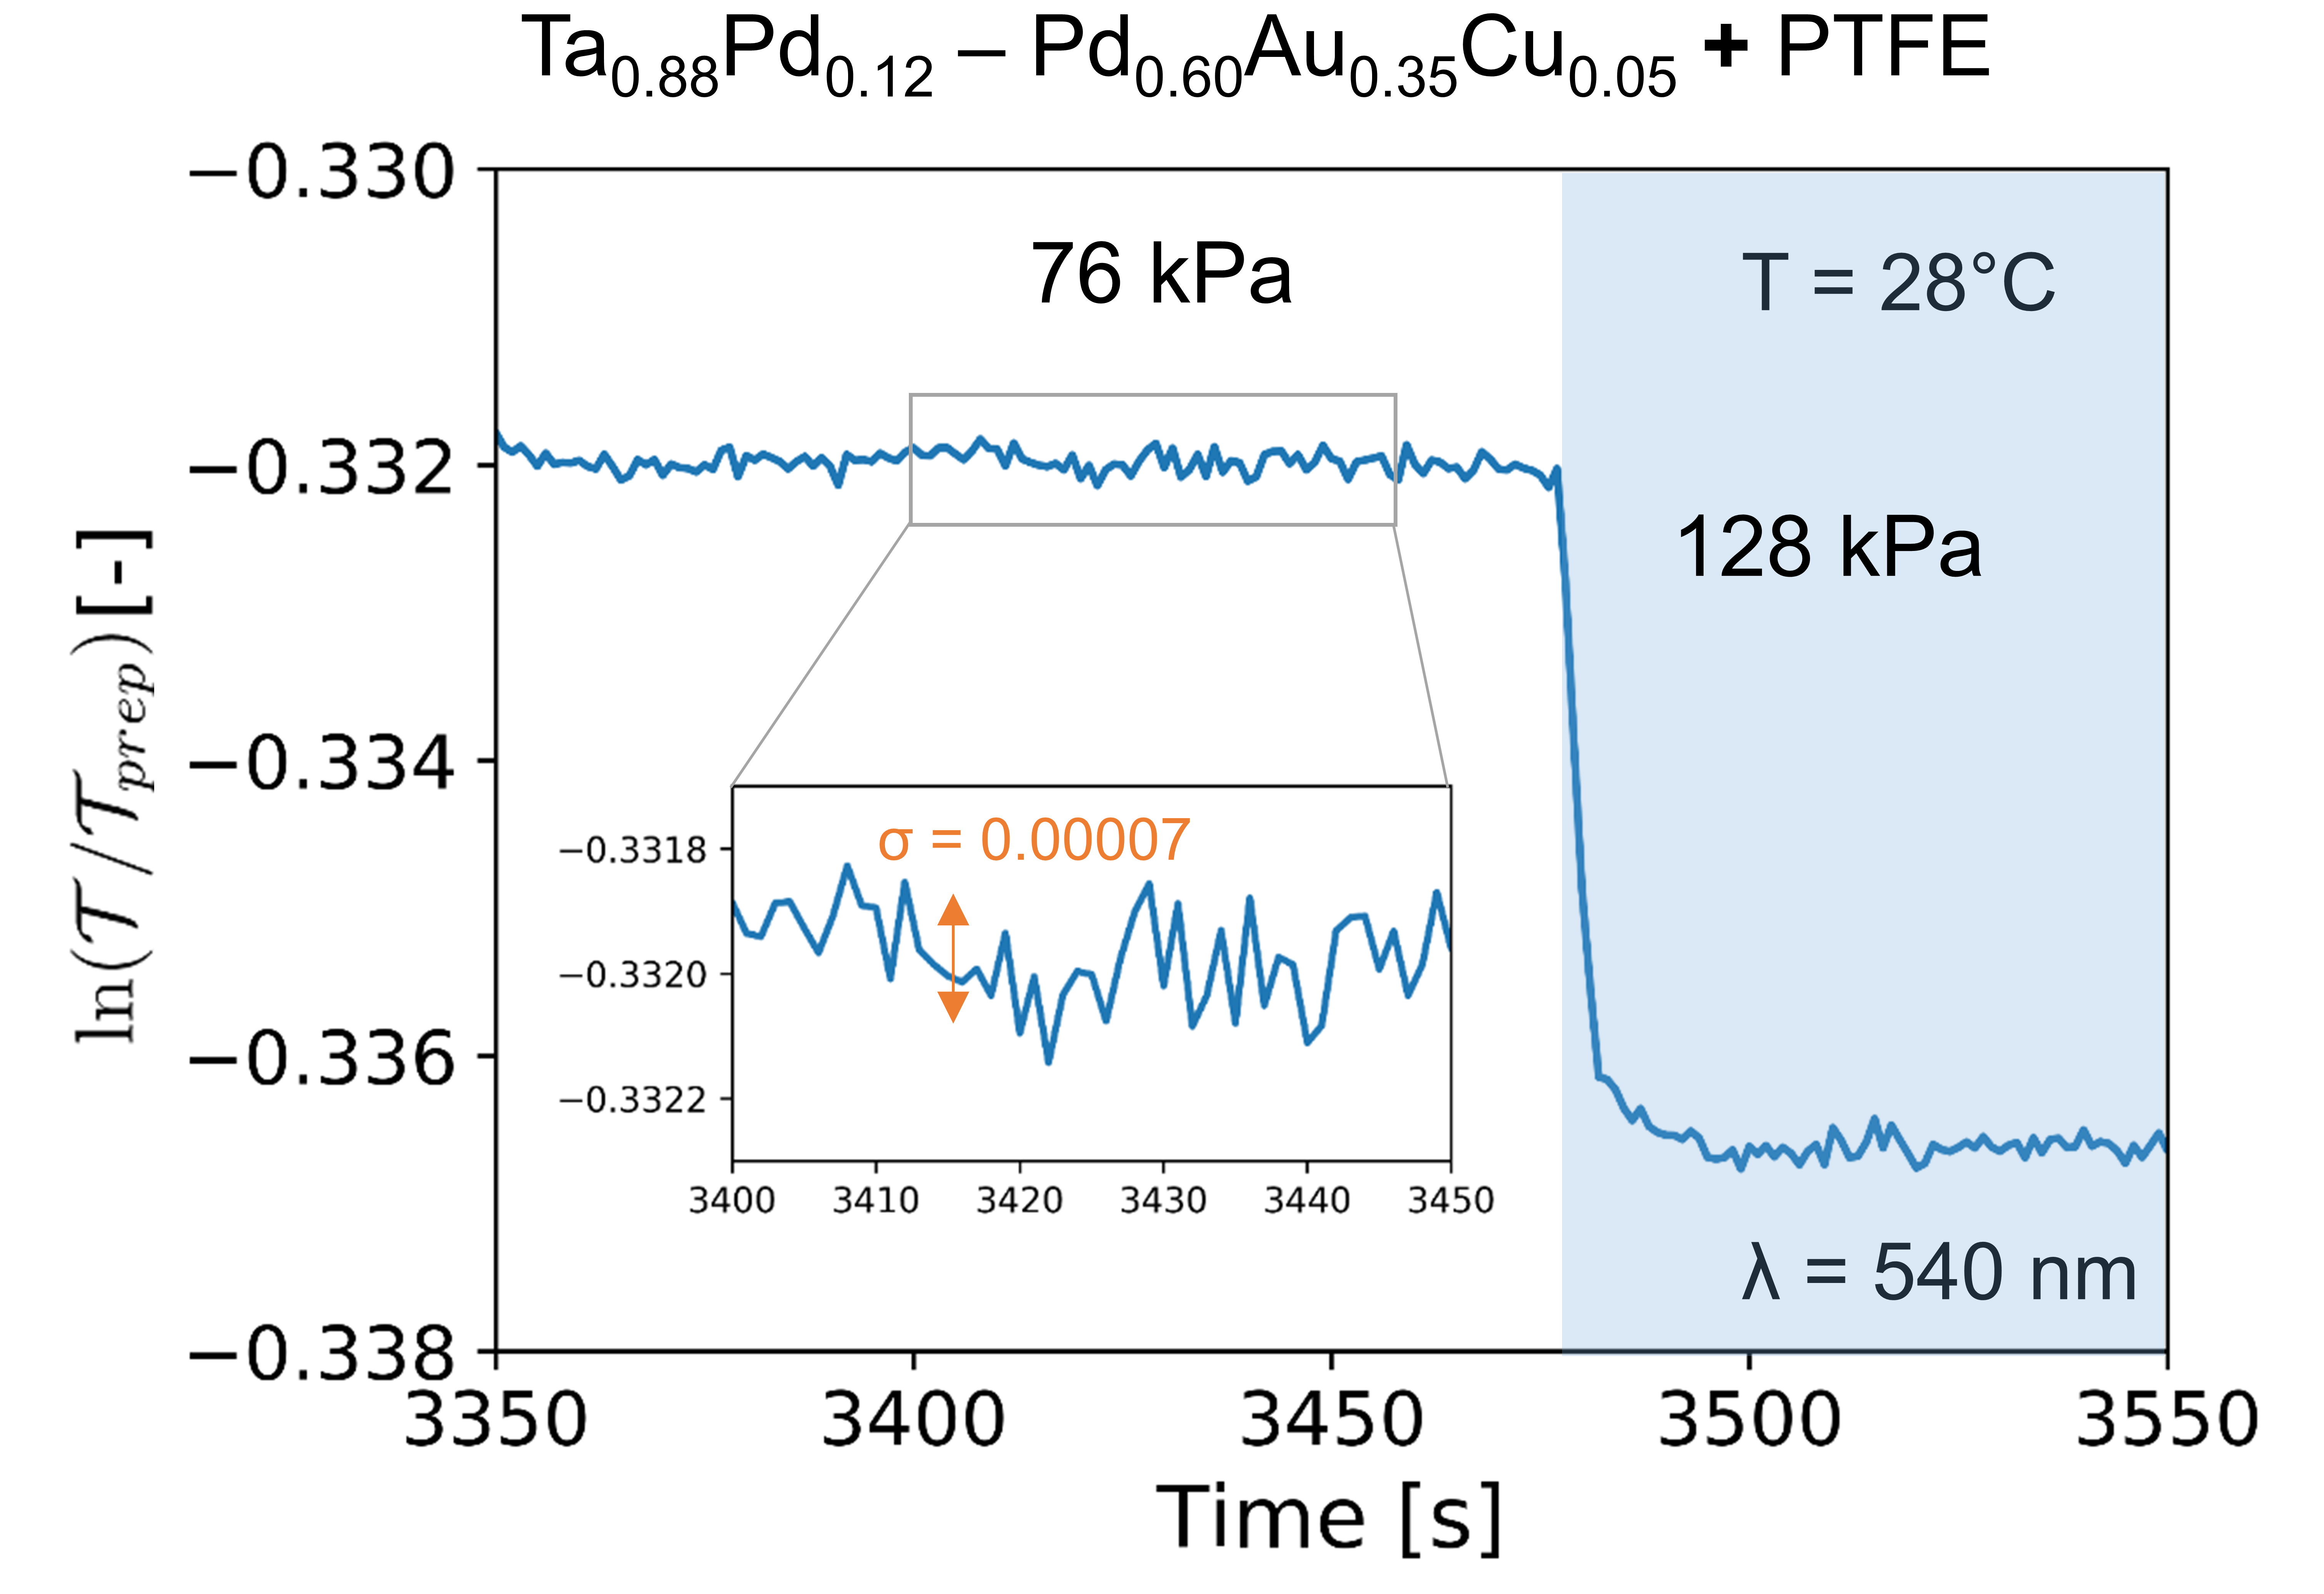
Furthermore, Ta0.88Pd0.12 has the largest sensitivity among all compounds at room temperature in the range 1.0 1.0 Pa, i.e., the range most applicable for hydrogen leak detection. In fact, wavelength-dependent measurements reveal that the optical contrast, and thus the sensitivity, is strongly wavelength dependent (Figure S2). Its sensitivity is largest for wavelengths of 470 550 nm. Figure 4 illustrates that in combination with a sampling frequency of 1 Hz and at a wavelength of = 540 nm we may achieve a resolution of / = 0.008 that is relatively constant with pressure, i.e. substantially better than the most stringent requirement of 5% set by the U.S. Department of Energy U.S. Department of Energy and Renewable Energy EERE.
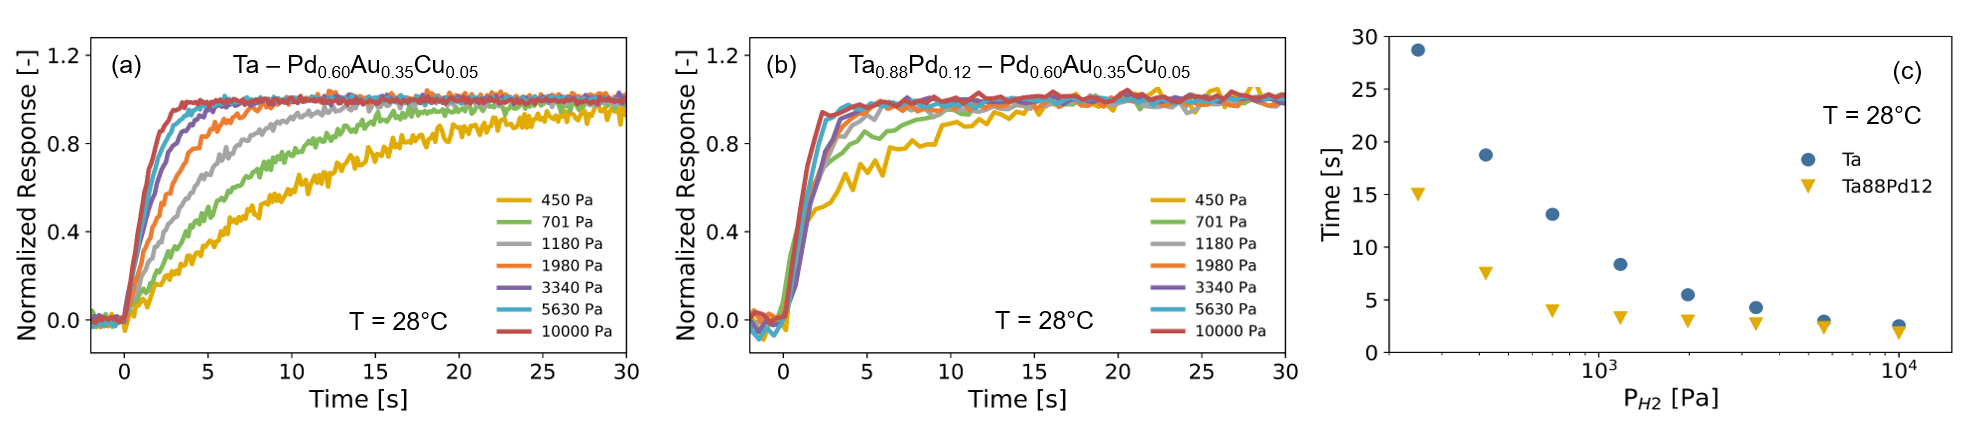
The response time of a hydrogen sensor is a key indicator of its performance, especially for safety applications and in particular for hydrogen pressures relatively close to the explosive limit of 4% in air. Figure 5 presents the room temperature response time measurements for the 40 nm Ta0.88Pd0.12 thin film capped with a 10 nm Pd0.6Au0.35Cu0.05 layer that is covered with a 30 nm PTFE layer. In Fig. 5(a) we display the normalized responses of the thin film to a series of increasing pressure steps and in Fig. 5(b) we depict the pressure dependence of the response time, defined as the time to reach 90% of the total signal in Fig. 5(a). While other thin films reported in the literature often feature relatively long response times, especially at room temperature and for Pd-based sensors, the room temperature response time of the Ta0.88Pd0.12 based thin film is below 1 s in the entire pressure window of = 10+2 10+5, i.e. a hydrogen concentration range of 0.1 to 100% under ambient conditions. Apparently, we benefit from the the well-know high diffusivity of hydrogen in bcc Ta Fukai 2006. In fact, the response time is merely limited by the amount of hydrogen that is dissociated at the surface of the capping layer and not by the hydrogen diffusion through the sensing or capping layer Bannenberg and Schreuders 2020. As such, even faster responses can be achieved by reducing the thickness of the Ta0.88Pd0.12 sensing layer as it reduces the total amount of hydrogen that needs to be dissociated at the surface. Note, that the response times we achieve with our 40 nm sensing layer are already shorter than other hydrogen sensors including metal-hydride nanoparticles Nugroho et al. 2019.
Another key requirement of hydrogen sensors is long-term stability of the optical response. To illustrate the stability of the sensor response, we exposed the thin film to 310 cycles of hydrogen between = 1.0 and 4.0 10+3 Pa at = 28 C (only 90 cycles displayed). Figure 6(a) shows that the cycles are identical to each other, even after exposure to over 300 cycles of hydrogen. This conclusion is further underscored by the three individual cycles selected at random for which we observe a very close correspondence (Figure 6(b)). Together, these results indicate an excellent stability and reproducibility of the optical response of the thin film sensor for a large number of cycles.
To ensure a long lifetime and stable performance of the hydrogen sensor, it should have a good chemical selectivity of the material and protection against poisoning by chemical species. Although the inclusion of 5% of Cu in the capping layer of Pd provides protection against deactivation by CO Darmadi et al. 2019, additional protection can be provided by coating the PTFE layer with 30 nm of poly(methylmethacrylate) (PMMA). This coating has been shown to provide significant protection against CO, CO2 and NO2 without a reduction of the response times Nugroho et al. 2019.
II.2 Structural behavior
The sensing results on Ta1-yPdy thin films suggests that (i) no phase segregation occurs and thus that a solid solution of Ta and Pd is formed and that no segregation takes place during hydrogenation as this would reduce the lifetime and stability of the sensor and (ii) that no (first-order) phase transitions occur upon hydrogenation as this would induce a hysteretic response with long response times.
X-Ray Diffraction (XRD) measurements reveal that the Pd-capped Ta1-yPdy thin films form, as in bulk Darby Jr et al. 1963; Waterstrat et al. 1978, a solid solution with no signs of phase segregation for 0.12. This holds true both for the as-prepared films and the films after exposure to at least 300 cycles of hydrogen. The measurements are displayed in Figure 7 and show that all Ta1-yPdy thin films are textured in the direction (Figure 7(a,b) and S8). With increasing Pd doping, the 110 diffraction peak slightly broadens and shifts to the right for 0.21, corresponding to an almost linear decrease of the -spacing with increasing Pd concentration (Figure 7(c)). This contraction of the unit cell is anticipated owing to the lower atomic number of Pd as compared to Ta and has the benefit that it would shift the pressure range of the sensing material to higher pressures. Looking at the total intensity of the diffraction peaks, the measurements show an almost constant intensity for 0.12, consistent with the fact that the films are a solid solution of Ta and Pd. For 0.12 a continuous decrease of the intensity of the diffraction peak is observed with increasing Pd concentration (Figure 7(d)), and ultimately, for Ta0.5Pd0.5 no diffraction peaks related to a Ta1-yPdy phase are detected. As other crystalline phases may be textured as well and have a different preferential orientation, we also performed diffraction measurements at different tilting angles of the film (Figure S5). Unlike bulk Ta1-yPdy Darby Jr et al. 1963; Waterstrat et al. 1978, these measurements did not reveal any additional crystalline phase. As such, the XRD measurements are consistent with the formation of a solid solution of Ta and Pd for 0.12 and the coexistence of a crystalline phase and an (X-ray) amorphous phase for 0.12 of which the amorphous fraction increases with increasing Pd. The formation of a solid solution which is stable on hydrogen cycling explains why the films with 0.12 are most suitable for hydrogen sensing purposes.
While the hydrogenation of Ta1-yPdy has never been studied before, the Ta-H phase diagram is well-known for bulk Ta Pryde and Tsong 1971; San-Martin and Manchester 1991; Schober 1996. Below the critical temperature of = 61 C various ordered and disordered cubic and orthorhombic phases are found in bulk TaHx for various values of , and the transitions between these phases are known to be of first-order and involve substantial hysteresis.
For the nanosized thin films, the sensing measurements reveal a hysteresis free response over the entire pressure window at room temperature, suggesting that the various phase transitions are suppressed. The in-situ XRD measurements of Figure 8 confirm this: with increasing hydrogen pressure, we find a continuous shift of the diffraction peak to lower angles (Figure 8(a)), indicating a gradual hydrogenation and expansion of the TaHx bcc unit cell. In addition, and strikingly different from bulk Ta, we do not find any sign of hysteresis when we stepwise decreased the hydrogen pressure. The same trends are found for Ta0.88Pd0.12 (Figure 8(b,c)), showing that for both materials no structural phase transition occurs upon exposure to hydrogen. As such, these diffraction results indicate a wide hydrogen solubility window over a large pressure range within one single thermodynamic phase. Based on the linear scaling between the changes in optical transmission and the metal-to-hydrogen ratio as derived through in-situ neutron reflectometry experiments Bannenberg et al. 2019b; Bannenberg et al. 2020b, we find that TaHx hydrogenates at room temperature and at = 106 Pa to 0.8. This implies a solubility window of x 0.8 that is substantially larger than for instance thin film Pd1-yAuy or Hf. Indeed, these two most competitive metal hydride hydrogen sensing materials both have a solubility window of x 0.4. The combination of a wide solubility window and not signs of any hysteresis is highly beneficial for hydrogen sensing: it allows for the hysteresis-free sensing of hydrogen in a wide pressures window of over 7 orders in magnitude with relatively short response times that are not hindered by the nucleation of domains.
The suppression of the first-order phase transitions in sputtered Ta thin films highlights the profound impact of nanostructering on the properties of metal hydrides. Accommodating hydrogen in the Ta lattice results in lattice expansion, inducing strain in the host metal lattice. Different from bulk materials, two-dimensional clamped films have to obey constraints on lateral expansion as expansion can only be realized in the out-of-plane direction, which may result in a very high in-plane stress Pundt and Kirchheim 2006; Pivak et al. 2009; Wagner and Pundt 2008; Wagner and Pundt 2016; Burlaka et al. 2016. In addition, the nucleation of domains, inducing locally large stresses, may also be hindered considerably by the clamping of the film to the substrate Pundt and Kirchheim 2006; Mooij and Dam 2013; Bannenberg et al. 2016; Baldi et al. 2018; Bannenberg et al. 2019a; Burlaka et al. 2016; Wagner et al. 2019, with the ultimate result that the critical temperature is effectively reduced. Remarkable is that the reduction of the critical temperature is not accompanied by the introduction of hysteresis arising from plastic deformation as is e.g. the case in Pd and Pd1-yAuy thin films. This may either imply that the critical stress to suppress the phase transition in the highly-textured films is relatively low, or that the stress to induce plastic deformation is sufficiently high for Ta1-yPdy. Irrespective of the scenario, the absence of hysteresis of any sort positions Ta1-yPdy as an attractive material for thin film hydrogen sensing applications.
The fact that nanostructuring suppresses the undesired first order phase transitions in Ta may imply that hysteresis-free hydrogen sensing is not possible in other nanoconfinements as e.g. in the form of Ta nanoparticles deposited on a substrate or when the thickness of the film is altered. Indeed, previous research on metal hydrides has shown that the way a metal hydride is nanostructured strongly affects the hydrogen solubility and the presence of phase transitions Feenstra et al. 1983; Pivak et al. 2009; Bloch et al. 2010; Baldi et al. 2014; Syrenova et al. 2015; Griessen et al. 2016; Burlaka et al. 2016; Wagner and Pundt 2016; Bannenberg et al. 2019a. However, the alloying of tantalum with Pd also results in a smaller unit cell, with the result that the critical temperature is likely to be lowered as a result of this compression. As such, this would make hysteresis-free hydrogen sensing with Ta1-yPdy possible with other geometries than thin films such as nanoparticles in combination with a frequency-modulated localized surface plasmon resonance optical readout.
III Conclusion
In conclusion, Ta1-yPdy is an effective and versatile hydrogen sensing material that has a sensing range of at least seven orders of magnitude in pressure both at room and elevated temperatures. Nanoconfinement of the Ta1-yPdy layer suppresses the series of first-order phase transitions present in bulk and ensures a sensing response free of any hysteresis within a single thermodynamic phase. The alloying with Pd compresses the unit cell and is effective in tuning the sensing range without a loss of sensitivity of the sensor. In combination with suitable and rationally designed capping layers, it features sub-second response times at room temperature that are faster than any reported thin film sensing material. The combination of these short response times, large sensing range and possibility for cost-effective production paves the way for a large-scale implementation of this material in a sustainable hydrogen powered economy.
IV Experimental Section
IV.1 Sample preparation
The Ta1-yPdy thin film samples are composed of a 4 nm titanium adhesion layer, a 40 nm Ta1-yPdy sensing layer and a 10 nm capping layer to catalyze the hydrogen dissociation and recombination reaction and prevent the film from oxidation. As a capping layer, we used either a (i) single 10 nm Pd layer or a (ii) 10 nm Pd0.6Au0.35Cu0.05 layer covered with a 30 nm PTFE layer to reduce response timesNgene et al. 2014. The layers are deposited on 10 10 mm2 quartz substrates (thickness of 0.5 mm and surface roughness 0.4 nm) in 0.3 Pa of Ar by magnetron sputtering in an ultrahigh vacuum chamber (AJA Int.) with a base pressure of 10-10 Pa. The substrates are rotated to enhance the homogeneity of the deposited layers. Typical deposition rates include 0.13 nm s-1 (50 W DC) for Pd, 0.10 nm s-1 (125 W DC) for Ta, 0.05 nm s-1 (100 W DC) for Ti, 0.11 nm s-1 (25 W DC) for Au and 0.08 nm s-1 (25 W DC) for Cu. The deposition rates are determined by sputtering each target independently at a fixed power over a well-defined time interval. Subsequently, X-ray reflectometry (XRR) was used to determine the layer thickness of this reference sample, from which the sputter rate was computed. Differently, PTFE was deposited by radiofrequency magnetron sputtering in 0.5 Pa of Ar and the thickness of the reference film was measured with a DekTak3 profilometer. The Ta target was pre-sputtered for at least 240 min to avoid possible contamination from the tantalum oxide and nitride layers present at the surface of the target. We note that for large-scale manufacturing one can use alloy targets, and that alloys of Ta1-yPdy are, even at low concentrations of Pd, not susceptible to nitration and oxidation. This is one of the advantages of the Ta1-yPdy over single-element Ta.
The quality and thickness of all samples was verified with XRD and XRR (Figure S6). The fits to the XRR data (see below for experimental details) reveal that the deviation of the layer thickness between the different samples is at maximum 3%, that the density of the various layers is consistent with the literature value for bulk material, and that the roughness of the surface of the capping layer is at maximum 1.5 nm.
Prior to the measurements, we exposed the thin films to three cycles of hydrogen with a maximum pressure of = 10+6 Pa at = 28 C. Reproducible and hysteresis-free results are obtained from the second cycle onwards. Differences between the first and subsequent cycles are common to thin film metal hydrides, as in general, a few cycles of exposure to hydrogen are required to show reproducible results due to a settling of the microstructure. Indeed, we find that the d-spacing of the Ta1-yPdy layer decreases (Figure S7) and the preferred orientation improves (Figure S8) after exposure to hydrogen.
IV.2 Optical measurements
The white-light optical transmission of the Pd-capped samples were measured using hydrogenography Gremaud et al. 2007 with a Sony DXC-390P three charge-coupled device (3CCD) color video camera and a maximum acquisition frequency of 0.5 Hz. The transmission is averaged over an area of 80 mm2. Five Philips MR16 MASTER LEDs (10/50 W) with a color temperature of 4,000 K are used as a light source (Figure S9). The measurements on the samples capped with 10 nm Pd0.6Au0.35Cu0.05 and 30 nm PTFE were performed using a similar set-up in which the 3CCD camera was replaced by an Imaging Source 1/2.5” Aptina CMOS 2592 1944 pixel monochrome camera with an Edmunds Optics 55-906 lens, i.e. the same camera as used in ref. Bannenberg et al. 2016, to achieve higher acquisition frequencies of up to 20 Hz. The transmission is averaged over an area of 180 180 pixels, corresponding to about 80 mm2. A reference sample is used to compensate for fluctuations of the LED white light source. The partial hydrogen pressures of 10-1 10+6 Pa are obtained by using 0.1%, 4% and 100% H2 in Ar gas mixtures. Typical gas flows are 20 s.c.c.m. for increasing pressure steps and 100 s.c.c.m. for decreasing pressure steps. The wavelength dependent optical transmission was measured using an Ocean Optics HL-2000-FHSA halogen light source and an Ocean Optics Maya 2000 Pro spectrometer with an acquisition frequency of 2.5 Hz.
IV.3 Structural measurements
Ex-situ X-ray Reflectometry (XRR) and X-ray diffraction (XRD) measurements were performed with a Bruker D8 Discover (Cu-K = 0.1542 nm). The XRR measurements were fitted with GenX3 Björck and Andersson 2007 to obtain estimates for the layer thickness, roughness and density of the thin films. In-situ XRD measurements were performed with a Bruker D8 Advance (Co-K = 0.1789 nm) in combination with an Anton Paar XRK 900 reactor chamber. During these experiments, a mixture of 4% H2 in helium was used as a gas and a constant flow of at least 10 s.c.c.m. was maintained at all times.
Acknowledgments
We thank Christiaan Boelsma for creating the TOC image and for fruitful discussions.
References
- Brandon and Kurban (2017) N. P. Brandon and Z. Kurban, Philosophical Transactions of the Royal Society A: Mathematical, Physical and Engineering Sciences 375, 20160400 (2017).
- nat (2020) Nature Materials 17 (2020), 10.1038/s41563-018-0129-y.
- Abe et al. (2019) J. O. Abe, A. P. I. Popoola, E. Ajenifuja, and O. M. Popoola, International Journal of Hydrogen Energy 44, 15072 (2019).
- Glenk and Reichelstein (2019) G. Glenk and S. Reichelstein, Nature Energy 4, 216 (2019).
- Bannenberg et al. (2020a) L. J. Bannenberg, M. Heere, H. Benzidi, J. Montero, E. M. Dematteis, S. Suwarno, T. Jaroń, M. Winny, P. A. Orłowski, W. Wegner, et al., International Journal of Hydrogen Energy , 33687 (2020a).
- El Kharbachi et al. (2020) A. El Kharbachi, E. M. Dematteis, K. Shinzato, S. C. Stevenson, L. J. Bannenberg, M. Heere, C. Zlotea, P. A. Szilágyi, J.-P. Bonnet, W. Grochala, et al., Journal of Physical Chemistry C 124, 7599 (2020).
- Bakenne et al. (2016) A. Bakenne, W. Nuttall, and N. Kazantzis, International Journal of Hydrogen Energy 41, 7744 (2016).
- Bannenberg et al. (2020b) L. J. Bannenberg, C. Boelsma, K. Asano, H. Schreuders, and B. Dam, Journal of the Physical Society of Japan 89, 051003 (2020b).
- Darmadi et al. (2020) I. Darmadi, F. A. A. Nugroho, and C. Langhammer, ACS Sensors 5, 3306 (2020).
- Sterl et al. (2020) F. Sterl, N. Strohfeldt, S. Both, E. Herkert, T. Weiss, and H. Giessen, ACS Sensors 5, 917 (2020).
- Koo et al. (2020) W.-T. Koo, H.-J. Cho, D.-H. Kim, Y. H. Kim, H. Shin, R. M. Penner, and I.-D. Kim, ACS Nano 14, 14284 (2020).
- Chen et al. (2021) K. Chen, D. Yuan, and Y. Zhao, Optics & Laser Technology 137, 106808 (2021).
- Hughes et al. (1991) R. C. Hughes, A. J. Ricco, M. A. Butler, and S. J. Martin, Science 254, 74 (1991).
- Butler (1991) M. A. Butler, Journal of the Electrochemical Society 138, L46 (1991).
- Hübert et al. (2011) T. Hübert, L. Boon-Brett, G. Black, and U. Banach, Sensors and Actuators B: Chemical 157, 329 (2011).
- Perrotton et al. (2011) C. Perrotton, N. Javahiraly, A. Kazemi, and P. Meyrueis, in Proc. SPIE, Vol. 8026 (2011) pp. 80260O–1.
- Slaman et al. (2012) M. Slaman, R. Westerwaal, H. Schreuders, and B. Dam, in Proc. SPIE Photonic Appl. Aerosp., Transp., Harsh Environ. III, Vol. 8368 (2012) p. 836805.
- Javahiraly and Perrotton (2014) N. Javahiraly and C. Perrotton, in Proc. SPIE, Vol. 9202 (2014) pp. 920206–1.
- Silva et al. (2012) S. F. Silva, L. Coelho, O. Frazão, J. L. Santos, and F. X. Malcata, IEEE Sensors Journal 12, 93 (2012).
- Perrotton et al. (2013) C. Perrotton, R. J. Westerwaal, N. Javahiraly, M. Slaman, H. Schreuders, B. Dam, and P. Meyrueis, Optics express 21, 382 (2013).
- Wadell et al. (2014) C. Wadell, S. Syrenova, and C. Langhammer, ACS Nano 8, 11925 (2014).
- Zhao et al. (2006) Z. Zhao, M. A. Carpenter, H. Xia, and D. Welch, Sensors and Actuators B: Chemical 113, 532 (2006).
- Westerwaal et al. (2013) R. J. Westerwaal, J. S. A. Rooijmans, L. Leclercq, D. G. Gheorghe, T. Radeva, L. Mooij, T. Mak, L. Polak, M. Slaman, B. Dam, et al., International Journal of Hydrogen Energy 38, 4201 (2013).
- Wadell et al. (2015) C. Wadell, F. A. A. Nugroho, E. Lidstr om, B. Iandolo, J. B. Wagner, and C. Langhammer, Nano Letters 15, 3563 (2015).
- Nugroho et al. (2018) F. A. A. Nugroho, I. Darmadi, V. P. Zhdanov, and C. Langhammer, ACS Nano 12, 9903 (2018).
- Nugroho et al. (2019) F. A. A. Nugroho, I. Darmadi, L. Cusinato, A. Susarrey-Arce, H. Schreuders, L. J. Bannenberg, A. Bastos da Silva Fanta, S. Kadkhodazadeh, J. B. Wagner, T. J. Antosiewicz, A. Hellman, V. P. Zhdanov, B. Dam, and C. Langhammer, Nature Materials 18, 489 (2019).
- Bannenberg et al. (2019a) L. J. Bannenberg, F. A. A. Nugroho, H. Schreuders, B. Norder, T. T. Trinh, N.-J. Steinke, A. A. Van Well, C. Langhammer, and B. Dam, ACS Applied Materials & Interfaces 11, 15489 (2019a).
- Palm et al. (2019) K. J. Palm, J. B. Murray, J. P. McClure, M. S. Leite, and J. N. Munday, ACS Applied Materials & Interfaces 11, 45057 (2019).
- Dai et al. (2012) J. Dai, M. Yang, X. Yu, K. Cao, and J. Liao, Sensors and Actuators B: Chemical 174, 253 (2012).
- Dai et al. (2014) J. Dai, M. Yang, Z. Yang, Z. Li, Y. Wang, G. Wang, Y. Zhang, and Z. Zhuang, Sensors and Actuators B: Chemical 196, 604 (2014).
- Wang and Feng (2007) M. Wang and Y. Feng, Sensors and Actuators B: Chemical 123, 101 (2007).
- Darmadi et al. (2019) I. Darmadi, F. A. A. Nugroho, S. Kadkhodazadeh, J. B. Wagner, and C. Langhammer, ACS Sensors 4, 1424 (2019).
- Slaman et al. (2007) M. Slaman, B. Dam, M. Pasturel, D. M. Borsa, H. Schreuders, J. Rector, and R. Griessen, Sensors and Actuators B: Chemical 123, 538 (2007).
- Boelsma et al. (2017) C. Boelsma, L. J. Bannenberg, M. J. van Setten, N.-J. Steinke, A. A. Van Well, and B. Dam, Nature Communications 8, 15718 (2017).
- Bannenberg et al. (2019b) L. J. Bannenberg, C. Boelsma, H. Schreuders, S. Francke, N.-J. Steinke, A. A. Van Well, and B. Dam, Sensors and Actuators B 283, 538 (2019b).
- Fukai (2006) Y. Fukai, The metal-hydrogen system: basic bulk properties, Vol. 21 (Springer Science & Business Media, 2006).
- U.S. Department of Energy and Renewable Energy (EERE) E. E. U.S. Department of Energy and F. C. T. O. Renewable Energy (EERE), Section 3.7 Hydrogen Safety, Codes and Standards (2015).
- Sakamoto et al. (1991) Y. Sakamoto, N. Ishimaru, and Y. Mukai, Berichte der Bunsengesellschaft für physikalische Chemie 95, 680 (1991).
- Ngene et al. (2014) P. Ngene, R. J. Westerwaal, S. Sachdeva, W. Haije, L. C. de Smet, and B. Dam, Angewandte Chemie International Edition 53, 12081 (2014).
- Bannenberg and Schreuders (2020) L. J. Bannenberg and H. Schreuders, in preparation (2020).
- Darby Jr et al. (1963) J. B. Darby Jr, J. W. Downey, and L. J. Morton, Transactions of the Metallurgical Society of AIME 227 (1963).
- Waterstrat et al. (1978) R. Waterstrat, B. Giessen, R. Koch, and R. Manuszewski, Metallurgical Transactions A 9, 643 (1978).
- Pryde and Tsong (1971) J. A. Pryde and I. S. T. Tsong, Acta Metallurgica 19, 1333 (1971).
- San-Martin and Manchester (1991) A. San-Martin and F. D. Manchester, Journal of phase equilibria 12, 332 (1991).
- Schober (1996) T. Schober, in Solid State Phenomena, Vol. 49 (Trans Tech Publ, 1996) pp. 357–422.
- Pundt and Kirchheim (2006) A. Pundt and R. Kirchheim, Annual Review of Materials Research 36, 555 (2006).
- Pivak et al. (2009) Y. Pivak, R. Gremaud, K. Gross, M. Gonzalez-Silveira, A. Walton, D. Book, H. Schreuders, B. Dam, and R. Griessen, Scripta Materialia 60, 348 (2009).
- Wagner and Pundt (2008) S. Wagner and A. Pundt, Applied Physics Letters 92, 051914 (2008).
- Wagner and Pundt (2016) S. Wagner and A. Pundt, International Journal of Hydrogen Energy 41, 2727 (2016).
- Burlaka et al. (2016) V. Burlaka, S. Wagner, M. Hamm, and A. Pundt, Nano letters 16, 6207 (2016).
- Mooij and Dam (2013) L. Mooij and B. Dam, Physical Chemistry Chemical Physics 15, 2782 (2013).
- Bannenberg et al. (2016) L. J. Bannenberg, H. Schreuders, L. van Eijck, J. R. Heringa, N.-J. Steinke, R. Dalgliesh, B. Dam, F. M. Mulder, and A. A. van Well, The Journal of Physical Chemistry C 120, 10185 (2016).
- Baldi et al. (2018) A. Baldi, L. Mooij, V. Palmisano, H. Schreuders, G. Krishnan, B. J. Kooi, B. Dam, and R. Griessen, Physical Review Letters 121, 255503 (2018).
- Wagner et al. (2019) S. Wagner, P. Klose, V. Burlaka, K. Nörthemann, M. Hamm, and A. Pundt, ChemPhysChem 20, 1890 (2019).
- Feenstra et al. (1983) R. Feenstra, G. J. de Bruin-Hordijk, H. L. M. Bakker, R. Griessen, and D. G. de Groot, Journal of Physics F: Metal Physics 13, L13 (1983).
- Bloch et al. (2010) J. Bloch, B. Pejova, J. Jacob, and B. Hjörvarsson, Physical Review B 82, 245428 (2010).
- Baldi et al. (2014) A. Baldi, T. C. Narayan, A. L. Koh, and J. A. Dionne, Nature Materials 13, 1143 (2014).
- Syrenova et al. (2015) S. Syrenova, C. Wadell, F. A. Nugroho, T. A. Gschneidtner, Y. A. D. Fernandez, G. Nalin, D. Świtlik, F. Westerlund, T. J. Antosiewicz, V. P. Zhdanov, et al., Nature Materials 14, 1236 (2015).
- Griessen et al. (2016) R. Griessen, N. Strohfeldt, and H. Giessen, Nature Materials 15, 311 (2016).
- Gremaud et al. (2007) R. Gremaud, C. P. Broedersz, D. M. Borsa, A. Borgschulte, P. Mauron, H. Schreuders, J. H. Rector, B. Dam, and R. Griessen, Advanced Materials 19, 2813 (2007).
- Björck and Andersson (2007) M. Björck and G. Andersson, Journal of Applied Crystallography 40, 1174 (2007).
V Supplementary Figures