The Parallax of Centauri Measured from Gaia EDR3 and a Direct, Geometric Calibration of the Tip of the Red Giant Branch and the Hubble Constant
Abstract
We use data from the ESA Gaia mission Early Data Release 3 (EDR3) to measure the trigonometric parallax of Cen, the first high precision parallax measurement for the most massive globular cluster in the Milky Way. We use a combination of positional and high quality proper motion data from EDR3 to identify over 100,000 cluster members, of which 67,000 are in the magnitude and color range where EDR3 parallaxes are best calibrated. We find the estimated parallax to be robust, demonstrating good control of systematics within the color-magnitude diagram of the cluster. We find a parallax for the cluster of (statistical) (systematic) mas (2.2% total uncertainty) corresponding to a distance of kpc. The parallax of Cen provides a unique opportunity to directly and geometrically calibrate the luminosity of the Tip of the Red Giant Branch (TRGB) because it is the only cluster with sufficient mass to provide enough red giant stars, more than 100 one magnitude below the tip, for a precise, model-free measurement of the tip. Combined with the pre-existing and most widely-used measurements of the tip and foreground Milky Way extinction, we find mag for the -band luminosity of the blue edge. Using the TRGB luminosity calibrated from the Gaia EDR3 parallax of Cen to calibrate the luminosity of SNIa results in a value for the Hubble constant of km s-1 Mpc-1. We make the data for the stars in Cen available electronically and encourage independent analyses of the results presented here.
I Introduction
The recent Early Data Release 3 (Gaia Collaboration et al. 2020; Lindegren et al. 2020b; Riello et al. 2020, EDR3;) from the Gaia mission (Gaia Collaboration et al. 2016) opens a new chapter in the measurement of parallaxes, placing the precise and accurate determination of the distances to nearby Galactic globular clusters within reach. None may be more prized than that of Cen, the most massive cluster in the Galaxy at a distance of 5 kpc; a precise determination of its distance will characterize the luminosity of a broad sample of stellar types. A precise distance to Cen will also provide a geometric calibration of the Tip of the Red Giant Branch (TRGB) feature, which in a cluster of this mass can be measured directly (Bellazzini et al. 2001) without the need for extrapolations or comparisons with other stellar features (Capozzi & Raffelt 2020). The calibration of the TRGB is especially timely because it is a powerful primary distance indicator for evolved stellar populations that can be used to reach the hosts of Type Ia Supernovae (SNe Ia) and help determine the Hubble constant (Freedman et al. 2019; Yuan et al. 2019; Jang & Lee 2015; Jang & Lee 2017; Jang et al. 2021); for a review, see Beaton & Carnegie-Chicago Hubble Program Team 2018.
The Tip of the Red Giant Branch is the point of maximum brightness for Red Giant Branch (RGB) stars caused by the sudden start of helium fusion in low mass stars, a phenomenon known as the Helium Flash. After the flash, stars quickly expand and dim, which results in a visible decline in population in the color-magnitude diagram (CMD) at magnitudes brighter than the TRGB. The TRGB is an especially interesting feature of the CMD because of its usefulness as a distance estimator; the brightest red giants are bright enough to be seen in an interesting number of hosts to Type Ia SN, and the absolute magnitude of the TRGB in the band, , has only a modest dependence on metallicity and age of the underlying stellar population (Lee et al. 1993). Thus a calibration of yields the distance to other systems with an observed TRGB feature. This has been done in the hosts of a number of type Ia supernovae to build a long-range distance ladder and to measure the Hubble constant (Jang & Lee 2017; Freedman et al. 2019).
Because the TRGB is not the identity of any individual star, but rather a feature (i.e., end point) of a distribution of stars, its luminosity has not been as easy to determine from trigonometric parallaxes as it is for individual stars that serve as standard candles such as Cepheid variables (Benedict et al. 2007; Riess et al. 2018) or RR Lyrae (Benedict et al. 2011). Rather, to calibrate the TRGB luminosity it has been necessary to determine the distance to an ensemble of stars at a common distance (although Mould et al. 2019 show how a TRGB value could in principle be obtained from a sample of red giants at different distances using Gaia parallaxes); the resulting uncertainty includes that of the group’s distance determination. This approach has been utilized for the TRGB in the Large Magellanic Cloud (LMC) (Freedman et al. 2020); however, while the LMC distance is accurately known (Pietrzyński et al. 2019), the extinction internal to the LMC is substantial and subject to some disagreement in the literature (Freedman et al. 2020; Nataf et al. 2020; Yuan et al. 2019; Jang & Lee 2017; Skowron et al. 2020; Górski et al. 2020). As a consequence, the TRGB calibration in the LMC ranges from to mag, corresponding to a 5% range in the inferred value of . The halo of NGC 4258 provides another valuable target for TRGB calibration (Macri et al. 2006; Reid et al. 2019; Jang & Lee 2017; Jang et al. 2021; Mager et al. 2008; Anand et al. 2020), yielding values between the middle and bright end of the range. A calibration of the TRGB in globular clusters of the Milky Way with Gaia EDR3 offers some unique advantages to other TRGB hosts. These include the direct use of trigonometric parallaxes (the “Gold standard” of geometric distance measurements), well-calibrated extinction estimates between us and the halo where Clusters reside (Schlafly & Finkbeiner 2011), negligible internal extinction in the system, and high photometric signal-to-noise for stars in the tip which, for a massive cluster, leaves little doubt about the location of the tip.
However, calibrating the TRGB luminosity with Galactic globular clusters is subject to two challenges: mass and distance. Bright red giants are relatively rare, and few clusters contain enough stars to fully populate the TRGB; Madore & Freedman 1995 suggest that a robust measurement requires at least 100 stars present within 1 mag of the TRGB brightness. The accuracy of parallax-based distances declines with increasing distance; an error of corresponds to 1% in distance at 5 kpc, but 2% at 10 kpc. Cen therefore provides the best opportunity in the Milky Way because it is relatively nearby, at a distance of about 5 kpc, and is the most massive Galactic cluster in Baumgardt & Hilker 2018, with an estimated mass of . Indeed, Bellazzini et al. 2001 find 185 RGB stars within one magnitude of their derived TRGB magnitude, nearly a factor of 2 better than the Madore & Freedman 1995 recommendation. Only three other clusters in the compilation by Baumgardt & Hilker 2018 exceed , namely NGC 6388 (), NGC 6441 (), and NGC 6715 (); all three, however, are estimated to be further than 10 kpc, and therefore their parallax calibration will be significantly more difficult. Other potentially interesting clusters, such as M3, M13, and NGC 2808, have masses in the range and estimated distances between 6 and 10 kpc.
Several distance estimates have been published for Cen over the years using a wide range of methods which are discussed in detail in section 5. In this work we examine the stars in Cen with astrometric and photometric information in the newly available Gaia EDR3 catalog, and find a precise direct parallax measurement for Cen yielding an accurate geometric calibration of its TRGB, taking into account known and possible systematic parallax errors and use this to calibrate the luminosity of the TRGB and the Hubble constant.
The paper is organized as follows. Section 2 covers our data selection procedure, including our initial cluster membership criteria and quality cuts. Section 3 covers our secondary cluster membership selections and our distance measurement. In section 4 we report our TRGB calibration. Finally, in section 5 we discuss our results and their significance.
II Data Selection
The globular cluster Cen is extremely rich, reaches a very high density of stars in the center, and extends to a nominal tidal radius of about (Poveda & Allen 1975; Harris 1996), although tidal tails have been found out to well over 1 degree (Marconi et al. 2014; Calamida et al. 2017), and Fernández-Trincado et al. 2015 have traced stars presumably stripped from Cen over a large fraction of the sky. However, already at radii , foreground/background Galactic stars have density comparable to cluster members (Calamida et al. 2017), and obtaining a clean sample of cluster stars requires additional selections.
We used a radius of from the nominal cluster center (, ; Eadie & Harris 2016; Eadie & Harris 2016) for our initial extraction. We selected stars from the Gaia archive using the following search:
| SELECT TOP 2000000 * | |||
| FROM gaiaedr3.gaia_source | |||
| WHERE CONTAINS(POINT(’ICRS’,gaiaedr3.gaia_source.ra, | |||
| gaiaedr3.gaia_source.dec), | |||
| CIRCLE(’ICRS’, | |||
| COORD1(EPOCH_PROP_POS(201.697,-47.479472,0,-3.2400, | |||
| -6.7300,234.2800,2000,2016.0)), | |||
| COORD2(EPOCH_PROP_POS(201.697,-47.479472,0,-3.2400, | |||
| -6.7300,234.2800,2000,2016.0)), | |||
| 0.75) | |||
| )=1 |
We also applied a series of quality cuts on the data, using histograms of the distributions of the parameters to make our selections. We choose data with:
| astrometric_excess_noise_sig | , |
| astrometric_excess_noise | , |
| soltype | , |
| phot_bp_rp_excess_factor | , |
| phot_proc_mode | , and |
| astrometric_gof_al | . |
After these quality cuts, our starting sample includes 178,548 stars.
The central region of Cen is relatively crowded, challenging the quality of Gaia measurements in this region. Figure 1 shows that after our EDR3 quality cuts, the central radius of the cluster is essentially unpopulated. From the perspective of a parallax estimate for the cluster, this is not a significant issue; cluster depth effects, discussed in Section III.1, are small, and have a modest dependence on angular distance from the center.


The two-dimensional distribution of proper motions in right ascension and declination, and , is shown in Figure 2. The proper motions for the selected sources fall into two separate components; the narrower component centered around () is due to cluster stars, while the much broader component roughly centered at () is due to field stars. (Proper motions for field stars extend well beyond the range of the Figure.) The median proper motion for stars in the region (, mas/yr), shown by the red box in the Figure, is () = (-3.25, -6.76) mas/yr. We adopt this as the nominal EDR3 proper motion for Cen, very close to the value mas/yr reported by Baumgardt et al. 2019 for Gaia DR2. The uncertainty in the cluster proper motion is difficult to estimate, given the possibility of magnitude- and color-dependent offsets in proper motion (which correlates with parallax), and other correlated error terms. We find that the proper motion varies by 0.03 mas/yr (rms) across magnitude bins, and adopt this value as a conservative estimate of relative systematic uncertainty. This uncertainty does not include the possibility of global offsets in the EDR3 proper motion for the cluster as a whole. The proper motion width of the globular cluster component is likely due to a combination of internal motions and proper motion errors. Internal motions are expected to contribute mas/yr per component at the center (assuming the parameters from Baumgardt & Hilker 2018); Bellini et al. 2018 measure an internal dispersion of mas/yr just outside from the cluster center. Proper motion measurement errors have a median catalog value of 0.5–0.6 mas/yr (1D) for stars around .
II.1 Cluster Star Selection: Position and Proper Motion

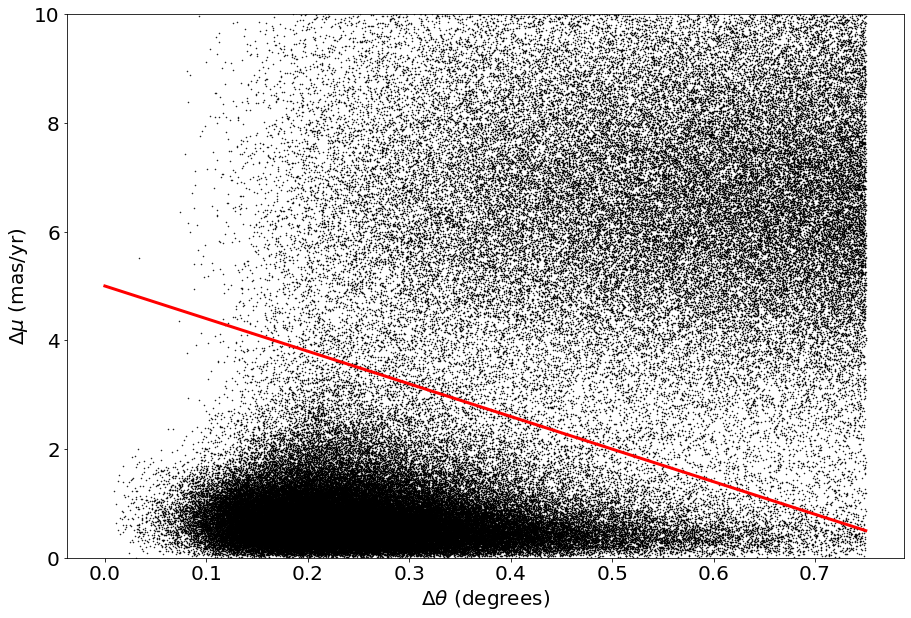
We adopt a cluster membership criterion based on the combination of position and proper motion. Figure 3 shows the distribution of the angular distance of each star from the nominal cluster center, and the proper motion difference of each star from the cluster’s motion determined above. Stars obeying the relation:
| (1) |
i.e., below the red line in the Figure, are presumed to be cluster members. Further refinements in membership on the basis of color and magnitude are discussed in the next Section. After quality cuts and the joint angular separation /proper motion selection, the sample contains 108054 stars.
II.2 Cluster Star Selection: Magnitude and Color-magnitude Diagram
Figure 4 shows the distribution of stars in Gaia magnitude and color before (top) and after (bottom) the membership selection. After the selection, the typical features of a globular cluster in color-magnitude space, namely main sequence, red giant branch, and horizontal branch emerge clearly, indicating that the vast majority of the remaining stars represent a well-defined, single-distance group.

Pre-Membership Selection

Post-Membership Selection
However, we can see in the plot a small number of apparent outliers in magnitude and color distribution. These stars could be foreground or background stars, or stars with anomalous properties or EDR3 measurements. Our goal is to determine a robust parallax for the system; given the large number of stars at our disposal, it is preferable to adopt a conservative approach and exclude potential contaminants, even at the cost of excluding a small number of true cluster stars.
Therefore, we further restrict cluster membership using the color-magnitude diagram. First we divide the color-magnitude diagram into 4 regions, as shown in Figure 5. Stars brighter than or fainter than are excluded, reducing the sample to 67347 objects. We then bin these regions by magnitude; for each of these bins we determine a Gaussian kernel in color, and set a threshold kernel value. Stars below the threshold value, shown in black in the Figure, are considered outliers and excluded from cluster membership. This excludes an additional 880 stars, leaving a total of 66467 objects. We could still expect a small fraction of contaminants, which are more easily addressed in the next section when we make use of parallax information.
III Distance Estimate
In EDR3, the characterization of the parallax offset has been greatly improved over that in DR2; Lindegren et al. 2020a provide an estimate of the parallax offset as a function of color, magnitude, and position on the sky, based on a combination of quasars, LMC stars, and physical pairs. Indeed, the examination of the parallax of Cen stars across the CMD, spanning roughly 7 astronomical magnitudes and 1.5 magnitudes of color, provides a strong test of possible systematic uncertainties of the EDR3 parallaxes. Importantly, the EDR3 LMC star and quasar data provide the strongest constraints on the EDR3 parallax offset available and also fully cover the range of magnitudes, and , for the stars we analyze in Cen. (In contrast, the Cepheid stars analyzed in EDR3 by Riess et al. 2020 are in a brighter range, , which have no overlap with LMC stars or quasars necessitating additional analysis of the magnitude-dependence of the offset in this range.) All parallax values used in the remainder of this work are corrected according to the prescriptions of L20.

A naive computation of the weighted mean parallax for the 66467 stars in the remaining member sample, based on catalog parallax errors, would lead to a nominal error of . Because the systematic uncertainties in Gaia parallaxes are expected to depend on a star’s magnitude and color, it is more appropriate to determine the cluster parallax for each region in the CMD, and also in fixed bins of magnitude and in fixed bins of color, so we can identify and characterize systematic uncertainties while simultaneously removing any remaining contaminants and outliers. The histograms of parallax values in each of these groupings are shown in Figures 6, 7, and 8, grouped in terms of CMD regions, magnitude, and color, respectively; we choose a bin width of 1.0 mag in and a color width of 0.25 mag in . At the bright end, each magnitude bin will contain a small number of stars with relatively high precision parallaxes, while at the faint end each bin will contain many more stars with individually less accurate parallaxes. Within each bin, we determine the inverse-variance weighted mean parallax, and then apply an iterative 3 rejection algorithm which includes the nominal parallax error so that rejection occurs for stars with individual values of . The parallaxes of each bin and their uncertainties are given in Table 1; for magnitude and color, they are also plotted, with their total uncertainties, in Figures 7 and 8. As expected, the statistical uncertainty in each bin’s parallax is fairly constant, as the change in the number of stars is balanced by the change in individual parallax precision. These uncertainties range from 1 to 2 as.
We provide the list of all the stars we analyzed (pre-CMD cut), 67347 in total, and their EDR3 parameters to simplify the replication of our results, in the electronic form of this paper, at https://github.com/johnsoltis/Omega-Centauri-eDR3, and upon request to the authors.

Perhaps our most important finding is that the parallaxes at this precision level do not trend with either color or magnitude, validating the quality of the relative characterization of the EDR3 parallax offset by L20 (at least at this location on the sky). For comparison, we note L20 averaged the corrected EDR3 parallaxes over the full LMC and found the mean parallax thus derived agrees, within 1 as, with the detached eclipsing binary distance by Pietrzyński et al. 2019, which itself has an accuracy of 0.25 as, a meaningful validation of the ability to average EDR3 parallaxes over a small region. Therefore we expect that, adopting the L20 correction, EDR3 parallaxes are good to as in absolute terms.
Nevertheless, we may conservatively expect some residual systematic uncertainty in the characterization of the parallax offset which depends on magnitude and color and L20 discusses this as having an expected uncertainty of ”a few” as in the magnitude and color range where it is well-characterized. We therefore adopt an uncertainty floor of 4 as in each of our magnitude and color bins, which we add in quadrature to the formal variance from the weighted average. This assumption is likely on the conservative side, as the scatter from bin to bin shown in Figures 7 and 8 is somewhat smaller than the resulting uncertainty. The error bars plotted in Figures 7 and 8 include this systematic uncertainty.
Our statistical determination of the parallax of Cen is obtained by combining the nearly uniformly weighted values for each bin in either color or magnitude, and yields and mas, in good agreement with each other. We adopt a value of mas, corresponding to a distance modulus of mag.
One final consideration is required concerning possible residual systematics. Our sample of stars in Cen covers a region approximately across, a narrow region by Gaia standards, and parallax systematics are known to have some degree of angular covariance. The analysis of the LMC in L20 is especially relevant for our purposes, since LMC stars, unlike quasars, occupy a similar range in magnitude and color as Cen; LMC stars are also sufficiently dense on the sky to permit a high quality analysis on smaller separations at constant parallax than is feasible with quasars. Indeed, their Figure 14 shows a “checkered” pattern of residual zonal variations, with an amplitude of a few as, and a correlation scale of . Over the full LMC, several degrees across, these zonal residuals average down; however, our sample only covers roughly one correlation length, therefore systematics of a magnitude similar to the amplitude seen in the LMC should be expected. From these LMC residuals in the L20 analysis we estimate the position-dependent systematic error for a patch the size of Cen to be 4 as.11 1 Our estimate was based on EDR3 LMC data for sub-degree scales and the 2 as agreement between the EDR3 LMC parallax and its external value as an estimate to reach larger scales. Zinn 2021 estimates angular covariance of 10 as2 between 0.3 degrees (size of Cen) and 10 degrees from asteroseismology of Red Giants and Maíz Apellániz et al. 2021 finds 40 as2 between 10 degrees and larger scales from Quasars which combined provide an alternative uncertainty estimate of 7 as. Maíz Apellániz et al. 2021 finds the same parallax for Cen that we find here.
Therefore our final estimate of the parallax of Cen is (statistical) (systematic) mas, or a final measurement of a distance modulus of mag.
| Bin Range | # Stars | (mas) | |||
|---|---|---|---|---|---|
| 11.5-12.5 | 156 | 0.929 | 0.1894 | 0.0017 | 0.0043 |
| 12.5-13.5 | 496 | 0.889 | 0.1857 | 0.0011 | 0.0041 |
| 13.5-14.5 | 882 | 0.947 | 0.1905 | 0.0009 | 0.0041 |
| 14.5-15.5 | 1878 | 0.951 | 0.1959 | 0.0009 | 0.0041 |
| 15.5-16.5 | 2142 | 0.943 | 0.1944 | 0.0013 | 0.0042 |
| 16.5-17.5 | 5322 | 0.951 | 0.1915 | 0.0013 | 0.0042 |
| 17.5-18.5 | 21690 | 0.967 | 0.1898 | 0.0011 | 0.0041 |
| 18.5-19.5 | 33901 | 0.979 | 0.1874 | 0.0016 | 0.0043 |
| Result | 0.1906 | 0.0011 | |||
| 0.0-0.25 | 432 | 0.961 | 0.1983 | 0.002 | 0.0045 |
| 0.25-0.5 | 550 | 0.944 | 0.1961 | 0.0018 | 0.0044 |
| 0.5-0.75 | 3370 | 0.973 | 0.1904 | 0.0031 | 0.0051 |
| 0.75-1.0 | 51405 | 0.974 | 0.1893 | 0.0008 | 0.0041 |
| 1.0-1.25 | 9767 | 0.951 | 0.1929 | 0.0006 | 0.004 |
| 1.25-1.5 | 943 | 0.915 | 0.1865 | 0.009 | 0.0041 |
| Result | 0.1921 | 0.0017 | |||
| MS | 59263 | 0.973 | 0.1889 | 0.0008 | 0.0041 |
| Mid RGB | 5375 | 0.942 | 0.1933 | 0.0007 | 0.0041 |
| HB | 852 | 0.95 | 0.1967 | 0.0013 | 0.0042 |
| RGB | 977 | 0.909 | 0.1874 | 0.0008 | 0.0041 |
| Regions Result | 0.1915 | 0.0018 |
III.1 Cluster Depth Effects
The analysis carried out in this paper assumes that all stars in Cen have the same parallax. In reality, the cluster has a small, but not insignificant extent along the line of sight; assuming rough spherical symmetry, an angular separation of corresponds to a longitudinal extent of 1.3%, or, for a parallax of 0.2 mas, about 0.003 mas. This extent is significantly smaller than the formal parallax error of all stars we consider, and will act as a (negligible) additional dispersion in the effective parallax of selected members. In the absence of extinction internal to the cluster, we expect that any incompleteness, primarily due to effects in projection on the sky, is essentially independent of position along the line-of-sight, and therefore averages down within each bin. On the other hand, kinematic estimates are potentially affected by incompleteness, as velocity distribution, anisotropy, and projection effects depend both on the distance to the cluster center and, potentially, on the star mass (via its apparent luminosity). Thus careful consideration of incompleteness effects will be required in the kinematic modeling of proper motion data from Gaia EDR3.
IV Calibrating the TRGB
The determination of the luminosity of the TRGB in the -band is given in the simplest form as:
| (2) |
where the distance modulus is obtained directly from the parallax, is the apparent brightness of the TRGB in the band, and is the line-of-sight extinction in the same band.
As discussed in Section I, Cen is ideal among Galactic globular clusters for the determination of . It is the only globular cluster known to have at least 100 stars—185, according to Bellazzini et al. 2001—within one magnitude of the tip, a criterion for a robust measurement identified by Madore & Freedman 1995. The cluster also has a low metallicity ([Fe/H]=-1.7 dex) and a relatively blue intrinsic color ( ), making it an ideal calibrator of the TRGB stars in extragalactic halos (Beaton et al. 2019; Jang & Lee 2017). The color is within 0.1 mag of the fiducial TRGB color used in the characterization of Rizzi et al. 2007, and blueward of the range suggested for the blue tip of Jang and Lee (2017).
The most widely used study of the tip of Cen is from Bellazzini et al. 2001, hereafter B01, from the wide-field catalogue of Pancino et al. 2000. B01 found:
| (3) |
The determination was made with standard techniques (Sakai et al. 1996), using an edge-detection or Sobel filter applied to a smoothed RGB luminosity function; the uncertainty was established through bootstrap resampling of the sample and is realistic for the number of stars and quality of the edge detection, and comports with simple error estimation of 0.03 mag based on a 0.2 mag width of a TRGB break and the existence of 10 stars within 0.1 mag of the break. The value of is the same found by subsequent studies (e.g., Bono et al. 2008).
The extinction along the line of sight to Cen is due to the Milky Way disk, and occurs completely well in front of the cluster. At a Galactic latitude of , most of the extinction takes place well within 1 kpc along the line of sight. Therefore the extinction to Cen may be taken as the full line of sight measured from the Galactic dust maps of Schlafly & Finkbeiner 2011 derived from the IRAS and COBE/DIRBE emission maps. The size of the cluster is sufficient to average over sub-structure in Milky Way extinction so that the maps yield a robust result. We estimate the uncertainty in the extinction using the prescription by Schlafly & Finkbeiner 2011, i.e., 5% of the extinction itself; see also the discussion in Brout et al. 2019. The reddening estimate from Schlafly & Finkbeiner 2011 =0.12 mag agrees within 0.5 with the 0.13 mag of reddening measured by Bono et al. 2019 for RR Lyrae stars in the cluster as well as the 0.11 mag measurement from Calamida et al. 2005 using hot horizontal branch stars, falling between these two values.
Therefore:
| (4) |
This results in mag. According to Freedman et al. 2019, the color transformation to the filter of the Hubble Space Telescope Advanced Cameras for Surveys subtracts 0.01 mag for TRGB stars, resulting in mag.
This value is within the range of values of TRGB calibraions of =-3.95 to -4.05 mag from the recent compilation of Capozzi & Raffelt 2020 and we discuss other calibrations further in the next section. The value measured here is fainter than the TRGB calibration used in recent determinations of the Hubble constant (Freedman et al. 2019) by 0.07 mag. This change would raise the value of from Freedman et al. 2019 by 3.2%, yielding a determination of the Hubble constant from the TRGB-SN Ia distance ladder calibrated by the parallax of Cen from Gaia EDR3 of 72.1 km s-1 Mpc -1.
V Discussion
V.1 Comparison with prior distance measurements for Cen
The distance we derived from the Gaia EDR3 parallaxes of stars in the cluster is the same as that recently found from a kinematic measurement using Gaia DR2 by Baumgardt et al. 2019. The recent determination of kpc by Baumgardt et al. 2019, in good agreement with the classical photometric distance of 5.2 kpc from Harris 1996, is based on a comparison of the line-of-sight velocity dispersion profile against the DR2 proper motion measurements (Gaia Collaboration et al. 2018b; Lindegren et al. 2018). They obtain the line-of-sight velocity dispersion profile using the maximum likelihood approach briefly described in Baumgardt & Hilker 2018, and a proper motion dispersion profile from Gaia DR2 measurements with sufficiently small formal errors; they also use line-of-sight velocities and proper motions to exclude likely non-members. They then match both line-of-sight and proper motion dispersion profiles to an array of N-body models, and thus determine the most likely distance to the cluster. The error quoted by Baumgardt et al. 2019 appears to be statistical only; a possible concern about systematics derives from the radially dependent selection effects, as the effective completeness limit for Gaia DR2 is a strong function of local density, and thus distance from the center. The depletion of stars with good quality measurements from Gaia near the geometric center of the cluster may have some impact on kinematic studies of the cluster based on proper motions, since intrinsic velocity dispersion, anisotropy, and projection effects will depend on distance, true or projected, from the cluster center, and the mass distribution of EDR3 stars that pass our quality cuts can vary with selection effects. An earlier kinematic distance estimate by Watkins et al. 2015, using HST-based proper motions, puts Cen at a distance of kpc. A distance estimate of kpc was obtained by Thompson et al. 2001 from the detached eclipsing binary OGLEGC 17 (Kaluzny et al. 1996).
A once challenging aspect of using Gaia parallaxes from the earlier DR2 release (Gaia Collaboration et al. 2018b) to directly measure the parallax of Cen was the systematic uncertainty related to the parallax offset found by Lindegren et al. 2018, and which has been demonstrated to vary with source color, magnitude and position(Riess et al. 2018; Arenou et al. 2018; Zinn et al. 2019, e.g.,). The DR2 offset was calibrated from quasars, which are bluer than the bulk of Cen stars and only cover a small fraction of their magnitude range. The DR2 parallax estimates for Cen by Gaia Collaboration et al. 2018a and by Shao & Li 2019 are and mas, respectively, and are substantially smaller than other determinations, presumably because the parallax offset estimated by Lindegren et al. 2018 on the basis of quasar data is much smaller than the values found for brighter stars (Riess et al. 2018; Arenou et al. 2018; Zinn et al. 2019). Our own analysis of the DR2 parallax data for stars in Cen revealed a large trend of parallax with star magnitude and color, leaving us to conclude that a parallax from DR2 was not reliable without further characterization of its parallax offset. Thanks to the great improvement realized in EDR3, such a measurement is now feasible, and we exclude the DR2 parallax-based estimates from further consideration.
Both ground-based and HST observations have shown that Cen has a complex structure, with many separate color-magnitude sequences (Bellini et al. 2009; Bellini et al. 2010; Bellini et al. 2017) that can have different structural (Calamida et al. 2017; Bellini et al. 2017; Bellini et al. 2018) and metallicity (Milone et al. 2017; Zennaro et al. 2019) properties, including an unusually broad range in helium abundance for a globular cluster. We would not expect this large range to influence the peak of the TRGB in the -band as the mean helium abundance in Cen is not much affected by the high and low sub populations, and the TRGB is known to be quite insensitive to star formation and chemical abundance in general (McQuinn et al. 2019). The complex kinematic structure of Cen does not affect its parallax measurement, but needs to be taken into account in kinematics-based distance measurements (Watkins et al. 2015; Baumgardt et al. 2019). It is also worth recognizing that the distribution of abundances in the halos of galaxies where TRGB is often measured is largely unknown making comparisons difficult; it is not unlikely that the multiple populations of Cen could more closely resemble the complexity of a galaxy’s stellar halo than a simpler, single-population system.
V.2 Comparison with the TRGB calibration anchored to 47 Tuc
The determination of the parallax to a globular cluster as massive as Cen represents a milestone of distance measurements and best means to directly calibrate the TRGB from a Globular cluster. A more circuitous route was employed by Freedman et al. 2020, who used photometric distance offsets measured between clusters by Da Costa & Armandroff 1990 on the basis of the giant branch CMD, to bring 11 clusters to a common system with 47 Tuc, and formed a composite TRGB in the near infrared, anchored to 47 Tuc. Each cluster is less massive than Cen, but together they provide enough stars to populate the TRGB. They then used a mean detached eclipsing binary (DEB) distance to 47 Tuc of mag (Thompson et al. 2020) to obtain an absolute TRGB calibration, of mag. While consistent with the result we find here, the precision enabled from the Gaia EDR3 parallaxes suggests a revision faintward. The Thompson et al. 2020 distance for 47 Tuc is 0.03 mag farther than the parallax measured by Chen et al. 2018 from Gaia DR2 by de-trending the previously discussed systematics in the parallax offset using nearby Small Magellanic Cloud (SMC) stars, and 0.05 mag farther than the value we find from EDR3 applying the same methods used here; with this distance, the composite Globular cluster analysis tied to 47 Tuc by Freedman et al. 2020 would be revised to .
V.3 Comparison with the LMC
The distance to the LMC is known to high accuracy, thanks to the 20 late-type detached eclipsing binaries studied by Pietrzyński et al. 2019. The LMC also has a well-populated TRGB, so that a very accurate empirical measurement of can be obtained (Górski et al. 2018). However, the determination of the extinction internal to the LMC itself is more challenging.
Skowron et al. 2020 have recently published detailed and extensive maps of the LMC extinction based on OGLE data. The new maps calibrate the intrinsic color of Red Clump (RC) stars out to 5–8 degrees from the center, where the dust internal to the LMC is negligible, and the foreground reddening can be removed using the maps of Schlafly & Finkbeiner 2011. Skowron et al. 2020 measure both the intrinsic RC color and its gradient (due to the metallicity gradient), a significant improvement over the maps of Haschke et al. 2011 which assumed a fixed RC color of uncertain origin. These maps can be used to correct the measurements of the TRGB across the LMC by Górski et al. 2018, resulting in an accurate extinction-corrected measurement of . The distance calibration of Pietrzyński et al. 2019 then yields an absolute calibration of mag. Zone-by-zone details are given in Table II; the extinction varies by location, as expected, with a typical value mag. This calibration is in excellent agreement with the value we find here from Cen, but is mag fainter than the value from Freedman et al. 2019. Some of the differences in the latter paper include a larger extinction , derived by F20 on the basis of TRGB colors, and a brighter value of vs. the value obtained by Górski et al. 2020. These two terms account for a difference by 0.09 mag. Unfortunately we are unable to carry out a field-by-field comparison, as Freedman et al. 2019 do not indicate which fields in the LMC were used in their analysis. While the determination of the LMC extinction is challenging, it would be surprising if the extinction of stars near the TRGB was greater than those of RC star sight-lines, as TRGB stars should be older and further diluted; it is especially puzzling to note a difference as large as 0.04 mag for the apparent magnitude of the tip, since both groups use the same OGLE-III data, and the precision of the tip measurement has been claimed to be better than 0.01 mag in the analysis by Freedman et al. 2019. This discrepancy warrants more detailed comparisons.
V.4 Implications of the Cen measurement
With new data from Gaia EDR3, the new extinction maps of the LMC (and SMC) from the OGLE Team, and new data from HST we may look forward to renewed efforts to calibrate and refine the luminosity of the TRGB. The calibration of TRGB derived from the Gaia EDR3 parallax of Cen indicates a value of the Hubble constant of 72.1 km s-1 Mpc -1, in good agreement with other local measures, including those from Cepheids (Freedman et al. 2012; Riess et al. 2020; Huang et al. 2020), although significantly larger than the value predicted by Planck CMB data used to calibrate CDM (see Verde et al. 2019 for a Review). We may hope that additional work may shed new light on the oft-called “Hubble Tension” and lead to an explanation of its origin.


| G18 Field | RA | DEC | (Skowron) | ||
| LMC100 | 5:19:02.2 | -69:15:07 | 14.5810 | 0.0754071 | -3.97141 |
| LMC102 | 5:19:05.7 | -68:03:46 | 14.6610 | 0.118864 | -3.93486 |
| LMC103 | 5:19:02.9 | -69:50:26 | 14.6150 | 0.108667 | -3.97067 |
| LMC111 | 5:12:36.0 | -69:14:50 | 14.7140 | 0.141353 | -3.90435 |
| LMC112 | 5:12:21.5 | -69:50:21 | 14.6020 | 0.108817 | -3.98382 |
| LMC116 | 5:07:03.6 | -67:28:25 | 14.6820 | 0.102840 | -3.89784 |
| LMC120 | 5:05:39.8 | -69:50:28 | 14.6430 | 0.159487 | -3.99349 |
| LMC126 | 5:00:02.4 | -68:39:31 | 14.6200 | 0.111521 | -3.96852 |
| LMC127 | 4:59:33.6 | -69:14:54 | 14.6380 | 0.143930 | -3.98293 |
| LMC161 | 5:25:32.5 | -69:14:59 | 14.6240 | 0.112264 | -3.96526 |
| LMC162 | 5:25:43.3 | -69:50:24 | 14.5790 | 0.141297 | -4.03930 |
| LMC163 | 5:25:52.2 | -70:25:50 | 14.6480 | 0.110970 | -3.93997 |
| LMC169 | 5:32:22.8 | -69:50:26 | 14.6910 | 0.133787 | -3.91979 |
| LMC170 | 5:32:48.1 | -70:25:53 | 14.6000 | 0.102659 | -3.97966 |
| Mean | 14.635 | 0.119 | -3.961 | ||
| (SD=0.04 mag) |
VI Acknowledgments
We thank David Nataf and Dorota Skowron for contributions toward understanding expectations of the LMC extinction. We are grateful to the entire Gaia collaboration for providing data and assistance which made this project possible. We congratulate them on their tremendous achievement to date.
References
- Anand et al. (2020) Anand, G. S., Lee, J. C., Van Dyk, S. D., et al. 2020, arXiv e-prints, arXiv:2012.00757
- Arenou et al. (2018) Arenou, F., Luri, X., Babusiaux, C., et al. 2018, A&A, 616, A17
- Baumgardt & Hilker (2018) Baumgardt, H., & Hilker, M. 2018, MNRAS, 478, 1520
- Baumgardt et al. (2019) Baumgardt, H., Hilker, M., Sollima, A., & Bellini, A. 2019, MNRAS, 482, 5138
- Beaton & Carnegie-Chicago Hubble Program Team (2018) Beaton, R. L., & Carnegie-Chicago Hubble Program Team. 2018, in American Astronomical Society Meeting Abstracts, Vol. 231, American Astronomical Society Meeting Abstracts #231, 351.05
- Beaton et al. (2019) Beaton, R. L., Seibert, M., Hatt, D., et al. 2019, ApJ, 885, 141
- Bellazzini et al. (2001) Bellazzini, M., Ferraro, F. R., & Pancino, E. 2001, The Astrophysical Journal, 556, 635–640
- Bellini et al. (2010) Bellini, A., Bedin, L. R., Piotto, G., et al. 2010, AJ, 140, 631
- Bellini et al. (2017) Bellini, A., Milone, A. P., Anderson, J., et al. 2017, ApJ, 844, 164
- Bellini et al. (2009) Bellini, A., Piotto, G., Bedin, L. R., et al. 2009, A&A, 507, 1393
- Bellini et al. (2018) Bellini, A., Libralato, M., Bedin, L. R., et al. 2018, ApJ, 853, 86
- Benedict et al. (2007) Benedict, G. F., McArthur, B. E., Feast, M. W., et al. 2007, AJ, 133, 1810
- Benedict et al. (2011) —. 2011, AJ, 142, 187
- Bono et al. (2008) Bono, G., Stetson, P. B., Sanna, N., et al. 2008, ApJ, 686, L87
- Bono et al. (2019) Bono, G., Iannicola, G., Braga, V. F., et al. 2019, ApJ, 870, 115
- Brout et al. (2019) Brout, D., Scolnic, D., Kessler, R., et al. 2019, ApJ, 874, 150
- Calamida et al. (2005) Calamida, A., Stetson, P. B., Bono, G., et al. 2005, The Astrophysical Journal, 634, L69
- Calamida et al. (2017) Calamida, A., Strampelli, G., Rest, A., et al. 2017, AJ, 153, 175
- Capozzi & Raffelt (2020) Capozzi, F., & Raffelt, G. 2020, Phys. Rev. D, 102, 083007
- Chen et al. (2018) Chen, S., Richer, H., Caiazzo, I., & Heyl, J. 2018, ApJ, 867, 132
- Da Costa & Armandroff (1990) Da Costa, G. S., & Armandroff, T. E. 1990, AJ, 100, 162
- Eadie & Harris (2016) Eadie, G. M., & Harris, W. E. 2016, The Astrophysical Journal, 829, 108
- Eadie & Harris (2016) Eadie, G. M., & Harris, W. E. 2016, VizieR Online Data Catalog, J/ApJ/829/108
- Fernández-Trincado et al. (2015) Fernández-Trincado, J. G., Robin, A. C., Vieira, K., et al. 2015, A&A, 583, A76
- Freedman et al. (2012) Freedman, W. L., Madore, B. F., Scowcroft, V., et al. 2012, ApJ, 758, 24
- Freedman et al. (2019) Freedman, W. L., Madore, B. F., Hatt, D., et al. 2019, The Astrophysical Journal, 882, 34
- Freedman et al. (2020) Freedman, W. L., Madore, B. F., Hoyt, T., et al. 2020, The Astrophysical Journal, 891, 57
- Gaia Collaboration et al. (2020) Gaia Collaboration, Brown, A. G. A., Vallenari, A., et al. 2020, arXiv e-prints, arXiv:2012.01533
- Gaia Collaboration et al. (2016) Gaia Collaboration, Prusti, T., de Bruijne, J. H. J., et al. 2016, A&A, 595, A1
- Gaia Collaboration et al. (2018a) Gaia Collaboration, Helmi, A., van Leeuwen, F., et al. 2018a, A&A, 616, A12
- Gaia Collaboration et al. (2018b) Gaia Collaboration, Brown, A. G. A., Vallenari, A., et al. 2018b, A&A, 616, A1
- Górski et al. (2018) Górski, M., Pietrzyński, G., Gieren, W., et al. 2018, AJ, 156, 278
- Górski et al. (2020) Górski, M., Zgirski, B., Pietrzyński, G., et al. 2020, ApJ, 889, 179
- Harris (1996) Harris, W. E. 1996, AJ, 112, 1487
- Haschke et al. (2011) Haschke, R., Grebel, E. K., & Duffau, S. 2011, AJ, 141, 158
- Huang et al. (2020) Huang, C. D., Riess, A. G., Yuan, W., et al. 2020, ApJ, 889, 5
- Jang & Lee (2015) Jang, I. S., & Lee, M. G. 2015, ApJ, 807, 133
- Jang & Lee (2017) —. 2017, ApJ, 835, 28
- Jang et al. (2021) Jang, I. S., Hoyt, T. J., Beaton, R. L., et al. 2021, ApJ, 906, 125
- Kaluzny et al. (1996) Kaluzny, J., Kubiak, M., Szymanski, M., et al. 1996, A&AS, 120, 139
- Lee et al. (1993) Lee, M. G., Freedman, W. L., & Madore, B. F. 1993, ApJ, 417, 553
- Lindegren et al. (2018) Lindegren, L., Hernández, J., Bombrun, A., et al. 2018, A&A, 616, A2
- Lindegren et al. (2020a) Lindegren, L., Bastian, U., Biermann, M., et al. 2020a, arXiv e-prints, arXiv:2012.01742
- Lindegren et al. (2020b) Lindegren, L., Klioner, S. A., Hernández, J., et al. 2020b, arXiv e-prints, arXiv:2012.03380
- Macri et al. (2006) Macri, L. M., Stanek, K. Z., Bersier, D., Greenhill, L. J., & Reid, M. J. 2006, ApJ, 652, 1133
- Madore & Freedman (1995) Madore, B. F., & Freedman, W. L. 1995, AJ, 109, 1645
- Mager et al. (2008) Mager, V. A., Madore, B. F., & Freedman, W. L. 2008, ApJ, 689, 721
- Maíz Apellániz et al. (2021) Maíz Apellániz, J., Pantaleoni González, M., & Barbá, R. H. 2021, arXiv e-prints, arXiv:2101.10206
- Marconi et al. (2014) Marconi, M., Musella, I., Di Criscienzo, M., et al. 2014, MNRAS, 444, 3809
- McQuinn et al. (2019) McQuinn, K. B. W., Boyer, M., Skillman, E. D., & Dolphin, A. E. 2019, ApJ, 880, 63
- Milone et al. (2017) Milone, A. P., Marino, A. F., Bedin, L. R., et al. 2017, MNRAS, 469, 800
- Mould et al. (2019) Mould, J., Clementini, G., & Da Costa, G. 2019, Publications of the Astronomical Society of Australia, 36, e001
- Nataf et al. (2020) Nataf, D. M., Cassisi, S., Casagrande, L., & Riess, A. G. 2020, arXiv e-prints, arXiv:2006.03603
- Pancino et al. (2000) Pancino, E., Ferraro, F. R., Bellazzini, M., Piotto, G., & Zoccali, M. 2000, The Astrophysical Journal, 534, L83
- Pietrzyński et al. (2019) Pietrzyński, G., Graczyk, D., Gallenne, A., et al. 2019, Nature, 567, 200
- Poveda & Allen (1975) Poveda, A., & Allen, C. 1975, ApJ, 197, 155
- Reid et al. (2019) Reid, M. J., Pesce, D. W., & Riess, A. G. 2019, ApJ, 886, L27
- Riello et al. (2020) Riello, M., De Angeli, F., Evans, D. W., et al. 2020, arXiv e-prints, arXiv:2012.01916
- Riess et al. (2020) Riess, A. G., Casertano, S., Yuan, W., et al. 2020, arXiv e-prints, arXiv:2012.08534
- Riess et al. (2018) —. 2018, ApJ, 861, 126
- Rizzi et al. (2007) Rizzi, L., Tully, R. B., Makarov, D., et al. 2007, ApJ, 661, 815
- Sakai et al. (1996) Sakai, S., Madore, B. F., & Freedman, W. L. 1996, ApJ, 461, 713
- Schlafly & Finkbeiner (2011) Schlafly, E. F., & Finkbeiner, D. P. 2011, The Astrophysical Journal, 737, 103
- Shao & Li (2019) Shao, Z., & Li, L. 2019, MNRAS, 489, 3093
- Skowron et al. (2020) Skowron, D. M., Skowron, J., Udalski, A., et al. 2020, arXiv e-prints, arXiv:2006.02448
- Thompson et al. (2001) Thompson, I. B., Kaluzny, J., Pych, W., et al. 2001, AJ, 121, 3089
- Thompson et al. (2020) Thompson, I. B., Udalski, A., Dotter, A., et al. 2020, MNRAS, 492, 4254
- Verde et al. (2019) Verde, L., Treu, T., & Riess, A. G. 2019, Nature Astronomy, 3, 891
- Watkins et al. (2015) Watkins, L. L., van der Marel, R. P., Bellini, A., & Anderson, J. 2015, ApJ, 812, 149
- Yuan et al. (2019) Yuan, W., Riess, A. G., Macri, L. M., Casertano, S., & Scolnic, D. M. 2019, The Astrophysical Journal, 886, 61
- Zennaro et al. (2019) Zennaro, M., Milone, A. P., Marino, A. F., et al. 2019, Monthly Notices of the Royal Astronomical Society, 487, 3239
- Zinn (2021) Zinn, J. C. 2021, arXiv e-prints, arXiv:2101.07252
- Zinn et al. (2019) Zinn, J. C., Pinsonneault, M. H., Huber, D., & Stello, D. 2019, ApJ, 878, 136