Proplyds in the Flame Nebula NGC 2024
Abstract
A recent survey of the inner pc of the NGC 2024 star forming region revealed two distinct millimetre continuum disc populations that appear to be spatially segregated by the boundary of a dense cloud. The eastern (and more embedded) population is Myr old, with an ALMA mm continuum disc detection rate of about per cent. However this drops to only per cent in the 1 Myr western population. When presenting this result, van Terwisga et al. 2020 suggested that the two main UV sources, IRS 1 (a B0.5V star in the western region) and IRS 2b (an O8V star in the eastern region, but embedded) have both been evaporating the discs in the depleted western population.
In this paper we report the firm discovery in archival HST data of 4 proplyds and 4 further candidate proplyds in NGC 2024, confirming that external photoevaporation of discs is occurring. However, the locations of these proplyds changes the picture. Only three of them are in the depleted western population and their evaporation is dominated by IRS 1, with no obvious impact from IRS 2b. The other 5 proplyds are in the younger eastern region and being evaporated by IRS 2b. We propose that both populations are subject to significant external photoevaporation, which happens throughout the region wherever discs are not sufficiently shielded by the interstellar medium. The external photoevaporation and severe depletion of mm grains in the 0.2-0.5 Myr eastern part of NGC 2024 would be in competition even with very early planet formation.
Keywords:
galaxies: star clusters: individual: NGC 2024 – circumstellar matter – accretion, accretion discs – protoplanetary discs – galaxies: star formation1 Introduction
Planet formation is increasingly being considered in the wider context of star forming regions (Parker 2020, for a recent review see). The environmental impact on discs and planets from the surroundings may take place through external photoevaporation (Störzer & Hollenbach 1999; Adams et al. 2004; Facchini et al. 2016; Guarcello et al. 2016; Kim et al. 2016; Ansdell et al. 2017; Eisner et al. 2018; Haworth & Clarke 2019; Nicholson et al. 2019; Reiter & Parker 2019; Concha-Ramírez et al. 2019b; Winter et al. 2020a, e.g.), gravitational encounters (Cabrit et al. 2006; Dai et al. 2015; Rodriguez et al. 2018; Winter et al. 2018b; Concha-Ramírez et al. 2019a; Moore et al. 2020, e.g.), chemical enrichment, such as through short lived radionuclides from supernovae (Kuffmeier et al. 2016; Close & Pittard 2017; Lichtenberg et al. 2019) and cosmic ray ionisation (Kuffmeier et al. 2020). In terms of direct impact on the physical characteristics (mass/radius) of an established disc, external photoevaporation is generally thought to dominate over encounters (Scally & Clarke 2001; Winter et al. 2018a). Cosmic rays may affect the initial conditions of discs through the strength of magnetic braking (Kuffmeier et al. 2020).
We have growing statistical evidence for the impact of radiation environment on discs (Fang et al. 2012; Mann et al. 2014; Maucó et al. 2016; Guarcello et al. 2016; Ansdell et al. 2017; Eisner et al. 2018, e.g.). However an ongoing issue is that we have very limited sample of individual discs with observed photoevaporative outflows. The most intense study has been of photoevaporating individual discs in the Orion Nebular Cluster (ONC) – the famous “proplyds” with cometary morphologies consisting of a cusp and tail, as illustrated schematically in Figure 1 (McCaughrean & O’dell 1996; O’dell 1998; Henney & O’Dell 1999; Bally et al. 2000; Henney et al. 2002). Other photoevaporating discs are in similarly strong, or stronger, UV environments including in Pismis 24 (Fang et al. 2012, 5 candidate proplyds in a UV environment even stronger than the ONC –) and Carina (Smith et al. 2010, e.g.)
Recently Kim et al. 2016 discovered 7 proplyds in NGC 1977, a UV environment around 2 orders of magnitude weaker than the ONC. This provided important first direct evidence for external photoevaporation operating in weaker UV environments. However, more examples are required across a larger range of UV environments to truly understand the photoevaporation process in action. To this end we require both more proplyd detections and to understand evaporation signatures so that we can detect a wind when it is more subtle (Haworth & Owen 2020, e.g. in CI and CO lines –).
The stellar cluster NGC 2024 was recently observed with ALMA by van Terwisga et al. 2020, who found that there were two disc populations that are similar in age, but separated both spatially and in terms of disc fraction. The slightly younger ( Myr) population, within and on the eastern side of a dense molecular cloud, has an ALMA 1.3 mm disc fraction of per cent (van Terwisga et al. 2020, the rms noise of observations was 0.058 mJy beam-1 and lowest “detection” dust mass was M⊕) and masses similar to 1-3 Myr old star forming regions such as Lupus. The slightly older ( Myr) population lies on the western side of the cloud and has an ALMA mm disc fraction of only per cent. Being less shielded and containing the B0 star IRS 1 it was speculated that external photoevaporation may have been responsible for depleting the western disc population. However it is also possible that discs in the western region simply began with lower masses. Note that the near infrared disc fraction over a much larger extent of the region ( vs ) is higher, at around 85 per cent (Haisch et al. 2001a; Haisch et al. 2001b)
Kuffmeier
et al. 2020 recently suggested that higher cosmic ray ionisation rates can enhance the impact of magnetic braking and lead to initially smaller (and hence possibly shorter lived) discs. They suggested that this might provide an alternative explanation for the different sub-mm detection fractions in NGC 2024. It is important to understand what has had such a large impact on these two disc populations, both to understand this region and the planet formation process more generally. Determining the impact of external photoevaporation in this type of environment is therefore key.
Motivated by van Terwisga et al. 2020, here we search archival Hubble Space Telescope (HST) data for photoevaporating discs in NGC 2024. We discover 4 proplyds and 4 further candidates which demonstrate that external photoevaporation is indeed operating throughout the region.

2 Overview of UV sources and structure of NGC 2024
A mosaic overview of NGC 2024 in the HST F160W filter (m) constructed with data from the MAST11 1 https://archive.stsci.edu/ science archive (PI: Arce) is given in Figure 2. Overlaid are Herschel PACS blue 70m contours from 1–6 Jy pixel-1 using data from the ESA Herschel Science Archive22 2 http://archives.esac.esa.int/hsa/whsa/ (PI: Megeath). The diagonal line at the western edge of the cloud separates the younger ( Myr) population from the 1 Myr old population that exhibit relatively depleted mm-fluxes (Haisch et al. 2000; Getman et al. 2014; van Terwisga et al. 2020). The star symbols denote the positions of the main UV sources: IRS1 (B0.5V star), IRS2b (08V star) and IRS 2 (B star), which are summarised in Table 1. The circles denote the positions of proplyds introduced in this paper (discussion of these is left for sections 5 and 6.
NGC 2024 is the youngest cluster in Orion and richest in star formation in Orion B (Meyer 1996; Levine et al. 2006). There are two main UV sources. IRS 1 (Garrison 1968, a B0.5V star –) is not embedded and resides in the Myr region which van Terwisga et al. 2020 conclude has a depleted mm disc population. Given our interest in proplyds it is worth noting that IRS 1 is similar to 42 Ori in NGC 1977, where 8 proplyds have now been discovered (Bally et al. 2012; Kim et al. 2016).
IRS 2b (Bik et al. 2003, an O8V star) is in the eastern ( Myr) population (van Terwisga et al. 2020). IRS 2 is an embedded B-type star in close projected proximity to IRS 2b and is expected to be of secondary importance in terms of its contribution to the UV flux in the region.
For some time only IRS 1 and 2 were known in NGC 2024, giving rise to the problem that neither have hard enough a spectrum to explain the degree of hydrogen and helium ionisation (Bik et al. 2003). The discovery of the more massive IRS 2b appears to resolve this (Thompson et al. 1981; Kruegel et al. 1982; Barnes et al. 1989; Bik et al. 2003; Kandori et al. 2007; Burgh et al. 2012, e.g.), though it is still not ruled out that there are perhaps other UV sources on the far side of the dense cloud. Kruegel et al. 1982 and Bik et al. 2003 respectively suggest and ionising photons per second are being absorbed by the gas to give the observed radio continuum signal. Note that these values are a lower limit since dust absorption of ionising photons, or ionising photons escaping from the region, will not ionise the gas and contribute to the radio continuum. IRS 1 cannot explain all of the ionising flux expected from the radio continuum, but the exact value of the relative contributions from IRS 1/ IRS 2b is unknown.
In many star forming regions a single ionising source is dominant. However, NGC 2024 has a complicated structure with a lot of gas and dust in the region, so it isn’t obvious that IRS 2b necessarily dominates the UV of the entire region.
The cusp of proplyds point towards the UV source responsible for evaporating them (see Figure 1), so the detection of proplyds in NGC 2024 would also shed light on where the different UV sources dominate over one another. Furthermore, if proplyds were discovered pointing towards none of the known UV sources, it would give clues to the location of additional massive star(s).
3 Theoretical potential for proplyds
For proplyds to be visible and resolvable requires a combination of sufficient EUV irradiation and a high-enough mass-loss rate. The radius of the ionisation front can be approximated by assuming a balance between EUV flux and recombinations in the flow (Johnstone et al. 1998, see):
| (1) |
where is the EUV photon count from the (external) ionising source, is the distance to that source, and is the wind driven mass-loss rate from the disc.
We estimate the radiation field at any given point in NGC 2024 as a function of the distance (in practice, the projected separation) from the two known main UV sources: IRS 1 and IRS 2b (see section 2/Table 1).
| UV | RA | DEC | Spectral | |
|---|---|---|---|---|
| Source | class | |||
| IRS 1 | 05 41 37.8540 | -01 54 36.6256 | B0.5V | |
| IRS 2 | 05 41 45.81 | -01 54 29.8 | B | |
| IRS 2b | 05 41 45.50 | -01 54 28.7 | O8V |
The intrinsic hydrogen ionising photon count from these sources, following Sternberg et al. 2003, is and for IRS 1 and IRS 2b respectively. This does give a higher input ionising flux than inferred from the radio continuum (Bik et al. 2003, e.g.), but as discussed in section 2 the radio continuum does only provide a lower limit. In the discussion section 6.1 we will also consider values a factor 5 lower for the ionising photon emission rate from IRS1/IRS2b.
As a function of distance (projected separation) we hence have an ionising photon flux of
| (2) |
and
| (3) |
for IRS1 and IRS2b respectively.
The ionising flux is important for estimating mass loss rates as per equation 1. It is also useful to estimate the magnitude of the FUV radiation, which we do to first order by integrating over a blackbody spectrum, assuming stellar temperature and luminosity from Sternberg et al. 2003. This gives erg s-1 and erg s-1 for IRS1 and IRS 2b respectively. IRS1 is in a relatively open part of the region, so there is comparatively little extinction to the stellar neighbours in the cluster. Extinction may play a large role in the vicinity of IRS2b though, with many of the nearby stars being embedded. Assuming the no-extinction case provides an upper limit, the FUV radiation field strength as a function of distance from the UV sources is
| (4) |
and
| (5) |
for IRS1 and IRS2b respectively. where is the Habing unit of the radiation field33 3 Note that an alternative measure of the UV field is the Draine , which is 1.71 times larger than the Habing unit. Hence is .
Given that the region studied by van Terwisga et al. 2020 and illustrated in Figure 2 is around half a parsec in size, these ionising and FUV flux estimates are high enough that we theoretically expected them to drive significant photoevaproative winds from discs in the region, as long as they are not deeply embedded (Johnstone et al. 1998; Haworth et al. 2018b, e.g.).
4 Archival HST Observations
We searched for historical Hubble Space Telescope (HST) observations towards NGC 2024 in the MAST44 4 https://archive.stsci.edu/ science archive and Hubble Legacy Archive55 5 https://hla.stsci.edu/ (HLA).
4.1 WFC2 H
We studied Wide Field Camera 2 H images from the HLA. For these all we required was the morphological identification of proplyds, their coordinates and measurements of the ionisation front size. We therefore used the data directly as it appears in the science archive, with no further manipulation. We use a single field that is image 1 from Proposal ID 5983, F656N, PI: Stapelfeldt 1995. The pixel size is 0.1″which corresponds to 41 au at a distance of 414 pc (Menten et al. 2007; Bailer-Jones et al. 2018).
4.2 NICMOS Paschen
The main dataset that we use was originally obtained in 2003 by Stapelfeldt & Hines (Proposal ID: 9424, PI Stapelfeldt). These used camera 2 of NICMOS in filters centered on Paschen (F187N) and the nearby (in wavelength) continuum (F190N) to image fields centered on 16 compact VLA sources in the region. Subtracting the F190N image from the F187N therefore leaves continuum subtracted Paschen emission. The pixel size is 0.075″which corresponds to 31 au at a distance of 414 pc.
A 3-position spiral dither pattern was executed for each object, with 5″ offsets to mitigate against bad pixels, residual cosmic rays and other imaging artifacts within 10″ of the centre of the field of view. Three positions (the usual recommended pattern uses four positions) were used to maximize the serendipitous field of view and yet still fit within the allocated observing time. After processing through the STScI pipeline, the three dithered images were shifted into common world coordinates and median combined. The resulting mosaic images were used to construct Paschen line images by subtracting the F190N image scaled by the appropriate bandpass (the stellar photosphere is assumed to be flat across the F187N and F190N bandpasses).

| Object | RA | DEC | UV | Projected | Van Terwisga et al. | |||
|---|---|---|---|---|---|---|---|---|
| source | Separation (pc) | (au) | ( yr-1) | 2020 counterpart | () | |||
| Proplyd 1 | 05 41 36.23 | -01 54 24.26 | IRS1 | 0.055 | IRC215 | |||
| (VLA 1) | (0.28 from IRS 2b) | |||||||
| Proplyd 2 | 05 41 38.08 | -01 54 18.41 | IRS1 | 0.037 | IRC116 | |||
| (VLA 4) | (0.22 from IRS2b) | |||||||
| Proplyd 3 | 05 41 45.62 | -01 54 57.26 | IRS2b | 0.057 | IRC057 | |||
| (VLA 20b) | (0.23 from IRS1) | |||||||
| Proplyd 4 | 05 41 44.93 | -01 54 54.06 | IRS2b | 0.054 | IRC59 | |||
| (VLA 20a) | (0.22 from IRS1) | |||||||
| Candidate | 05 41 41.53 | -01 54 11.5 | IRS2b | 0.124 | IRC 123 | |||
| Proplyd 5 | (0.121 from IRS1) | |||||||
| Candidate | 05 41 42.12 | -01 54 05.58 | IRS2b | 0.11 | – | – | ||
| Proplyd 6 | (0.14 from IRS1) | |||||||
| Candidate | 05 41 42.43 | -01 54 09.72 | IRS2b | 0.10 | IRC 124 | |||
| Proplyd 7 | (0.15 from IRS1) | |||||||
| Candidate | 05 41 34.42 | -01 53 19.49 | IRS1 | 0.19 | – | – | ||
| Proplyd 8 | (0.36 from IRS 2b) |
5 Proplyds in NGC 2024
5.1 Overview
We have firmly identified 4 proplyds and have 4 other candidate proplyds in NGC 2024. Two of these were found in the F656N filter (H ) and the other 6 in F187N-F190N (Paschen ). Three proplyds are in the western region (van Terwisga et al. 2020, the Myr population with only per cent of discs detected in the mm-continuum by) and pointing towards the B0.5V star IRS 1. The other 5 are in the Myr higher mm disc fraction region, pointing towards the O8 star IRS2b. These will all be discussed in detail below, but for quick reference, image galleries of the proplyds are given in Figures 3–6 and a summary of their main parameters is given in Table 2. The locations of the 8 propylds and the main UV sources are also provided in the overview of the region in Figure 2.
We next introduce the basic properties (morphology, location, environment) of each proplyd in turn and in the discussion turn our attention to the region as a whole.
The ionisation front radii were estimated using the radius of a circle manually drawn over the cusp of the proplyd (see Figure 1). Uncertainties are based on circles that trace the inner and outer edge of the cusp.
5.2 Proplyd 1
Proplyd 1, discovered in F656N H (Stapelfeldt et al. 1997, and preliminarily introduced in the proceedings of ) is shown in Figure 3. It is at a projected separation (Menten et al. 2007; Bailer-Jones et al. 2018, assuming a distance of 414 pc,) of 0.055 pc from the B0.5V star IRS 1, towards which its bright cusp is directed. The morphology of Proplyd 1 is not simply cometary, with additional H emission extending to the south west. We interpret this as being from a jet.
From equations 2 and 4 the UV and ionising flux is and s-1 respectively. From an approximate manual measurement of the radial extent of the cusp we assume an ionisation front radius of au. The expected mass loss rate from equation 1 for this proplyd is hence M⊙ yr-1. Proplyd 1 also has a counterpart in van Terwisga et al. 2020, where a dust mass of M⊕ is inferred.
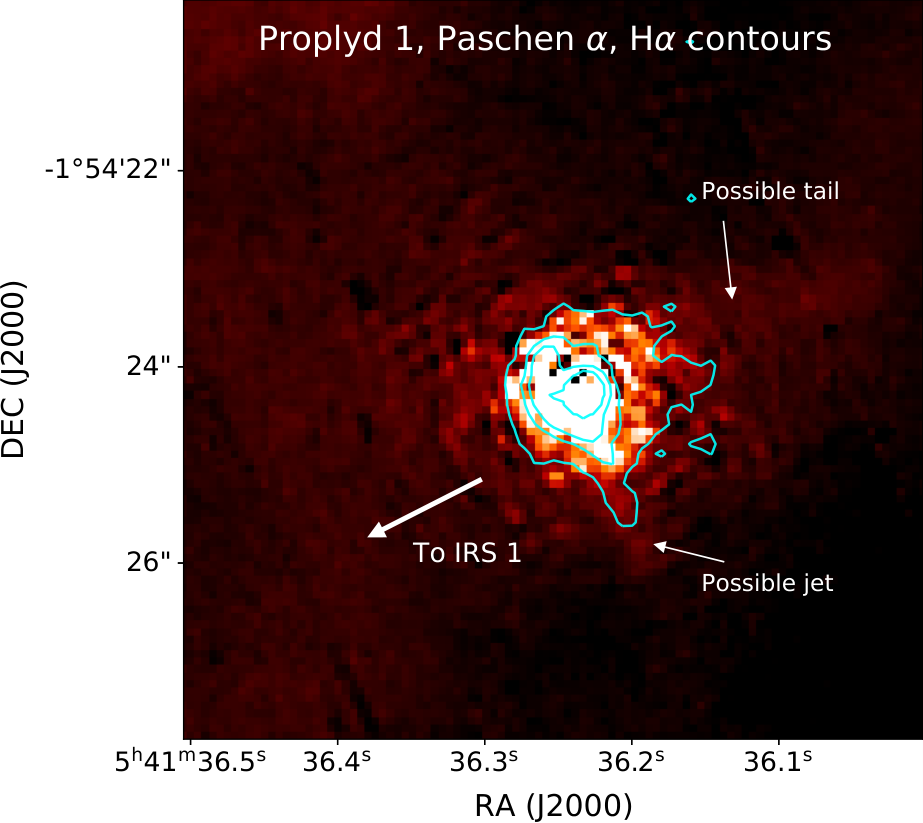
There is also archival F187N-F190N (Paschen ) data for proplyd 1, which is shown in Figure 4 with H contours overlaid. Since the point spread function of the F187N and F190N images are slightly different sizes, unresolved Paschen emission associated with the star has led to artifacts which makes the cusp and jet difficult to identify. However, larger scale emission from the jet and possibly also a more extended component of the tail are discernible.
5.3 Proplyd 2
Proplyd 2 was discovered in F187N-F190N (Paschen ) emission. The F187N, F190N (continuum) and F187N-F190N images for Proplyd 2 are shown in the upper row of panels in Figure 5. Proplyd 2 is 0.037 pc from IRS 1 and an arrow is included on each panel pointing towards it. Like Proplyd 1, there are bipolar streaks of emission in addition to the typical proplyd cusp which as in the case of proplyd 1 we again interpret as being due to a jet.
From equations 2 and 4 the UV and ionising flux is and s-1 respectively. From an approximate manual measurement of the radial extent of the cusp we assume an ionisation front radius of au. The expected mass loss rate from equation 1 for this proplyd is hence M⊙ yr-1.
Proplyd 2 also has a counterpart in van Terwisga et al. 2020, where a dust mass of M⊕ is inferred.
5.4 Proplyd 3
Proplyd 3 was discovered in F187N-F190N (Paschen ) emission. The F187N, F190N (continuum) and F187N-F190N images for Proplyd 3 are shown in the middle row of panels in Figure 5. Proplyd 3 is 0.057 pc from the 08V star IRS 2b, towards which it points. An arrow is included on each panel in the direction of IRS 2b. There are no additional “jet” features for Proplyd 3. It beautifully exhibits the classical cometary morphology of many ONC proplyds (O’dell 1998, e.g.).
From equations 2 and 4 the UV and ionising flux is and s-1 respectively. From an approximate manual measurement of the radial extent of the cusp we assume an ionisation front radius of au. The expected mass loss rate from equation 1 for this proplyd is hence M⊙ yr-1.
Proplyd 3 also has a counterpart in van Terwisga et al. 2020, where a dust mass of M⊕ is inferred.
5.5 Proplyd 4 (and possibly 4b)
Proplyd 4 was discovered in F187N-F190N (Paschen ) emission. The F187N, F190N (continuum) and F187N-F190N images for Proplyd 4 are shown in the bottom row of panels in Figure 5. Proplyd 4 points towards IRS 2b, which lies at a projected distance of 0.054 pc. An arrow is included on each panel in the direction of IRS 2b.
Proplyd 4 exhibits a clear bright cusp with only a faint cometary tail. There is also an intriguing secondary Paschen source which may well be an evaporating binary companion. The projected separation between these two objects is only about an arcsecond, corresponding to 413 au at a distance of 414 pc. However given that the orbital configuration is unknown 413 au represents a lower limit on the true binary separation. Other binary proplyds have been discovered and, depending on the binary separation there may or may not be an interproplyd shell formed from the collision of the individual proplyd outflows (Graham et al. 2002; Henney 2002; Hodapp et al. 2009; Vasconcelos et al. 2010; Wu et al. 2013; Wu et al. 2018, e.g.). In numerical simulations of evaporating binary propylds, Vasconcelos et al. 2010 found that for separations au an interproplyd shell does develop, but this is not the case for binaries of separation less than around 200 au. With a separation of at least 400 au in the case of Proplyd 4, it is conceivable that there might be an interproplyd shell, however it is not easily discerned in the archival Paschen data.
From equations 2 and 4 the UV and ionising flux is and s-1 respectively. From an approximate manual measurement of the radial extent of the cusp we assume an ionisation front radius of au. The expected mass loss rate from equation 1 for this proplyd is hence M⊙ yr-1.
Proplyd 4 also has a counterpart in van Terwisga et al. 2020, where a dust mass of M⊕ is inferred.


5.6 Candidate Proplyd 5
We now turn our attention to the more subtle, candidate, proplyds discovered in NGC2024. Although less clear, these all exhibit a proplyd morphology in the direction of either IRS 1 or IRS 2b. The candidate proplyds are also at larger distances, which probably explains why the proplyd morphology is less obvious.
Candidate Proplyd 5 was discovered in F187N-F190N (Paschen ) emission. A F187N-F190N image of Proplyd 5 is shown in the upper left panel of Figure 6. Candidate Proplyd 5 points towards IRS 2b, which lies at a projected distance of 0.124 pc. An arrow is included in the direction of IRS 2b. From equations 2 and 4 the UV and ionising flux is and s-1 respectively.
Candidate Proplyd 5 is very large radius cusp of au, which corresponds to a mass loss rate of M⊙ yr-1 from equation 1.
Candidate Proplyd 5 also has a counterpart in van Terwisga et al. 2020, where a dust mass of M⊕ is inferred.
5.7 Candidate Proplyd 6
Candidate Proplyd 6 was discovered in F187N-F190N (Paschen ) emission. A F187N-F190N image of Proplyd 6 is shown in the upper right panel of Figure 6. Candidate Proplyd 6 points towards IRS 2b, which lies at a projected distance of 0.11 pc. An arrow is included in the direction of IRS 2b. From equations 2 and 4 the UV and ionising flux is and s-1 respectively.
Candidate Proplyd 6 has only a faint cusp and was primarily identified through its cometary tail.
From an approximate manual measurement of the radial extent of the cusp we assume an ionisation front radius of au. This corresponds to a mass loss rate of M⊙ yr-1 from equation 1.
We could find no obvious counterpart for candidate proplyd 6 van Terwisga et al. 2020
5.8 Candidate Proplyd 7
Candidate Proplyd 7 was discovered in F187N-F190N (Paschen ) emission. A F187N-F190N image of Proplyd 7 is shown in the lower left panel of Figure 6. Candidate Proplyd 7 points towards IRS 2b, which lies at a projected distance of 0.10 pc. An arrow is included in the direction of IRS 2b. From equations 2 and 4 the UV and ionising flux is and s-1 respectively.
Candidate Proplyd 7 is close to candidates 5 and 6 and exhibits a cusp, but no obvious cometary tail. There is a bright Paschen source slightly further than candidate 7 relative to IRS 2b. This is not a result of bad subtraction, but rather that this is a very bright Paschen emitter, probably due to strong accretion.
From an approximate manual measurement of the radial extent of the cusp we assume an ionisation front radius of au. This corresponds to a mass loss rate of M⊙ yr-1 from equation 1.
Candidate Proplyd 7 also has a counterpart in van Terwisga et al. 2020, where a dust mass of M⊕ was inferred.


5.9 Candidate Proplyd 8
Candidate Proplyd 8 was discovered in F656N (H ) emission. A H image of Proplyd 8 is shown in the lower right panel of Figure 6. Candidate Proplyd 8 points towards IRS 1, which lies at a projected distance of 0.19 pc. An arrow is included in the direction of IRS 1. It is also possible that the tail of candidate proplyd 8 is a (very asymmetric) jet, though the alignment of the tail with the vector from IRS 1 is supportive of it being external photoevaporation. However, it is interesting to note that at least 2/3 of the proplyds in the older western region near IRS 1 have possible jets whereas none of the proplyds towards IRS 2b appear to.
From equations 2 and 4 the UV and ionising flux is and s-1 respectively. Candidate Proplyd 8 is in the weakest UV environment of the proplyds introduced in this paper.
Candidate Proplyd 8 has a very small unresolved cusp (it spans a maximum of about 3 pixels in diameter) and a bright cometary tail. We assume an upper limit on the ionisation front radius of 60 au. This corresponds to a mass loss rate of M⊙ yr-1 from equation 1.
Candidate Proplyd 8 has no obvious counterpart in van Terwisga et al. 2020 and may be beyond the field they studied (it is beyond the limits of their Figure 1).
6 Discussion
6.1 Mass loss rates and proplyd lifetimes
Figure 7 shows the equation 1 predicted ionisation-front radius of a proplyd as a function of distance from IRS 1 (upper panel) and IRS 2b (lower panel). Different lines correspond to mass loss rates from M⊙ yr-1 using the UV fluxes from Sternberg et al. 2003. The shaded areas span a UV flux down to a factor 5 lower. Overlaid are the ionisation front radii and projected separations of our observed proplyds on the panel of the suspected UV source responsible for photoevaporation (note that the estimated mass loss rates are all stated in section 5 / Table 2).
The NGC 2024 proplyds (known so far) are all within 0.2 pc of the exciting UV sources. The mass loss rates of proplyds near IRS 2b are generally higher than those near IRS 1. This is at least in part due to the stronger UV flux from the higher mass IRS 2b. However the discs near IRS 2b are also younger and therefore likely to be more massive and possibly also more extended which would also drive up the mass loss rate (Haworth et al. 2018a; Haworth et al. 2018b; Winter et al. 2020b, e.g.).
The mass loss rates are generally higher than those inferred for the NGC 1977 proplyds ( M⊙ yr-1) by Kim et al. 2016, with the exception of candidate proplyd 8. This is because the NGC 2024 proplyds are closer to the UV sources (meaning stronger UV fluxes) as well as younger and hence possibly more massive/extended.
The ratio of a disc mass estimate to the mass loss rate gives a zeroth order estimate of the disc lifetime, however this comes with a number of caveats. The mass loss rate is typically a strong function of disc radius (Haworth et al. 2018b, e.g.) and an evaporating disc gets truncated over time. High mass loss rates hence quickly result in a smaller disc with a much lower mass loss rate that survives much longer than one would anticipate based on the earlier mass loss rate. In addition, the UV flux that any given disc is exposed to at pc distances from the UV source for km s-1 velocity dispersions can change by up to two orders of magnitude within 1 Myr (Störzer & Hollenbach 1999; Winter et al. 2019). We also estimated the mass loss rate using the projected separation, when the true separation could be somewhat larger (and hence mass loss rate lower). The other key caveat here is that the van Terwisga et al. 2020 masses are in the mm dust only and it is the gas that is predominantly evaporated (Facchini et al. 2016; Sellek et al. 2020). These caveats aside, assuming a dust-to-gas mass ratio of 1/100 the proplyd values are typically only a few tens of kyr, with the largest value being kyr for Proplyd 1. For the younger proplyds near IRS 2b the argument could be made that they have only recently begun being subject to photoevaporation (e.g. as IRS 2b ceased being so embedded along certain lines of sight). However proplyd 1, near IRS 1, is in the Myr old region, raising the proplyd lifetime problem known from the ONC (O’dell & Wen 1994, e.g.). The solution to this seems to require either a lower dust-to-gas mass ratio (Sellek et al. 2020, and hence higher gas mass than anticipated from continuum measurements,), ongoing star formation throughout NGC 2024 (even in the depleted western region) or that the remaining proplyds in the west recently migrated in towards IRS 1 (Winter et al. 2019). The former solution of higher-than-canonical mass discs was also required by Haworth et al. 2018a to explain the formation of Trappist-1, even in weak UV environments and high mass discs have since been shown to be sustainable in a gravitationally stable manner around low mass stars (Haworth et al. 2020; Cadman et al. 2020).
It is also important to note that proplyds have now been found in regions with ages ranging from Myr (this paper) to around 1.5 Myr (Kim et al. 2016; Kounkel et al. 2018), so higher gas masses, ongoing star formation, or continuous migration of discs into the high UV environment would have to be taking place to observe proplyds over such a length of time.
6.2 Indirect evidence for external photoevaporation?
Much recent evidence for disc evaporation has come indirectly from the distribution of disc properties in a cluster, for example searching for correlations between the disc mass, radius or disc fraction as a function of projected separation from a UV source (Mann et al. 2014; Guarcello et al. 2016; Ansdell et al. 2017; Eisner et al. 2018, e.g.). Haisch et al. 2000 found no obvious trend in the infrared disc fraction as a function of projected radius in NGC 2024, but we looked for any imprint of radiation environment on the van Terwisga et al. 2020 disc masses.
NGC 2024 is a challenging region to look at in a statistical sense as proplyds are associated with both IRS 1 and IRS 2b. There is also a lot of gas and dust in the eastern region. The UV structure of the region is hence likely set by a complicated spatially varying combination of the two stars.
Figure 8 shows the van Terwisga et al. 2020 disc dust mass estimates as a function of projected separation from IRS 1 and IRS 2b. The blue points represent the new proplyds introduced in this paper (where mass estimates are available) and the red arrows are the discs for which van Terwisga et al. 2020 could only place upper limits on the dust mass. We evaluate the Pearson’s measure of linear correlation and Spearman’s measure of higher order correlation. In each case we also evaluate the p-value by randomly shuffling the arrays of projected separation/disc mass ten thousand times, re-computing the correlation metrics and keeping track of the fraction of distributions with weaker metrics than the true one.
In Figure 8 we include all discs with van Terwisga et al. 2020 mass constraints in each panel, regardless of whether or not they are closer in projected separation to IRS 1 or IRS 2b. Disc masses are found to weakly increase with increasing distance from IRS 1 (Pearson’s 0.2, p-value 0.12) (Spearman’s 0.27, p-value 0.05) though this will be influenced by the fact that there is a distinct population of younger more massive discs in the vicinity of IRS 2b. The disc masses are also found to weakly decrease with projected separation from IRS 2b (Pearson’s -0.27, p-value 0.05), (Spearman’s -0.2, p-value 0.13). The proplyds do not obviously stand out from the rest of the population, other than that they are some of the more massive members of the group (which gives a higher mass loss rate).
In Figure 9 we again plot the disc mass as a function of projected separation, but filtering the data such that only the discs nearest to the UV source in projected separation are included. Correlation factors for IRS 1 are now (Pearson’s 0.028, p-value 0.81) (Spearman’s 0.39, p-value ) and for IRS 2b (Pearson’s -0.23, p-value 0.013) (Spearman’s -0.144, p-value 0.16). Most of the upper limits correspond to the same disc mass, but re-computing after discarding all upper limits less than 2.5 M⊕ only makes the Pearson’s and Spearman’s correlations even weaker. So there is still no strong correlation with disc properties as a function of projected distance from either source.
A key point to explain the lack of spatially varying environmental imprint on the disc statistics is that the field considered here is rather small, with all discs being within pc of the UV sources. The correlation between disc mass and projected separation from Ori discovered by Ansdell et al. 2017 only kicks in beyond around 0.5 pc, with a flat distribution of masses interior to that. Over such a small distance scale the crossing timescale for a km s-1 velocity dispersion is Myr. Since both the East and Western zones are many crossing timescales old the disc masses would be randomised with projected separation.
In the older western region a larger fraction of discs only have upper limits on the mass, consistent with the picture that this is older and more of the discs have been heavily depleted by photoevaporation. In the younger eastern region around IRS 2b, many discs are younger and are probably still well shielded by the immediate interstellar medium. It is also worth noting that all of the proplyds associated with IRS 2b are at the edge of the dense ridge, which would be consistent with the young stars/discs being progressively exposed to the UV as the gas that they are embedded in is dispersed. So even if the region were not old enough for the crossing time to wash out any spatially varying imprint of evaporation, there may be no signature of evaporation as a function of projected separation simply because the discs are young and embedded.
6.3 External photoevaporation in NGC 2024: reflecting upon the van Terwisga et al. (2020) interpretation
van Terwisga et al. 2020 presented ALMA 1.3mm continuum observations of the two distinct populations in NGC 2024. They suggested that a key distinction was that the mm-depleted western population is much less embedded and possibly subject to evaporation by IRS 1 and IRS 2b. They also suggested that the discs in the western population may have just formed smaller and hence had shorter viscous lifetimes. It is important to understand if it is possible for there to be systematic regional variations in disc properties independent of environmental influence like photoevaporation (e.g. set by the initial molecular cloud properties there). One possible mechanism to enable this would be variations in the cosmic ray ionisation rate, which Kuffmeier et al. 2020 showed can affect the magnetorotational braking during collapse and lead to smaller disc sizes.
Our discovery of proplyds in NGC 2024 has some important implications for the discussion above. First of all, we have indeed confirmed that external photoevaporation is at work in the region. In the western region our proplyds point towards IRS 1, implying that the IRS 1 dominates the UV radiation field there and could have depleted the disc fraction in the region even without the help of IRS 2b.
What was not anticipated from van Terwisga et al. 2020 is ongoing photoevaporation in the eastern population, but with 5 of our proplyds in this zone we have shown that this is actually the case. Despite the eastern region being younger and having a higher disc fraction in terms of ALMA detections ( per cent) compared to the western region, the disc fraction is still low compared mm continuum detection rate in other star forming regions, such as Lupus (Ansdell et al. 2016, 70 per cent mm continuum detection fraction in a 1-2 Myr region) and Sigma Ori (Ansdell et al. 2017, 40 per cent mm continuum detection fraction in a 3-5 Myr region). Though future comparisons ensuring equivalent detection thresholds will be necessary, this is evidence that many discs in the eastern region of NGC 2024 that have not been shielded by the ISM have been subject to photoevaporation by IRS 2b.
6.4 Implications for planet formation
Our understanding of planet formation in the idealised scenario of discs as isolated systems is still not yet fully understood. By extension, the added complication of the impact of external photoevaporation on planet formation is not well understood. What is known is that external photoevaporation reduces the disc mass (Ansdell et al. 2017; Winter et al. 2018a; Sellek et al. 2020, e.g.), radius (Haworth et al. 2017; Eisner et al. 2018; Sellek et al. 2020, e.g) and lifetime (Guarcello et al. 2016; Concha-Ramírez et al. 2019b; Winter et al. 2020a, e.g.) which could all of course indirectly affect the formation of planets.
A key element for planet formation, even in the inner disc, is the dust reservoir of the entire disc. In the outer disc grains grow and drift inwards to smaller radii and can contribute to planet formation there, which is expected to be necessary to form the large mass of close-in planets (Birnstiel et al. 2012; Marcy et al. 2014; Ormel et al. 2017, e.g.).
In the outer disc, small dust grains get entrained in the photoevaporative wind (Facchini et al. 2016), whereas larger grains are pushed inwards with the retreating disc outer edge and could still ultimately contribute to planet formation (Sellek et al. 2020). The total dust mass lost in a disc is set by the competition between grain growth in the disc (which is fastest at small orbital radii) and the rate of external photoevaporation (Haworth et al. 2018a; Sellek et al. 2020, e.g.). If grain growth proceeds through the disc quickly enough, then only a small amount of dust would end up entrained in the wind. Conversely very strong, early photoevaporation could deplete significant amounts of the potential dust reservoir that could otherwise have migrated in to contribute to inner planet formation. A key question is therefore how long discs remain embedded, permitting dust to grow to a size where it is immune to photoevaporation once the source becomes exposed to the ultraviolet source.
In light of the above, our finding evidence for very early photoevaporation throughout NGC 2024 has added importance because it may also be significantly reducing the dust mass reservoir (in addition to the usual expected impact on the gas disc mass/radius/lifetime). This would also explain why the dust mass estimates of discs in the Myr eastern population of NGC 2024 are more comparable to those in Myr old regions (van Terwisga et al. 2020).
There is growing evidence for planet formation on Myr timescales (Segura-Cox et al. 2020, e.g.), but here we show evidence for very early external photoevaporation (0.2-0.5 Myr).
6.5 Potential for additional evaporating discs
Our search for externally photoevaporating discs in NGC 2024 using archival data is certainly not complete. The F187/F190 fields using NICMOS have a small field of view and the archival data does not cover the whole region. Future HST WFC3 and Paschen surveys may reveal more proplyds in the central region. Additional searches at larger distances from the less embedded western region may also reveal photoevaporative winds from discs where the UV field is weaker, e.g. in CI (Haworth & Owen 2020). Surveys out to larger distances from IRS 1 and IRS 2b may also reveal any statistical imprint of photoevaporation on the disc properties. The above combined with the need to confirm our candidate proplyds means that NGC 2024 is a prime region to search for further evidence for external disc photoevaporation.
7 Summary and conclusions
NGC 2024 is a young star forming region in Orion with a radial age gradient (Getman
et al. 2014). van Terwisga
et al. 2020 also recently found two slightly differently aged sub-populations with very different ALMA 1.3 mm continuum disc fractions in the inner ( pc) part of the region. To gauge the role of external photoevaporation of discs in sculpting these populations we searched for proplyds in archival HST observations of NGC 2024. We draw the following main conclusions in this work.
1) We discovered 4 firm proplyds and 4 candidate proplyds. Three of these are in the vicinity of the B0.5V star IRS 1 and the other 5 associated with the (younger and more embedded) O8V star IRS 2b. External photoevaporation of discs is definitely occurring in NGC 2024 and within both the statistically older and younger populations. It is also worthy of note that together with NGC 1977 (Kim
et al. 2016) early type B stars have now clearly been demonstrated as capable of evaporating the discs of nearby stars.
2) The geometry of the cometary proplyds introduced here can be explained using only IRS1 and IRS2b. No further embedded UV source is required. Proplyds 1 and 2 in the western region show evidence for a jet because of elongated emission through the cusp.
3) Proplyd 4 in this paper is possibly a binary proplyd with a separation of at least 400 au, though we cannot discern an interproplyd shell with the archival Paschen observations. Follow up observations of this system will be particularly interesting.
4) With a maximum proplyd of kyr, even with the caveats of such an estimate there appears to be a proplyd lifetime problem in NGC 2024. Furthermore, the proplyds are actually some of the more massive discs from van Terwisga
et al. 2020. This suggests that either discs are more massive in gas than expected from continuum measurements (Sellek
et al. 2020, i.e. that the dust-to-gas mass ratio is lower than ), that there is ongoing migration of relatively massive discs into the high UV inner part of the cluster, or ongoing star formation, in both regions (Winter et al. 2019).
5) There is no clear statistical imprint of evaporation on the disc masses in the region as a function of projected separation from the main UV sources, but this is unsurprising given the young age of the region and that the field being considered is very small so discs that are not embedded are evaporated to the same degree (i.e. rapidly). Furthermore, the dynamical time in this compact central region is short (Myr) so any imprint of photoevaporation with projected separation would also quickly be washed out.
6) Our results slightly change the van Terwisga
et al. 2020 interpretation of the region in a few ways. Firstly, evaporation of the depleted western population appears to be dominated by IRS 1, since the proplyds in the region are pointing towards it, and so IRS 2b is not required to play a role there. Second, the eastern population is also being actively evaporated by IRS 2b where discs are not embedded in the ISM, which may also explain why the ALMA mm continuum disc fraction is more like that of an older region (van Terwisga
et al. 2020).
7) Our evidence for external photoevaporation in the 0.2-0.5 Myr eastern region shows that this environmental influence can be in competition even with very early planet formation (Segura-Cox
et al. 2020, e.g.).
Acknowledgements
We warmly thank the anonymous referee for their insightful review. TJH is funded by a Royal Society Dorothy Hodgkin Fellowship, which also supports GB. JSK was partially supported by NASA under Agreement No. NNX15AD94G for the program “Earths in Other Solar Systems. AJW acknowledges funding from an Alexander von Humboldt Stiftung Postdoctoral Research Fellowship. ADS thanks the Science and Technology Facilities Council (STFC) for a Ph.D. studentship and CJC acknowledges support from the STFC consolidated grantST/S000623/1. This work has also been supported by the European Union’s Horizon 2020 research and innovation programme under the Marie Sklodowska-Curie grant agreement No 823823 (DUSTBUSTERS).
Support for this work for Stapelfeldt & Hines was provided by NASA through Grant Number GO-9424 from STScI, operated by the Association of Universities for Research in Astronomy Incorporated, under NASA contract NAS5-26555.
This research made use of Astropy66 6 http://www.astropy.org, a community-developed core Python package for Astronomy (Astropy Collaboration et al. 2013; Price-Whelan et al. 2018)
This work used observations made with the NASA/ESA Hubble Space Telescope. Some were obtained from the Hubble Legacy Archive, which is a collaboration between the Space Telescope Science Institute (STScI/NASA), the Space Telescope European Coordinating Facility (ST-ECF/ESA) and the Canadian Astronomy Data Centre (CADC/NRC/CSA). Some of the HST data presented in this paper was obtained from the Mikulski Archive for Space Telescopes (MAST) at https://archive.stsci.edu/hst/. STScI is operated by the Association of Universities for Research in Astronomy, Inc., under NASA contract NAS5-26555. Support for MAST for non-HST data is provided by the NASA Office of Space Science via grant NNX09AF08G and by other grants and contracts.
Herschel is an ESA space observatory with science instruments provided by European-led Principal Investigator consortia and with important participation from NASA.
DATA AVAILABILITY
The data here is all publicly available in the MAST science archive, the Hubble Legacy Archive (HLA) and the ESA Herschel Science Archive. We have made reference throughout the paper to the relevant PI’s and observations.
References
- Adams et al. (2004) Adams F. C., Hollenbach D., Laughlin G., Gorti U., 2004, ApJ, 611, 360
- Ansdell et al. (2016) Ansdell M., et al., 2016, ApJ, 828, 46
- Ansdell et al. (2017) Ansdell M., Williams J. P., Manara C. F., Miotello A., Facchini S., van der Marel N., Testi L., van Dishoeck E. F., 2017, AJ, 153, 240
- Arce et al. (2016) Arce H. G., et al., 2016, Taming the Flame: A Near-IR imaging study of the NGC 2024 (Flame Nebula) cluster, HST Proposal
- Astropy Collaboration et al. (2013) Astropy Collaboration et al., 2013, AA, 558, A33
- Bailer-Jones et al. (2018) Bailer-Jones C. A. L., Rybizki J., Fouesneau M., Mantelet G., Andrae R., 2018, AJ, 156, 58
- Bally et al. (2000) Bally J., O’Dell C. R., McCaughrean M. J., 2000, AJ, 119, 2919
- Bally et al. (2012) Bally J., Youngblood A., Ginsburg A., 2012, ApJ, 756, 137
- Barnes et al. (1989) Barnes P. J., Crutcher R. M., Bieging J. H., Storey J. W. V., Willner S. P., 1989, ApJ, 342, 883
- Bik et al. (2003) Bik A., Lenorzer A., Kaper L., Comerón F., Waters L. B. F. M., de Koter A., Hanson M. M., 2003, AA, 404, 249
- Birnstiel et al. (2012) Birnstiel T., Klahr H., Ercolano B., 2012, AA, 539, A148
- Burgh et al. (2012) Burgh E. B., France K., Snow T. P., 2012, ApJ Letters, 756, L6
- Cabrit et al. (2006) Cabrit S., Pety J., Pesenti N., Dougados C., 2006, AA, 452, 897
- Cadman et al. (2020) Cadman J., Rice K., Hall C., Haworth T. J., Biller B., 2020, MNRAS, 492, 5041
- Close & Pittard (2017) Close J. L., Pittard J. M., 2017, MNRAS, 469, 1117
- Concha-Ramírez et al. (2019a) Concha-Ramírez F., Vaher E., Portegies Zwart S., 2019a, MNRAS, 482, 732
- Concha-Ramírez et al. (2019b) Concha-Ramírez F., Wilhelm M. J. C., Portegies Zwart S., Haworth T. J., 2019b, MNRAS, 490, 5678
- Dai et al. (2015) Dai F., Facchini S., Clarke C. J., Haworth T. J., 2015, MNRAS, 449, 1996
- Eisner et al. (2018) Eisner J. A., et al., 2018, ApJ, 860, 77
- Facchini et al. (2016) Facchini S., Clarke C. J., Bisbas T. G., 2016, MNRAS, 457, 3593
- Fang et al. (2012) Fang M., et al., 2012, AA, 539, A119
- Garrison (1968) Garrison R. F., 1968, PASP, 80, 20
- Getman et al. (2014) Getman K. V., Feigelson E. D., Kuhn M. A., 2014, ApJ, 787, 109
- Graham et al. (2002) Graham M. F., Meaburn J., Garrington S. T., O’Brien T. J., Henney W. J., O’Dell C. R., 2002, ApJ, 570, 222
- Guarcello et al. (2016) Guarcello M. G., et al., 2016, arXiv e-prints, p. arXiv:1605.01773
- Haisch et al. (2000) Haisch Karl E. J., Lada E. A., Lada C. J., 2000, AJ, 120, 1396
- Haisch et al. (2001a) Haisch Karl E. J., Lada E. A., Piña R. K., Telesco C. M., Lada C. J., 2001a, AJ, 121, 1512
- Haisch et al. (2001b) Haisch Jr. K. E., Lada E. A., Lada C. J., 2001b, ApJ Letters, 553, L153
- Haworth & Clarke (2019) Haworth T. J., Clarke C. J., 2019, MNRAS, 485, 3895
- Haworth & Owen (2020) Haworth T. J., Owen J. E., 2020, MNRAS, 492, 5030
- Haworth et al. (2017) Haworth T. J., Facchini S., Clarke C. J., Cleeves L. I., 2017, MNRAS, 468, L108
- Haworth et al. (2018a) Haworth T. J., Facchini S., Clarke C. J., Mohanty S., 2018a, MNRAS, 475, 5460
- Haworth et al. (2018b) Haworth T. J., Clarke C. J., Rahman W., Winter A. J., Facchini S., 2018b, MNRAS, 481, 452
- Haworth et al. (2020) Haworth T. J., Cadman J., Meru F., Hall C., Albertini E., Forgan D., Rice K., Owen J. E., 2020, MNRAS, 494, 4130
- Henney (2002) Henney W. J., 2002, Rev. Mex. Astron. Astrofis., 38, 71
- Henney & O’Dell (1999) Henney W. J., O’Dell C. R., 1999, AJ, 118, 2350
- Henney et al. (2002) Henney W. J., O’Dell C. R., Meaburn J., Garrington S. T., Lopez J. A., 2002, ApJ, 566, 315
- Hodapp et al. (2009) Hodapp K. W., Iserlohe C., Stecklum B., Krabbe A., 2009, ApJ Letters, 701, L100
- Johnstone et al. (1998) Johnstone D., Hollenbach D., Bally J., 1998, ApJ, 499, 758
- Kandori et al. (2007) Kandori R., et al., 2007, PASJ, 59, 487
- Kim et al. (2016) Kim J. S., Clarke C. J., Fang M., Facchini S., 2016, ApJ Letters, 826, L15
- Kounkel et al. (2018) Kounkel M., et al., 2018, AJ, 156, 84
- Kruegel et al. (1982) Kruegel E., Thum C., Pankonin V., Martin-Pintado J., 1982, A&AS, 48, 345
- Kuffmeier et al. (2016) Kuffmeier M., Frostholm Mogensen T., Haugbølle T., Bizzarro M., Nordlund Å., 2016, ApJ, 826, 22
- Kuffmeier et al. (2020) Kuffmeier M., Zhao B., Caselli P., 2020, arXiv e-prints, p. arXiv:2006.00019
- Levine et al. (2006) Levine J. L., Steinhauer A., Elston R. J., Lada E. A., 2006, ApJ, 646, 1215
- Lichtenberg et al. (2019) Lichtenberg T., Golabek G. J., Burn R., Meyer M. R., Alibert Y., Gerya T. V., Mordasini C., 2019, Nature Astronomy, 3, 307
- Mann et al. (2014) Mann R. K., et al., 2014, ApJ, 784, 82
- Marcy et al. (2014) Marcy G. W., et al., 2014, ApJS, 210, 20
- Maucó et al. (2016) Maucó K., et al., 2016, ApJ, 829, 38
- McCaughrean & O’dell (1996) McCaughrean M. J., O’dell C. R., 1996, AJ, 111, 1977
- Menten et al. (2007) Menten K. M., Reid M. J., Forbrich J., Brunthaler A., 2007, AA, 474, 515
- Meyer (1996) Meyer M. R., 1996, PhD thesis, Max-Planck-Institut für Astronomie, Königstuhl 17, D-69117 Heidelberg, Germany
- Moore et al. (2020) Moore N. W. H., Li G., Adams F. C., 2020, arXiv e-prints, p. arXiv:2007.15666
- Nicholson et al. (2019) Nicholson R. B., Parker R. J., Church R. P., Davies M. B., Fearon N. M., Walton S. R. J., 2019, MNRAS, 485, 4893
- O’dell (1998) O’dell C. R., 1998, AJ, 115, 263
- O’dell & Wen (1994) O’dell C. R., Wen Z., 1994, ApJ, 436, 194
- Ormel et al. (2017) Ormel C. W., Liu B., Schoonenberg D., 2017, AA, 604, A1
- Parker (2020) Parker R. J., 2020, arXiv e-prints, p. arXiv:2007.07890
- Price-Whelan et al. (2018) Price-Whelan A. M., et al., 2018, AJ, 156, 123
- Reiter & Parker (2019) Reiter M., Parker R. J., 2019, MNRAS, 486, 4354
- Rodriguez et al. (2018) Rodriguez J. E., et al., 2018, ApJ, 859, 150
- Scally & Clarke (2001) Scally A., Clarke C., 2001, MNRAS, 325, 449
- Segura-Cox et al. (2020) Segura-Cox D. M., et al., 2020, Nature, 586, 228
- Sellek et al. (2020) Sellek A. D., Booth R. A., Clarke C. J., 2020, MNRAS, 492, 1279
- Smith et al. (2010) Smith N., Bally J., Walborn N. R., 2010, MNRAS, 405, 1153
- Stapelfeldt et al. (1997) Stapelfeldt K., Sahai R., Werner M., Trauger J., 1997, in Soderblom D., ed., Astronomical Society of the Pacific Conference Series Vol. 119, Planets Beyond the Solar System and the Next Generation of Space Missions. p. 131
- Sternberg et al. (2003) Sternberg A., Hoffmann T. L., Pauldrach A. W. A., 2003, ApJ, 599, 1333
- Störzer & Hollenbach (1999) Störzer H., Hollenbach D., 1999, ApJ, 515, 669
- Stutz et al. (2013) Stutz A. M., et al., 2013, ApJ, 767, 36
- Thompson et al. (1981) Thompson R. I., Thronson H. A. J., Campbell B. G., 1981, ApJ, 249, 622
- Vasconcelos et al. (2010) Vasconcelos M. J., Cerqueira A. H., Raga A. C., Amorim R. R., 2010, Rev. Mex. Astron. Astrofis., 46, 79
- Winter et al. (2018a) Winter A. J., Clarke C. J., Rosotti G., Ih J., Facchini S., Haworth T. J., 2018a, MNRAS, 478, 2700
- Winter et al. (2018b) Winter A. J., Booth R. A., Clarke C. J., 2018b, MNRAS, 479, 5522
- Winter et al. (2019) Winter A. J., Clarke C. J., Rosotti G. P., Hacar A., Alexander R., 2019, MNRAS, 490, 5478
- Winter et al. (2020a) Winter A. J., Kruijssen J. M. D., Chevance M., Keller B. W., Longmore S. N., 2020a, MNRAS, 491, 903
- Winter et al. (2020b) Winter A. J., Ansdell M., Haworth T. J., Kruijssen J. M. D., 2020b, MNRAS, 497, L40
- Wu et al. (2013) Wu Y. L., et al., 2013, ApJ, 774, 45
- Wu et al. (2018) Wu Y.-L., Close L. M., Kim J. S., Males J. R., Morzinski K. M., 2018, ApJ, 854, 144
- van Terwisga et al. (2020) van Terwisga S. E., et al., 2020, AA, 640, A27