Debiased-CAM to mitigate image perturbations with
faithful visual explanations of machine learningConference: CHI Conference on Human Factors in Computing Systems; April 29-May 5, 2022; New Orleans, LA, USACHI Conference on Human Factors in Computing Systems (CHI ’22), April 29-May 5, 2022, New Orleans, LA, USADOI: 10.1145/3491102.3517522ISBN: 978-1-4503-9157-3/22/049355CCS: Human-centered computing Empirical studies in HCICCS: Computing methodologies Computer visionCCS: Computing methodologies Semi-supervised learning settingsCCS: Security and privacy Privacy protections
Abstract.
Model explanations such as saliency maps can improve user trust in AI by highlighting important features for a prediction. However, these become distorted and misleading when explaining predictions of images that are subject to systematic error (bias) by perturbations and corruptions. Furthermore, the distortions persist despite model fine-tuning on images biased by different factors (blur, color temperature, day/night). We present Debiased-CAM to recover explanation faithfulness across various bias types and levels by training a multi-input, multi-task model with auxiliary tasks for explanation and bias level predictions. In simulation studies, the approach not only enhanced prediction accuracy, but also generated highly faithful explanations about these predictions as if the images were unbiased. In user studies, debiased explanations improved user task performance, perceived truthfulness and perceived helpfulness. Debiased training can provide a versatile platform for robust performance and explanation faithfulness for a wide range of applications with data biases.
Keywords:
Explainable AI, Misleading explanations, Class activation map, Robust machine learning, Image perturbations, User studies1. Introduction

Machine learning models are increasingly capable to achieve impressive performance in many prediction tasks, such as image recognition (Krizhevsky et al. 2012), medical image diagnosis (Esteva et al. 2017), captioning (Vinyals et al. 2015) and dialog systems (Das et al. 2017). Despite their superior performance, deep learning models are complex and unintelligible; this limits user trust and understanding (Lipton 2018; Miller 2019; Wang et al. 2019). This has driven the development of myriad explainable artificial intelligence (XAI) and interpretable machine learning methods (Guidotti et al. 2018; Hohman et al. 2018; Wang et al. 2019; Zhang and Zhu 2018). Saliency maps (Selvaraju et al. 2017; Simonyan and Zisserman 2015; Zhou et al. 2016) can provide intuitive explanations of Convolutional Neural Networks (CNN) for image prediction tasks by indicating which pixels or neurons were used for model inference. Amongst these, class activation map (CAM) (Zhou et al. 2016), Grad-CAM (Selvaraju et al. 2017) and extensions (Chattopadhay et al. 2018; Wang et al. 2020) are particularly useful by identifying pixels relevant to specific class labels. Users can verify the prediction correctness by checking whether expected pixels are highlighted. Models would be considered more trustworthy if their CAMs matched what users believe as salient.
Despite the fidelity of CAMs on clean images, real-world images are typically subjected to systematic error, such as image blurring, color-distortion or lighting changes, which can affect what CAMs highlight. We call this systematic error bias11 1 Note that this does not refer to social bias that is presently popularly studied in AI fairness and algorithmic bias. We are using the word as defined in engineering and physics regarding measurements. since it is directional based on a contextual factor or confound, and contrast it with noise that is based on non-directional random error. Also note that we are not referring to societal bias or discrimination (e.g., racism, sexism) (Dodge et al. 2019). Blurring can be due to accidental motion (Kupyn et al. 2018) or defocus blur (Vasiljevic et al. 2016), or deliberate obfuscation for privacy protection (Dimiccoli et al. 2018). Unlike (Zhao et al. 2021) which found explanation harms privacy, we find that privacy can harm explanation. Images may also be biased with shifted color temperature (Afifi and Brown 2019) due to mis-set white balance, or biased with daylight changes (e.g., day to night, sunrise/sunset). These biases decrease model prediction performance (Afifi and Brown 2019; Dimiccoli et al. 2018; Vasiljevic et al. 2016) and we further show that they also lead to deviated or distorted CAM explanations that are less faithful to the original scenes. For different bias types (image blur, and color temperature shift, day/night lighting), we found that CAMs deviated more as image bias increased (Fig. 1 and Fig. 3: Biased-CAMs from RegularCNN for > 0). Although Biased-CAM represents what the CNN considers important in a biased image, it is misaligned with people’s expectations (Posner et al. 2004), misleads users to irrelevant targets, and impedes human verification and trust (Du et al. 2019) of the model prediction. For example, when explaining the inference of the “Fish” label for an image prediction, Biased-CAMs select pixels of the man instead of the fish (Fig. 1).
To align with user expectations, models should not only have the right predictions but also have the right reasons (Ross et al. 2017); however, current approaches face challenges in achieving this goal, particularly for biased data. First, while fine-tuning the model on biased data can improve its performance (Dimiccoli et al. 2018; Vasiljevic et al. 2016), this does not necessarily produce explanations aligned with human’s understanding. Indeed, we found that explanations remain deviated and unfaithful (Fig. 1, FineTunedCNN Biased-CAMs). Conversely, retraining the model with attention transfer (Komodakis and Zagoruyko 2017; Li et al. 2018) only improves explanation faithfulness for clean images, but cannot handle biased images. Finally, evaluating the human interpretability of explanations requires deep inquiry into user perception, understanding and usage (Abdul et al. 2018; Alqaraawi et al. 2020; Doshi-Velez and Kim 2017), but typical evaluations of XAI involve only data simulations (Bach et al. 2015; Fong and Vedaldi 2017; Ross et al. 2017; Sundararajan et al. 2017; Zhang et al. 2018) or simple surveys (Bau et al. 2017; Chattopadhay et al. 2018; Schramowski et al. 2020; Selvaraju et al. 2017; Zhou et al. 2018).
Inspired by how people can “see through the blur” to recognize blurred images due to prior experiences with unblurred but unrelated images, we propose a debiasing approach such that models are trained to faithfully explain the event despite biased sources. Using CNNs with Grad-CAM saliency map explanations (Selvaraju et al. 2017), we developed DebiasedCNN that interprets biased images as if predicting on the unbiased form of images and produces explanations, Debiased-CAMs, that are more human-relatable and robust. The approach has a modular design: 1) it is self-supervised which does not require additional human annotation for training; 2) it produces explanations as a secondary prediction task, so that they are retraininable to be debiased; 3) it models the bias level as a tertiary task to support bias-aware predictions. The approach not only enhances prediction performance on biased data, but also produces highly faithful explanations about these predictions as if the data were unbiased (Fig. 1: DebiasedCNN CAMs).
To evaluate the developed model, we conducted simulation and user studies to address the research questions on 1) how bias decreases explanation faithfulness and how well debiasing mitigates this, and 2) how sensitive people are to perceiving explanation deviations and how well debiasing improves perceived explanation truthfulness and helpfulness. For generality, the simulation studies spanned different image prediction tasks object recognition, activity recognition with egocentric cameras, image captioning, and scene understanding), bias types (blur, color shift, and night vision interpolation) and various datasets. Across all studies, we found that while increasing bias led to poorer prediction performance and worse explanation deviation, Debiased-CAM showed the best improvement in task performance as well as explanation faithfulness. Instead of trading off task performance for explanation faithfulness, our debiasing training improved both. We further demonstrated the usability and usefulness of Debiased-CAMs in two controlled user studies. Quantitative statistical and qualitative thematic analyses validated that users can perceive the improved truthfulness and helpfulness of Debiased-CAMs on biased images. In summary, this paper made the following contributions:
- (1)
Assessed the deviations in model explanations due to bias in data across different bias types and levels.
- (2)
Proposed a technical approach to accurately predict and faithfully explain inferences under data bias.
- (3)
Validated the improvements in perceived truthfulness and helpfulness of debiased explanations.
2. Related Work
We review explainable AI methods for image predictions, how images get biased, how misleading explanations harm user experience and performance, and methods to improve explanation faithfulness.
2.1. Explainable AI for visual CNN models
Many explainable AI (XAI) techniques have been proposed to understand the predictions of CNNs. These include saliency maps (Chattopadhay et al. 2018; Ramaswamy et al. 2020; Selvaraju et al. 2017; Simonyan et al. 2014; Zhou et al. 2016), feature visualization (Bau et al. 2017; Hohman et al. 2019; Olah et al. 2017), neuron activations (Kahng et al. 2017) and concept variables (Kim et al. 2018; Koh et al. 2020). Saliency maps are intuitive to interpret deep CNN models, where important pixels are highlighted to indicate their importance towards the model prediction. Computing the prediction gradient (Simonyan et al. 2014; Sundararajan et al. 2017; Zeiler and Fergus 2014) can identify sensitive pixels. Another approach divides prediction outcome across features by Taylor series approximation (Bach et al. 2015) or Shapley values (Lundberg and Lee 2017). Specific to CNNs, coarser saliency maps can be generated by aggregating activation maps as a weighted sum across convolutional kernels (Chattopadhay et al. 2018; Ramaswamy et al. 2020; Selvaraju et al. 2017; Wang et al. 2020; Zhou et al. 2016). For this work, we evaluated Grad-CAM (Selvaraju et al. 2017) to test if users can perceive truthful, biased, or debiased explanations, and expect our findings to be generalizable.
2.2. Systematic error and corruptions in images
Although many models are trained on clean curated images, real-world images are subject to systematic errors (biases), perturbations and corruptions. Contextual or incidental biases include blurring, color distortions, or lighting changes. Blurring may be due to accidental motion blur (Kupyn et al. 2018), defocus blur (Vasiljevic et al. 2016) or deliberate obfuscation for privacy protection (Dimiccoli et al. 2018). Image color shift (Afifi and Brown 2019) may be due to mis-set white balance. These biases can degrade model performance (Afifi and Brown 2019; Dimiccoli et al. 2018; Vasiljevic et al. 2016), and limit their usefulness in real-world applications. Images of outdoor scenes regularly change by time of day and seasons due to sunlight or weather changes (Laffont et al. 2014). Images can also be corrupted due to data processing, such as JPEG compression artifacts, Gaussian noise, brightness or contrast levels (Hendrycks and Dietterich 2019). Mitigation strategies to handle such data errors include model fine-tuning with images at known blurred levels (Dimiccoli et al. 2018), or data augmentation with images blurred at multiple levels (Vasiljevic et al. 2016). However, these approaches only aimed to improve prediction performance and not explanation faithfulness. In this work, we found that explanations remain deviated and we propose methods to debias them.
Such data errors are related to the problem of model robustness, where small changes to data should not cause large changes in model behavior. This is an active area of research (Zheng et al. 2016; Hendrycks and Dietterich 2019; Hendrycks et al. 2020), but methods typically focus on improving performance by increasing decision boundary smoothness. In this work, we aim to make explanations more robust. Recent work by Dombrowski et al. (Dombrowski et al. 2022) improved explanation robustness by similarly increasing decision smoothness relative to explanations, but this assumes clean data, and learns average explanations under bias. Instead, we debias explanations away from deviations due to biased data. Also, other than focusing on explanation robustness or stability towards the impression of global trustworthiness, we focus on faithful explanations that are verifiable per instance.
2.3. Risk of misleading model explanations
User studies of model explanations aim to show that explanations can improve user understanding and trust (Lim et al. 2009; Kizilcec 2016; Nourani et al. 2019; Zhang et al. 2020a; Wang and Yin 2021). These tend to study scenarios of correct model predictions and ideal explanations, but models can make prediction errors or may not be confident in their decisions. Studies have explored how this may lead to distrust, mistrust and over-trust (Lim and Dey 2011; Yin et al. 2019; Poursabzi-Sangdeh et al. 2021). For such cases, explanations can be avoided when there is a high chance of model error. However, explanations can still be wrong despite the model predicting correctly. For example, explanations may highlight spurious pixels (Zhang et al. 2020b), be adversarially manipulated (Dombrowski et al. 2019; Ghorbani et al. 2019), or subject to input error (Wang et al. 2021). These cases are harder to detect, pose a serious risk to decrease user trust (De-Arteaga et al. 2020; Lakkaraju and Bastani 2020), or mislead users (Lakkaraju and Bastani 2020). Unlike works that explore how different explanation formats affect trust (Yang et al. 2020), we investigate how slight data variations affect user performance and trust. Since data bias and corruption are prevalent in the real-world, it is tantamount to identify the severity of the problem and mitigate it with more robust explanations (Hancox-Li 2020). In this work, we quantify the extent of explanation deviation due to data bias, and evaluated how sensitive users are to these deviations.
2.4. Attention transfer to correct explanations
While explanation techniques are primarily designed to improve human understanding of model behavior, they can be used to guide model training. One approach is to use transfer learning to regularize attention from a better model to the model under training, such as with student-teacher networks (Komodakis and Zagoruyko 2017). Another approach indirectly trains attention by ablating salient pixels from input images and maximizing the classification loss between the ablated and original images (Li et al. 2018). However, these approaches only train on clean data and will reinforce biased explanations if trained on obfuscated or biased data. Unlike conventional self-supervised learning with data augmentation and contrastive learning to improve feature learning (Chen et al. 2020), we use the unbiased explanation as a surrogate "label" to train the debiased model to predict a more faithful explanation.
3. Technical Approach

We first describe baseline RegularCNN and FineTunedCNN approaches to predict on unbiased and biased image data, then our proposed DebiasedCNN architectures to predict on biased image data with debiased explanations.
3.1. Regular and Fine-tuned Models
A regularly trained CNN model (RegularCNN) can generate a truthful CAM (Unbiased-CAM) of an unbiased image , but will produce a deviated CAM (Biased-CAM) for the image under bias , i.e., , due to the model not training on any biased images and learning spurious correlations with blurred pixels. A fine-tuned model trained on biased images can improve the prediction performance on biased images, but will still generate a deviated CAM (Fig. 1a and Fig. 3a-c: CAMs of FineTunedCNN), as it was only trained with the classification loss and not explanation loss. While these models can be explained with Grad-CAM, they are not retrainable to improve their CAM faithfulness.
3.2. DebiasedCNN Model with Debiased-CAM Explanations
3.2.1. Trainable CAM as secondary prediction task
We enable CAM retraining by redefining Grad-CAM as a prediction task. Grad-CAM (Selvaraju et al. 2017) computes a saliency map explanation of an image prediction with regards to class as the weighted sum of activation maps in the final convolutional layer of a CNN. Each activation map indicates the activation for each grid cell of the th convolution filter (set of all filters). The importance weight for the th activation map is calculated by back-propagating gradients from the output to the convolution filter, i.e.,
| (1) |
where and are the height and width of activation maps, respectively; is a one-hot vector indicating only the probability of class ; is the global average pooling operation. The class activation map (CAM) is the weighted combination of activation maps, followed by a ReLU transform to only show positive activations for class , i.e.,
| (2) |
which we rewrite as a matrix multiplication of all importance weights and the transpose of activation maps along the th axis, i.e., .
Therefore, the CAM prediction task can be redefined as three non-trainable layers (computational graph) in the neural network (orange in Fig. 2a) to compute , , and . By reformulating Grad-CAM as a secondary prediction task, we can train the model with faithful CAM based on differentiable CAM loss by backpropagating through this task. This task takes as the second input to the CNN architecture to specify the target class label for the CAM. is set as the ground truth class label at training time, and chosen by the user at run time. We call the aforementioned approach Multi-Task DebiasedCNN, and call the conventional use of Grad-CAM as Single-Task DebiasedCNN. For single-task DebiasedCNN, the loss is added as a simple sum to the primary classification task, rather than predicted with secondary task. This will limit its learning since weights are not updated with gradient descent.
3.2.2. Training CAM debiasing with Self-Supervised Learning
To debias CAMs of biased images toward truthful Unbiased-CAMs of clean images , i.e., , we train DebiasedCNN with self-supervised learning to transfer knowledge of corresponding unbiased images in RegularCNN into DebiasedCNN. We aim to minimize the difference between Unbiased-CAM and Debiased-CAM . The training involves the following steps (see Fig. 2c): 1) Given a dataset with clean images and labels , apply a bias transformation (e.g., blur) to create biased variants of each image . 2) Train a RegularCNN to predict label on clean image . We assume that its Grad-CAM explanations are correct and serve as a good oracle for Unbiased-CAMs. 3) Train a DebiasedCNN to predict label on corresponding biased image , and explain with CAM . DebiasedCNN is trained with loss function:
| (3) |
where is the classification loss, is the CAM loss, and is a hyperparameter. The training can be interpreted as attention transfer from an unbiased model to the new model. DebiasedCNN can be generalized to image prediction other tasks (e.g., image captioning: Fig. 3b), other bias types (e.g., color temperature, lighting: Fig. 3c,d), different base CNN models (e.g., VGG16, Inception v3, ResNet50, Xception), and for privacy-preserving machine learning.
3.2.3. Bias-agnostic, Multi-bias predictions with tertiary task
Image biasing can happen sporadically at run time, so the image bias level may be unknown at training time. Instead of training on specific bias levels (Dimiccoli et al. 2018) or fine-tuning with data augmentation on multiple bias levels (Vasiljevic et al. 2016), we added a tertiary prediction task — bias level regression — to DebiasedCNN to leverage supervised learning (Fig. 2a: salmon-colored layers). This enables DebiasedCNN to be bias-aware (can predict bias level) and bias-agnostic (predict under any bias level). With the bias level prediction task, the training loss function for multi-bias, multi-task DebiasedCNN is:
| (4) |
where is the bias prediction loss, and is a hyperparameter.
3.2.4. Training loss terms
In all, there are three loss terms: primary task loss as cross-entropy loss for standard classification tasks, and as the sum of negative log likelihood for each word (Vinyals et al. 2015) in image captioning tasks; bias level loss as the mean squared error (MSE), common for regression tasks; CAM loss as the mean squared error (MSE), since CAM prediction can be considered a 2D regression task, and this is common for visual attention tasks (Komodakis and Zagoruyko 2017).
3.2.5. Summary of DebiasedCNN Model Variants
DebiasedCNN has a modular design: 1) single-task (st) or multi-task (mt) to improve model training; and 2) single-bias (sb) or multi-bias (mb) to support bias-aware and bias-agnostic predictions. We denote the four DebiasedCNN variants as (sb, st), (mb, st), (sb, mt), (mb, mt), and conducted ablation studies to compare between them. Supplementary Fig. 1 and Supplementary Table 2 show details of each variant.
4. Simulation Studies
To evaluate how much CAMs deviate with biased images and how well DebiasedCNN recovers CAM Faithfulness, we conducted five simulation studies with varying datasets, prediction tasks (classification, captioning), bias types (blur, color temperature, day/night lighting), and bias levels. These studies inform which applications explanation biasing is problematic, and show that our debiased training can successfully mitigate these deviations.
4.1. Evaluation Metrics
We evaluated prediction performance and CAM explanation faithfulness to compare model variants. For classification, we measured the area under the precision-recall curve (PR AUC) as it is robust against imbalanced data (Saito and Rehmsmeier 2015), and calculated the class-weighted macro average to aggregate across multiple classes. For image captioning, we calculated the BLEU-4 (Papineni et al. 2002) score that measures how closely 4-grams in the predicted and actual captions matched. For bias level regression, we calculated accuracy with . We define the correctness of CAM explanations by their similarity or faithfulness to the original Unbiased-CAMs from RegularCNN that infers on unbiased data. To better compare CAMs beyond simple residual differences (e.g., MAE, MSE), we calculated CAM Faithfulness as the Pearson’s Correlation Coefficient (PCC) (Li et al. 2015; Bylinskii et al. 2018) of pixel-wise saliency as it closely matches the human perception to favor compact locations and match the number of salient locations (Li et al. 2015), and it fairly weights between false positive and false negatives (Bylinskii et al. 2018).
4.2. Results

In general, CAMs deviate more from Unbiased-CAMs as bias levels increased, but DebiasedCNN reduces this deviation. Debiased retraining also improved model prediction performance, which suggests that DebiasedCNN indeed "sees through the bias". Fig. 4 shows our evaluation Task Performance and CAM Faithfulness in ablation studies across increasing bias levels for different prediction tasks and datasets (Supplementary Table 1). Fig. 3 shows some examples of deviated and debiased CAMs. Next, we describe the experiment method and results for each simulation study.
4.2.1. Simulation Study 1 (Blur Bias)
We evaluated CAMs for blur biased images of the object recognition dataset ImageNette (Howard [n.d.]). We scaled images to a standardized maximum size of 1000×1000 pixels and applied uniform Gaussian blur at various standard deviations . We found that Task Performance and CAM Faithfulness decreased with increasing blur level for all CNNs, but DebiasedCNN mitigated these decreases (Fig. 4a). This indicates that model training with additional CAM loss improved model performance rather than trading-off explainability for performance (Rudin 2019). RegularCNN had the worst Task Performance and the lowest CAM Faithfulness for all blur levels (). In comparison, trained with differentiable CAM loss, DebiasedCNN (sb, mt) showed marked improvements to both metrics, up to 2.33x and 6.03x over FineTunedCNN’s improvements, respectively. Trained with non-differentiable CAM loss, DebiasedCNN (sb, st) improved both metrics to a lesser extent than DebiasedCNN (sb, mt), confirming that separating the CAM task from the classification task enabled better weights update . Trained with an additional bias-level task, multi-bias DebiasedCNN (mb, mt) achieved high Task Performance and CAM Faithfulness for all bias levels that is only marginally lower than single-bias DebiasedCNN (sb, mt), because of the former’s good regression performance for bias level prediction (Supplementary Fig. 4).
4.2.2. Simulation Study 2 (Blur Bias, Egocentric)
We evaluated the impact of blur biasing with a more ecologically realistic task — wearable camera activity recognition (NTCIR-12 (Gurrin et al. 2016)). This task22 2 Note that we mean that the use case could have blurred images, not that the NTCIR-12 dataset has blurred images. Blurring or biasing ImageNet photos (which may include curated stock photos) is an unrealistic use case, but there are more ecologically legitimate reasons for egocentric photos to be biased. represents a real-world use case where egocentric cameras may capture blurred images accidentally due to motion or defocus, or deliberately for privacy protection. We found the same trends as for the ImageNette classification task with some differences due to the increased task difficulty (Fig. 4b). In particular, the differences between RegularCNN and DebiasedCNN in Task Performance and CAM Faithfulness were amplified, indicating that debiasing is more useful for this application. Task Performance and CAM Faithfulness decreased steeply for RegularCNN with increasing blur bias, while DebiasedCNN significantly recovered both metrics, demonstrating marginal decreases with increasing bias. FineTunedCNN marginally increased CAM Faithfulness from RegularCNN (), while DebiasedCNN achieved a much larger improvement by up to 229%. We verified these trends for different CNN backbones and found that more accurate models produced more faithful CAMs even for stronger blur (Supplementary Figs. 5 and 6). Hence, Debiased-CAM enables privacy-preserving wearable camera activity recognition with improved performance and faithful explanations.
4.2.3. Simulation Study 3 (Blur Bias Captioning)
We evaluated the influence of blur on a different prediction task — image captioning (COCO (Chen et al. 2015)). We found similar trends in Task Performance and CAM Faithfulness as before, though all models performed poorly at all blur levels (Fig. 4c). Furthermore, CAM Faithfulness was low for all models, even for RegularCNN at a small blur bias (). This could be because captioning is much harder than classification, and CAM retraining is weakened by vanishing gradients due to the long LSTM recurrence. Yet, DebiasedCNN improved CAM Faithfulness for all blur levels by up to 224% from RegularCNN.
4.2.4. Simulation Study 4 (Color Temperature Biased)
We evaluated color temperature bias on wearable camera images in NTCIR-12. This represents another realistic problem for the wearable camera use case, where the white balance may be miscalibrated. We set the neutral color temperature to 6600K (cloudy/overcast) and perturbed the color temperature bias by applying Charity’s color mapping function to map a temperature to RGB values (Charity [n.d.]). Color temperature can be bidirectionally biased towards warmer (more orange, lower values) or cooler (more blue, higher values) temperatures from neutral 6600K. Furthermore, image pixel values deviate asymmetrically with larger deviations for orange than for blue biases. Consequently, we found that orange bias led to a larger decrease in Task Performance and CAM Faithfulness than blue bias (Fig. 4d). Notably, CAM deviation was smaller across all color temperature biases than for blur biases, as indicated by the smaller decrease in CAM Faithfulness (compare Fig. 4b, d); hence, Task Performance also did not decrease as much as blur bias. FineTunedCNN had similar Task Performance but lower CAM Faithfulness than RegularCNN; this suggests that color-biased images were too similar to improve model training with classification fine-tuning, and yet this significantly degraded explanation quality. In contrast, DebiasedCNN improved Task Performance and CAM Faithfulness compared to RegularCNN. Furthermore, due to bidirectional bias, multi-bias training enabled DebiasedCNN (mb, mt) to have significantly higher Task Performance even for unbiased images ().
4.2.5. Simulation Study 5 (Lighting Bias)
We evaluated lighting bias for outdoor scenes for a multi-label scene attribute recognition task (transient attribute database, TransAttr (Laffont et al. 2014)). Lighting in outdoor scenes regularly change across hours or seasons due to transient attributes, such as sunlight or weather changes. Hence, models trained on images captured in one lighting condition may predict and explain differently under other conditions. Specifically, for the multi-label prediction task of classifying whether a scene is Snowy, Sunny, Foggy, or Dawn/Dusk, we biased whether the scene was daytime or nighttime. We performed a pixel-wise interpolation with ratio to simulate interstitial periods between day and night (details in Appendix B.1.2). We found similar trends in Task Performance and CAM Faithfulness as with previous blur-biased classification tasks. The image prediction training was biased towards day-time photos, and as photos became darker to represent dusk or night time, all models generated more deviated, but least so for DebiasedCNN. Given the regularity and frequency of outdoor scenes changes, this study demonstrates the prevalence of biasing in model predictions and explanations, and emphasizes the need for Debiased-CAMs.
5. User Studies
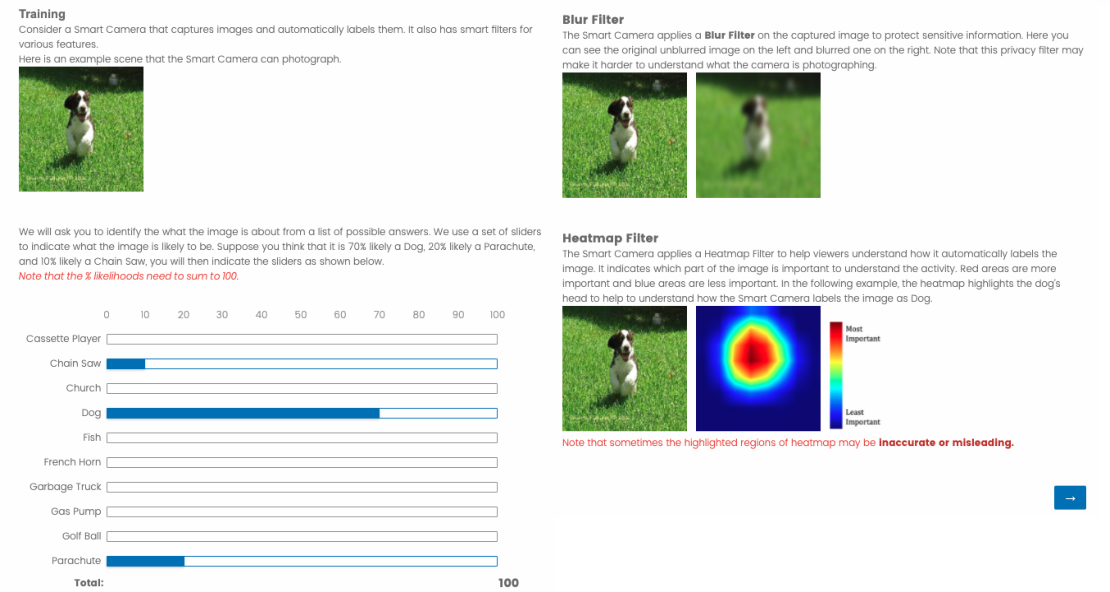
Having found that DebiasedCNN improves CAM faithfulness, we next evaluated how well Debiased-CAM improves human interpretability over Biased-CAM. We conducted user studies to evaluate their perceived truthfulness (User Study 1) and helpfulness (User Study 2) in an AI verification task for a hypothetical smart camera with privacy blur filters, label predictions and CAM explanations, i.e., the Simulation Study 1 prediction task. Both studies had a 33 factorial design with two independent variables — Blur Bias level (None , Weak , Strong ) and CAM type (Unbiased, Debiased, and Biased). Unbiased-CAM is the CAM from RegularCNN predicting on the unbiased image regardless of blur bias level; Debiased-CAM is the CAM from DebiasedCNN (mb, mt) and Biased-CAM is the CAM from RegularCNN predicting on the biased image at corresponding Blur Bias levels. At the None blur level, Biased-CAM is identical to Unbiased-CAM. The user studies were approved by our university Institutional Review Board.
5.1. User Study 1 (CAM Truthfulness)
The first study evaluated the perceived truthfulness of Unbiased, Debiased, and Biased CAMs.
5.1.1. Experiment Procedure
Participants: 1) read the introduction and gave consent; 2) studied a tutorial about automatic image labeling, privacy blurring, heatmap explanations, and how to interpret the survey questions; 3) answered four screening questions to test their labeling of an unblurred and a weakly blurred image and their selection of important locations in an image and a CAM; 4) if screening was passed (all correct answers), answered background questions on technology savviness and image comprehension, performed the main study with 10 trials; and ended with demographic questions. See Supplementary Figs. 11-13 for questionnaire details.
In the main study (Fig. 5a), each participant viewed 10 repeated image trials, where each trial was randomly assigned to one of the three Blur Bias levels (within-subjects). All participants viewed the same 10 images (selection criteria described in Appendix C.1) in random order. For each trial, the participant: viewed a labeled unblurred image, indicated the most important locations on the image regarding the label with a “grid selection” UI (q1); and in the next page, viewed the blurred image, viewed CAMs of all 3 types generated from that and arranged randomly side-by-side, rated how well each CAM represented the image label on a 10-star scale (q2), and wrote her rating rationale (q3).

5.1.2. Experiment Apparatus and Measures
We used a “grid selection” user interface (UI) to measure objective truthfulness (Fig. 5b) to mitigate poor estimation of perceptions (Angel and Gronfein 1988; Avrahami et al. 2007; Goldstein and Rothschild 2014). It overlays a clickable grid on the image for selecting important cells regarding the label. For usability, we limited the grid to 5×5 cells that can be selected or unselected (binary values). In the surveys, we referred to CAMs as “heatmaps”, which is a more familiar term. To compare the participant’s grid selection (User-CAM) with the heatmap shown (CAM), we aggregated CAM by averaging the pixel saliency in each cell and calculated CAM Truthfulness Selection Similarity as the Pearson’s Correlation Coefficient (PCC) between User-CAM and CAM. We also measured the CAM Truthfulness Rating as a subjective, self-reported rating on a uni-polar 10-point star scale (1 to 10). We collected the rationale of ratings as open-ended text. We measured the task time (per trial) as Task Time Level as low (33 percentile), high (66), medium, to account for response thoughtfulness. We tracked the Image Label of each image, since some types are easier to recognize even if blurred.
5.1.3. Participants
We recruited 36 participants from Amazon Mechanical Turk (AMT) with high qualification ( completed HITs with >97% approval rate). 32 participants passed screening, and completed the survey in a median time of 15.9 minutes and were compensated US$2.00. They were 41.7% female and 23-69 years old (Median = 35).
5.1.4. Statistical Analysis and Quantitative Results
For all dependent variables, we fit a multivariate linear mixed effects model with Blur Bias Level, CAM Types, Image Label and Task Time Level as fixed effects, Blur Bias Level × CAM Type, Image Label × Blur Bias Level, Image Label × CAM Type, Task Time Level × Blur Bias Level and Task Time Level × CAM Type as fixed interaction effects, and Participant as a random effect.
Supplementary Table 3 reports the model fit () and significance of ANOVA tests for each fixed effect. Due to the large number of comparisons in our analysis, we consider differences with as significant. This is sufficiently strict for a Bonferroni correction for 50 comparisons ( = .05/50). Furthermore, all results reported were significant at , unless otherwise stated. We performed post-hoc contrast tests for specific differences described. All statistical analyses were performed using JMP (v14.1.0).
Fig. 6 summarizes our results. Unbiased-CAM had the highest CAM Truthfulness Selection Similarity, while Biased-CAM the lowest Similarity that was only 21.3-43.7% of the truthfulness of Unbiased-CAM. Debiased-CAM had significantly higher CAM Truthfulness Selection Similarity than Biased-CAM at 69.4-79.0% of the truthfulness of Unbiased-CAM. Similarly, for blurred images, participants rated Unbiased-CAM as the most truthful (M = 7.83 out of 10, standard error = 0.12), followed by Debiased-CAM (M = 6.00 to 7.21 ), and Biased-CAM as the least truthful (M = 3.05 to 4.98 ). In summary, Debiased-CAM improved CAM truthfulness, despite stronger blur that reduced CAM truthfulness by highlighting wrong or unexpected regions, sizes, and shapes.
5.1.5. Thematic Analysis and Qualitative Findings
We analyzed the rationale of participant ratings to better understand how participants interpreted different CAMs as truthful or untruthful, and what visual features they perceived in images and CAMs. We performed a thematic analysis with open coding (Muller and Kogan 2010). Two authors independently coded the rationales and discussed the coding until themes converged. Next, we first describe rationales for different blur levels, then describe themes spanning all blur levels. Note that all CAM types were shown anonymously (labeled A, B, and C) with randomly orders; we quote them specifically by type for clarity.
For None blur, as expected, most participants perceived CAMs as identical, e.g., “all 3 images are the same and mostly representative” (Participant P23, “Fish” image); though some participants could perceive the slight decrease in the CAM truthfulness of Debiased-CAM, e.g., for the “Church” image, P1 wrote that Unbiased-CAM and Biased-CAM “had the most focus on *all* the crosses on the roof of the church and therefore I thought they were the most representative. [Debiased-CAM] gives less importance to the leftmost cross on the roof and therefore was rated lower.” For Weak blur, participants felt Unbiased-CAM was very truthful, Debiased-CAM was slightly less truthful, and Biased-CAM was untruthful; e.g., P29 felt that Biased-CAM “doesn’t show anything but blackness, [other CAMs] are much better in the way the heatmap shows details.” For Strong blur, participants perceived Debiased-CAM as moderately truthful, but Biased-CAM as very untruthful, e.g., P18 felt that “[Biased-CAM] is totally off, nothing there is a garbage truck. [Unbiased-CAM] shows the best and biggest area, and [Debiased-CAM] is good too but I’m thinking not good enough as [Unbiased-CAM].”
Across blur conditions, we found that participants interpreted whether a CAM was truthful based on several criteria — primary object, object parts, irrelevant object, coverage span, and shape. Participants checked whether the primary object in the label was highlighted (e.g., “That heatmap that focuses on the chainsaw itself is the most representative.” P20, Chain Saw), and also checked whether specific parts of the primary object were included in the highlights (e.g., “[Unbiased-CAM and Debiased-CAM] correctly identify the fish though [Unbiased-CAM] also gives importance to the fish’s rear fin.” P1, Fish, Weak blur). P15 noted differences between the CAMs for the “French Horn” image: “[Unbiased-CAM] places the emphasis over the unique body of the French horn, and it places more well-defined, yellow and green emphasis on the mouthpiece and the opening of the horn itself. [Biased-CAM] is too vertical to completely capture the whole horn, and [Debiased-CAM]’s red area is too small to capture the body of the horn, and does not capture the opening of the horn or the mouthpiece.” Participants rated a CAM as less truthful if it highlighted irrelevant objects, e.g., “[Debiased-CAM] is quite close to capturing the entire church. (But) [Unbiased-CAM] captures more of the tree.” (P26, Church). Much discussion also focused on the coverage of salient pixels. Less truthful CAMs had coverages that were either too wide (e.g., “[Debiased and Biased CAMs] are inaccurate. They are too wide.” P22, Garbage Truck), covering the background or other objects to get “less representative when it misleads you into the background or surroundings of the focus. It needs to only emphasize the critical area.” (P23, Church); or too narrow, not covering enough of the key object such that it “is very small and does not highlight the important part of the image. It is too narrow.” (P30, Fish). Finally, participants appreciated CAMs that highlighted the correct shape of the primary object, e.g., “[Debiased-CAM] perfectly captures the shape of the ball and all of its quadrants. [Unbiased-CAM] is a little more oblong than the golf ball itself, so it’s not as perfect. [Biased-CAM] is almost a vertical red spot and does not really capture the shape of the golf ball at all.” (P15, Golf Ball).
In summary, we found that Debiased-CAM and Unbiased-CAM were perceived as truthful, because they: 1) highlighted semantically relevant targets while avoiding irrelevant ones, so concept or object-aware CNN models are important (Bau et al. 2017; Kim et al. 2018); 2) had salient regions that were neither too wide nor narrow for the image domain; and 3) had accurate shape and edge boundaries for salient regions, which can be obtained from gradient explanations (Rudin 2019).
5.2. User Study 2 (CAM Helpfulness)
The second study evaluated the perceived helpfulness of each CAM type to verify predictions of blur biased images.

5.2.1. Experiment Procedure
The procedure is the same as User Study 1, except for the main study section. User Study 1 focused on CAM Truthfulness to obtain the participant’s saliency annotation of the unblurred image before revealing CAMs. In User Study 2, showing the unblurred image first will invalidate the use case of verifying predictions on blurred images, since the participant would have foreknowledge of the image. Hence, participants needed to see the blurred image and model prediction first, answer perception questions, then see the image unblurred.
In the main study (Fig. 7a), each participant viewed 7 repeated image trials, each randomly assigned to one of 9 conditions (3 Blur Bias levels × 3 CAM types) in a within-subjects experiment design. Participants viewed 7 randomly chosen images from the same 10 images of User Study 1, instead of all 10, so that they could not easily conclude the class label for the remaining images by eliminating previous classes. For each trial, the participant performed the common explainable AI task to verify the label prediction of the model. On the first page, the participant viewed a labeled image at the assigned Blur Bias level with corresponding CAM for the assigned CAM type, indicated her likelihood choice(s) for the image label with the “balls and bins” question (Goldstein and Rothschild 2014) to elicit user labeling (Fig. 7b) (q1); rated how well each CAM represented the image label (q2); rated how helpful the CAM was for verifying the label (q3), and wrote the rationale for her rating (q4). On the next page, participants saw the image unblurred and answered questions q2-4 again as questions q5-7. See Supplementary Fig. 14 for questionnaire details.
5.2.2. Experiment Apparatus and Measures
For q1, we asked the participant to indicate likelihoods of 10 possible image labels with the “balls and bins” question (Goldstein and Rothschild 2014; Sharpe et al. 2000; Delavande and Rohwedder 2008) to elicit her probability distribution over label classes . This question is reliable in eliciting probabilities from lay users (Goldstein and Rothschild 2014; Sharpe et al. 2000) and avoids priming participants with the actual label , since it asks about all labels. We calculated the participant’s selected label as the class with the highest probability, i.e., , Labeling Confidence as the indicated likelihood for the actual label , and Label Correctness as , where is the Iverson bracket notation. We measured the perceived CAM Helpfulness and CAM Truthfulness Ratings on a bipolar 7-point Likert scale (–3 = Strongly Disagree, +3 = Strongly Agree). We collected rating rationale as open-ended text. We used different formats for CAM Truthfulness and CAM Helpfulness to mitigate repetitive or copied responses and to allow for a more precise measurement of CAM Truthfulness. We also measured Task Time Level and Image Label per trial.
5.2.3. Participants
We recruited 191 new participants from AMT with the same qualification criteria as User Study 1. 162 participants passed screening, completed the survey in a median time of 18.4 minutes and were compensated US$2.00. They were 46.0% female and between 21 and 74 years old (Median = 37). We excluded 7 participants who gave wrong labels for >60% of encountered unblurred images, which indicated the participant’s poor recognition ability.
5.2.4. Statistical Analysis and Quantitative Results
For each dependent variable, we fit a multivariate linear mixed effects model with the same fixed, interaction, and random effects as in User Study 1. We further analyzed CAM Truthfulness and Helpfulness ratings with fixed main and interaction effects regarding whether users rated before or after seeing the unblurred version of the image, i.e., Unblurred Disclosure: preconceived or consequent. Supplementary Table 4 reports the model fit () and ANOVA tests for each fixed effect, and report significant results similarly to User Study 1.
Fig. 8 summarizes our results from 1,085 trials of 155 included participants. Differences in decision quality (Labeling Correctness and Labeling Confidence) across CAM types depended on blur bias level. For None blur, the decision quality was high for all CAM types (confidence M = 95.6% , correctness M = 99.0% ) due to the ease of the tasks, while for Strong blur, the decision quality was low for all CAM types (confidence M = 68.5%, correctness M = 79.9%), suggesting that blurring was too strong even for truthful CAMs to be useful. However, for Weak blur, Debiased-CAM reduced labeling error by 1.92x (1 – Correctness: from 18.2% to 9.5% ) and improved confidence from 75.4% to 82.8% compared to Biased-CAM. We found stronger differences in preconceived ratings of CAM types. For Weak blur, participants rated Debiased-CAM as more truthful (M = 7.7 vs. 5.6 out of 10) and more helpful (M = 1.56 vs. 0.15 on a 7-point Likert scale from –3 to 3) than Biased-CAM. Moreover, for Strong blur, although their decision quality did not improve, participants perceived Debiased-CAM as more truthful (M = 6.4 vs. 4.4 ) and helpful (M = 0.60 vs. –0.49 ) than Biased-CAM. These effects were similar and slightly amplified for consequent ratings (Fig. 8), indicating that users more strongly appreciated Debiased-CAM and disliked Biased-CAM if they had foreknowledge of the unblurred scenes. In summary, Debiased-CAM recovered the usefulness of CAMs for moderately blurred images, and were perceived as helpful even for strong blur.
5.2.5. Thematic Analysis and Qualitative Findings
To understand why participants rated CAMs as helpful or unhelpful, we performed a thematic analysis on rationales, similarly to User Study 1. Rationale depended much on image Blur Bias level, and we identified how truthful and helpful debiased CAMs were even for blurred images.
For unblurred images (None blur level), participants mostly felt that CAMs were helpful, because CAMs helped to: 1) focus their attention “on the most important part of the image, which helps me to quickly identify and label the image.” (Participant P106, Garbage Truck); 2) ignore irrelevant targets to “let me know I can disregard the person in the foreground” (P89, Dog), “It helps hone in on what the content is, and helps to ignore the extra things in the frame.” (P14, Chain Saw); 3) matched their expectations since CAMs “did a solid job of identifying the garbage truck.” (P36) and was “highly correlated to where the fish is in this image.” (P38). Conversely, as expected, many participants considered CAMs unhelpful since “I could easily identify the object in the image without the heatmap” (P32, Church).
For images with Weak blur, a truthful CAM: 4) “helps focus my attention to that area on the blurry picture” (P105, Debiased-CAM), “clearly give hint on what was needed to notice in the photo” (P140, Unbiased-CAM); and 5) helped to confirm image labels, e.g., P3 felt that “the heatmap gives me the idea that the object might be a fish, I could not tell otherwise” and wrote after seeing the unblurred image that “I wouldn’t have known what the object was without the heatmap.” P118 described how Unbiased-CAM “pointed to the steeple and it helped me realize that it was indeed a picture of a church. I had trouble recognizing it on my own.” Debiased-CAMs helped to locate suspected objects in unexpected images, e.g., P96 felt that “based on what the heatmap is marking, that’s the exact spot where someone would hold a french horn”, and P67 noted “that is not an area where I would expect to find a fish, so it’s helpful to have this guide.”
For images with Strong blur, many participants felt that the CAMs were very unhelpful, because 6) the task was too difficult such that they had “NO idea what image is and heatmap doesn’t help.” (P68, Biased-CAM), felt the task “was very hard, i could not figure it out” (P71, Debiased-CAM), did not have much initial trust as “I feel that the heatmap could be wrong because of the clarity of the image.” (P62, Unbiased-CAM). Some participants would 7) blindly trust the CAM due to a lack of other information such that “without the heatmap and the suggestion, I would have no guess for what this is. I am flying a bit blind. So, I concur with the recommendation (french horn) until I see more.” (P92, Unbiased-CAM) and due to the trustful expectation that CAM “enables me to know the most useful part in the camera.” (P138, Church, Unbiased-CAM). Finally, we found that 8) confirmation bias may cause the CAM correctness to be misjudged. For example, P76 first thought a misleading Biased-CAM “helps make a blurry picture more clear”, but later realized “it’s in the wrong spot.” (“Garbage Truck”); in contrast, P24 wrongly accused that an Unbiased-CAM “was focused on the wrong thing”, but changed his opinion after seeing the unblurred image, admitting “Now that I see it’s a dog, it is more clear.”
In summary, these findings explain why truthful Debiased-CAM and Unbiased-CAM helped participants to verify classifications of unblurred or weakly blurred images. For unblurred images, these CAMs: 1) focused user attention to relevant objects to speed up verification, 2) averted attention from irrelevant targets to simplify decision making, and 3) matched user expectations (Ross et al. 2017) of the target object shapes. For weakly blurred images, these CAMs: 4) provided hints on which parts to study in blurred images, and 5) supported hypothesis formation and confirmation (Wang et al. 2019; Sharpe et al. 2000) of suspected objects. For strongly blurred images, participants generally rated all CAMs as unhelpful because: 6) verifying the images was too difficult, 7) they felt misguided to blindly trust CAMs, and 8) they misjudged CAMs based on preconceived notions, i.e., confirmation bias (Wang et al. 2019).
6. Discussion and Design Implications
Our results highlighted issues in explanation faithfulness when CNN models explain their predictions on images subjected to systematic error bias, which we addressed by with Debiased-CAM to improve explanation truthfulness and helpfulness, and consequently the prediction performance. We discuss implications for XAI and HCI researchers and practitioners to: 1) be wary of how contexts and corruptions can make explanations misleading, 2) support scalable human-centric explanations, 3) extend debiasing to social contexts, and 4) carefully design unconfounded user studies to evaluate XAI. We also discuss 5) generalizations of our debiasing method to other XAI techniques and data types.
6.1. Physical contextual bias in explanations
Most AI explanations have been developed to support model debugging, help end-users identify incorrect model reasoning, or trust correct explanations. However, we have shown that moderate systematic error (biases) in data, which may seem innocuous, can lead to severe deviations in explanations, despite model fine-tuning. For baseline models, these truly reflect the model reasoning, but they can be incongruent with user expectations, and can harm user trust.
We have investigated three prevalent sources of bias — blur, color, lighting — that can plausibly occur in image applications, and were feasibly manipulable to test in evaluations. We showed that CAM deviations are significant in such cases, yet Debiased-CAM can improve them. In pilot studies, we have also investigated other bias types listed in (Hendrycks and Dietterich 2019). We found that environmental biases (e.g., snow, fog, frost) cause moderate CAM deviations that will require debiasing. Some biases had very weak CAM deviations (e.g., brightness, contrast), since the image pixel changes were monotonic which does not affect the additive activations in neural networks much. Debiasing may not be needed for such biases. Finally, we found that biases due to image processing and compression artifacts (e.g., Gaussian noise, JPEG) had small CAM deviations. We expect other blur biases (e.g., defocus, frosted glass, motion, zoom) to have slightly stronger, but similar effects as Gaussian blur that we evaluated, since the images remain similar to the original.
However, images subjected to adversarial noise (Dombrowski et al. 2019) would be particularly concerning, since an attacker can intelligently and maliciously inject noise to deliberately harm the performance or explanation, such that CAM deviations will be worse. Training Debiased-CAMs under such attacks may be more difficult.
6.2. Scalable human-centric explanations
The needs for model explainability are diverse. Langer et al. cataloged many desiderata of explanations (Langer et al. 2021), including several societal objectives such as agreeability, auditability, fairness and privacy. To support human interpretability at the cognitive level, explanations need to conform to human prior knowledge (Erion et al. 2021; Lage et al. 2018; Ross et al. 2017; Selvaraju et al. 2019), human reasoning processes (Miller 2019; Wang et al. 2019), and human perceptual processes (Zhang and Lim 2022). In this work, we focus on improving the agreeability of explanations towards human prior knowledge. This typically requires manual inspection and annotation by people (Ross et al. 2017; Lage et al. 2019), which is labor-intensive. Instead, given a clean dataset with agreeable explanations, we train our model to produce debiased explanations. This uses self-supervision, so it is also scalable and not labor-intensive. Users may only need to select images rather than annotate details in each image. For our studies, we had assumed that unbiased images have reliable explanations, but this should be verified by human labelers. An interface to support quick ratings of explanation acceptability would help to accelerate this data curation. Another scalable strategy involves defining axioms (e.g., attribution priors (Erion et al. 2021), psychological preferences (Wang et al. 2021), or visual cognitive chunks (Abdul et al. 2020)) and constraining explanations towards them. From our qualitative analysis, we identified desiderata for truthful saliency maps (e.g., trace the shape of relevant objects, control the spread or tightness of hot spots) that can be used as general axioms for faithful saliency maps. This further increases scalability by reducing the dependency on selecting reliable explanation references.
6.3. Debiasing explanations against social bias
Although we have focused on bias due to physical contexts, bias in social situations also needs debiasing. People are subjected to egocentric bias (Konow 2005) and societal discrimination (unfairness) (Dodge et al. 2019). With egocentric bias, different stakeholders would prioritize their own objectives (Ehsan et al. 2021) and may be ignorant of other viewpoints. Debiased explanations could encode different interpretation preferences (e.g., (Lage et al. 2018; Wang et al. 2021)) to show how slightly different two stakeholders interpret a decision (e.g., patient and doctor for medical diagnosis). With social bias, models may predict or reason undesirably for some protected groups of people based on sensitive attributes (race, gender, etc.). For example, saliency maps can detect bias in a model by highlighting a female face for Nurse, but highlighting a stethoscope held by a woman for Doctor (Selvaraju et al. 2017). Instead of the current approach to debias models with data balancing, our debias approach can retrain models to de-emphasize focusing on sensitive concepts (e.g., faces). However, we caution about the dark pattern of debiasing explanations to make an unfair model appear fair by retraining its explanation to appear fair (e.g., (Dombrowski et al. 2019; Dombrowski et al. 2022)).
6.4. Sensitive measures for faithful explanation
Saliency map explanations have mostly been evaluated with simulation metrics and rarely with human subjects (Alqaraawi et al. 2020; Kittley-Davies et al. 2019). User studies are important to verify the severity of problems (perceptually noticeable enough?) and the efficacy of solutions (problem no longer perceivable or perceptually forgivable?). However, designing successful experiments with strong effects and sensitive measures is difficult and many studies fail to find effects (Bansal et al. 2021; Kittley-Davies et al. 2019; Poursabzi-Sangdeh et al. 2021). To improve the sensitivity, experiments need more sensitive measures and carefully designed participant tasks.
Current user studies use simple true/false or multiple choice responses and confidence ratings, but these measures are prone to lucky guesses, do not capture secondary choices, or suffer from social desirability bias. The insensitivity of such methods could have led to null results (Alqaraawi et al. 2020; Kittley-Davies et al. 2019). Instead, we employed more sensitive and objective measures of labeling likelihood ("balls and bins" question). We also measured explanation agreement objectively, since users tend to over-trust wrong explanations (Kaur et al. 2020), affecting the validity of subjective ratings. Hence, we employed the grid-selection UI, which is similar to segment selection in (Zhang et al. 2019). Another method is to ask participants to write important and ignored features in the free text (Alqaraawi et al. 2020), but this is difficult to automatically evaluate.
Explanation understanding is typically evaluated with human simulatability tasks (Lim et al. 2009; Lipton 2018), where users try to predict what a model would predict. However, participant answers may be confounded by leaking information that participants are tested on. Zhang et al. (Zhang et al. 2019) evaluated saliency using a reverse-ablation method to incrementally reveal important segments and ask participants to label the image; this avoids the hindsight bias effect (Roese and Vohs 2012). In this work, we controlled when to pose questions. To measure perceived truthfulness, we first measured objective ground truth before showing CAMs to avoid participants copying or being primed. To measure perceived helpfulness in a privacy-preserving application, we posed questions twice, first with blurred images, then unblurred images. This mitigated the hindsight bias effect. Thus, we add sensitive experiment apparatuses to the literature on evaluating XAI.
6.5. Generalization to other XAI and data types
Our self-supervised debiasing can apply to other gradient-based explanations (Bach et al. 2015; Simonyan et al. 2014; Sundararajan et al. 2017) by formulating the activation, gradient or propagated terms as a secondary prediction task. However, some saliency explanations, such as Layer-wise Relevance Propagation (LRP) (Bach et al. 2015) and Integrated Gradients (Sundararajan et al. 2017), which produce fine-grained “edge detector” heatmaps (Adebayo et al. 2018) are likely to be more severely degraded with biasing, such as strong blurring. Beyond gradient-based explanations, model-agnostic explanations such as LIME (Ribeiro et al. 2016) and Kernel SHAP (Lundberg and Lee 2017) can be debiased by regularizing on a saliency loss metric. Notably, CNN explanation techniques such as feature visualizations (Bau et al. 2017; Olah et al. 2017) and neuron attention (Li et al. 2018) have higher dimensionality that requires more sensitivity to debias. Dimensionality reduction with autoencoders or generative adversarial networks (GANs) could provide latent features that are feasible to debias. Finally, concept-based explanations such as TCAV (Kim et al. 2018) and RexNet (Zhang and Lim 2022) can be debiased to align the generated concept with user expectations.
Debiased-CAM can be generalized to other types of data subjected to bias, particularly those that can be modeled with CNNs, such as audio and time series data. Other than biases in images, debiasing is also necessary for explaining model predictions of other data types and behaviors, such as audio signals with noise or obfuscation (McLoughlin et al. 2015), and human activity recognition with inertial measurement units (IMU) or other wearable sensors (Ryoo et al. 2017). With the prevalence of data bias in the real-world and privacy obfuscation, Debiased-CAM provides a generalizable framework to train robust performance and faithful explanations for responsible AI.
7. Conclusion
We highlight issues in explanation faithfulness when CNN models explain their predictions on images that are biased with systematic error, and address this by developing Debiased-CAM to improve the truthfulness of explanations. We achieved these improvements by ensuring that model parameters were learned based on more important attention as identified by unbiased explanations and on more diverse inputs due to data augmentation across multiple bias levels. We also implemented more precise training with multiple prediction tasks and differentiable explanation loss. Our results showed that even when image data were degraded or distorted due to bias, 1) they retained sufficient useful information that DebiasedCNN could learn to recover salient locations of unbiased explanations, and 2) these salient locations were highly relevant to the primary task such that prediction performance could be improved.
Acknowledgements.
This work was supported in part by the Ministry of Education, Singapore under the grant T2EP20121-0040, and was carried out at the NUS Centre for Research in Privacy Technologies (N-CRiPT) and the NUS Institute for Health Innovation and Technology (iHealthtech).References
- (1)
- Abdul et al. (2018) Ashraf Abdul, Jo Vermeulen, Danding Wang, Brian Y Lim, and Mohan Kankanhalli. 2018. Trends and trajectories for explainable, accountable and intelligible systems: An hci research agenda. In Proceedings of the 2018 CHI conference on human factors in computing systems. 1–18.
- Abdul et al. (2020) Ashraf Abdul, Christian von der Weth, Mohan Kankanhalli, and Brian Y Lim. 2020. COGAM: Measuring and Moderating Cognitive Load in Machine Learning Model Explanations. In Proceedings of the 2020 CHI Conference on Human Factors in Computing Systems. 1–14.
- Adebayo et al. (2018) Julius Adebayo, Justin Gilmer, Michael Muelly, Ian Goodfellow, Moritz Hardt, and Been Kim. 2018. Sanity checks for saliency maps. In Advances in Neural Information Processing Systems. 9505–9515.
- Afifi and Brown (2019) Mahmoud Afifi and Michael S Brown. 2019. What else can fool deep learning? Addressing color constancy errors on deep neural network performance. In Proceedings of the IEEE International Conference on Computer Vision. 243–252.
- Alqaraawi et al. (2020) Ahmed Alqaraawi, Martin Schuessler, Philipp Weiß, Enrico Costanza, and Nadia Berthouze. 2020. Evaluating saliency map explanations for convolutional neural networks: a user study. In Proceedings of the 25th International Conference on Intelligent User Interfaces. 275–285.
- Angel and Gronfein (1988) Ronald Angel and William Gronfein. 1988. The use of subjective information in statistical models. American Sociological Review (1988), 464–473.
- Avrahami et al. (2007) Daniel Avrahami, James Fogarty, and Scott E Hudson. 2007. Biases in human estimation of interruptibility: effects and implications for practice. In Proceedings of the SIGCHI conference on Human factors in computing systems. 50–60.
- Bach et al. (2015) Sebastian Bach, Alexander Binder, Grégoire Montavon, Frederick Klauschen, Klaus-Robert Müller, and Wojciech Samek. 2015. On pixel-wise explanations for non-linear classifier decisions by layer-wise relevance propagation. PloS one 10, 7 (2015), e0130140.
- Bansal et al. (2021) Gagan Bansal, Tongshuang Wu, Joyce Zhou, Raymond Fok, Besmira Nushi, Ece Kamar, Marco Tulio Ribeiro, and Daniel Weld. 2021. Does the whole exceed its parts? the effect of ai explanations on complementary team performance. In Proceedings of the 2021 CHI Conference on Human Factors in Computing Systems. 1–16.
- Bau et al. (2017) David Bau, Bolei Zhou, Aditya Khosla, Aude Oliva, and Antonio Torralba. 2017. Network dissection: Quantifying interpretability of deep visual representations. In Proceedings of the IEEE conference on computer vision and pattern recognition. 6541–6549.
- Bylinskii et al. (2018) Zoya Bylinskii, Tilke Judd, Aude Oliva, Antonio Torralba, and Frédo Durand. 2018. What do different evaluation metrics tell us about saliency models? IEEE transactions on pattern analysis and machine intelligence 41, 3 (2018), 740–757.
- Charity ([n.d.]) Mitchell Charity. [n.d.]. What color is a blackbody? - some pixel rgb values. http://www.vendian.org/mncharity/dir3/blackbody/.
- Chattopadhay et al. (2018) Aditya Chattopadhay, Anirban Sarkar, Prantik Howlader, and Vineeth N Balasubramanian. 2018. Grad-cam++: Generalized gradient-based visual explanations for deep convolutional networks. In 2018 IEEE Winter Conference on Applications of Computer Vision (WACV). IEEE, 839–847.
- Chen et al. (2020) Ting Chen, Simon Kornblith, Mohammad Norouzi, and Geoffrey Hinton. 2020. A simple framework for contrastive learning of visual representations. In International conference on machine learning. PMLR, 1597–1607.
- Chen et al. (2015) Xinlei Chen, Hao Fang, Tsung-Yi Lin, Ramakrishna Vedantam, Saurabh Gupta, Piotr Dollár, and C Lawrence Zitnick. 2015. Microsoft coco captions: Data collection and evaluation server. arXiv preprint arXiv:1504.00325 (2015).
- Das et al. (2017) Abhishek Das, Satwik Kottur, Khushi Gupta, Avi Singh, Deshraj Yadav, José MF Moura, Devi Parikh, and Dhruv Batra. 2017. Visual dialog. In Proceedings of the IEEE Conference on Computer Vision and Pattern Recognition. 326–335.
- Davis and Ginthner (1990) Robert G Davis and Dolores N Ginthner. 1990. Correlated color temperature, illuminance level, and the Kruithof curve. Journal of the Illuminating Engineering Society 19, 1 (1990), 27–38.
- De-Arteaga et al. (2020) Maria De-Arteaga, Riccardo Fogliato, and Alexandra Chouldechova. 2020. A case for humans-in-the-loop: Decisions in the presence of erroneous algorithmic scores. In Proceedings of the 2020 CHI Conference on Human Factors in Computing Systems. 1–12.
- Delavande and Rohwedder (2008) Adeline Delavande and Susann Rohwedder. 2008. Eliciting subjective probabilities in Internet surveys. Public Opinion Quarterly 72, 5 (2008), 866–891.
- Deng et al. (2009) Jia Deng, Wei Dong, Richard Socher, Li-Jia Li, Kai Li, and Li Fei-Fei. 2009. Imagenet: A large-scale hierarchical image database. In 2009 IEEE conference on computer vision and pattern recognition. Ieee, 248–255.
- Dimiccoli et al. (2018) Mariella Dimiccoli, Juan Marín, and Edison Thomaz. 2018. Mitigating bystander privacy concerns in egocentric activity recognition with deep learning and intentional image degradation. Proceedings of the ACM on Interactive, Mobile, Wearable and Ubiquitous Technologies 1, 4 (2018), 1–18.
- Dodge et al. (2019) Jonathan Dodge, Q Vera Liao, Yunfeng Zhang, Rachel KE Bellamy, and Casey Dugan. 2019. Explaining models: an empirical study of how explanations impact fairness judgment. In Proceedings of the 24th international conference on intelligent user interfaces. 275–285.
- Dombrowski et al. (2019) Ann-Kathrin Dombrowski, Maximillian Alber, Christopher Anders, Marcel Ackermann, Klaus-Robert Müller, and Pan Kessel. 2019. Explanations can be manipulated and geometry is to blame. Advances in Neural Information Processing Systems 32 (2019), 13589–13600.
- Dombrowski et al. (2022) Ann-Kathrin Dombrowski, Christopher J. Anders, Klaus-Robert Müller, and Pan Kessel. 2022. Towards Robust Explanations for Deep Neural Networks. Pattern Recognit. 121 (2022), 108194.
- Doshi-Velez and Kim (2017) Finale Doshi-Velez and Been Kim. 2017. Towards a rigorous science of interpretable machine learning. arXiv preprint arXiv:1702.08608 (2017).
- Du et al. (2019) Mengnan Du, Ninghao Liu, and Xia Hu. 2019. Techniques for interpretable machine learning. Commun. ACM 63, 1 (2019), 68–77.
- Ehsan et al. (2021) Upol Ehsan, Q Vera Liao, Michael Muller, Mark O Riedl, and Justin D Weisz. 2021. Expanding explainability: Towards social transparency in ai systems. In Proceedings of the 2021 CHI Conference on Human Factors in Computing Systems. 1–19.
- Erion et al. (2021) Gabriel Erion, Joseph D Janizek, Pascal Sturmfels, Scott M Lundberg, and Su-In Lee. 2021. Improving performance of deep learning models with axiomatic attribution priors and expected gradients. Nature Machine Intelligence (2021), 1–12.
- Esteva et al. (2017) Andre Esteva, Brett Kuprel, Roberto A Novoa, Justin Ko, Susan M Swetter, Helen M Blau, and Sebastian Thrun. 2017. Dermatologist-level classification of skin cancer with deep neural networks. nature 542, 7639 (2017), 115–118.
- Fong and Vedaldi (2017) Ruth C Fong and Andrea Vedaldi. 2017. Interpretable explanations of black boxes by meaningful perturbation. In Proceedings of the IEEE International Conference on Computer Vision. 3429–3437.
- Ghorbani et al. (2019) Amirata Ghorbani, Abubakar Abid, and James Zou. 2019. Interpretation of neural networks is fragile. In Proceedings of the AAAI Conference on Artificial Intelligence, Vol. 33. 3681–3688.
- Goldstein and Rothschild (2014) Daniel G Goldstein and David Rothschild. 2014. Lay understanding of probability distributions. Judgment & Decision Making 9, 1 (2014).
- Guidotti et al. (2018) Riccardo Guidotti, Anna Monreale, Salvatore Ruggieri, Franco Turini, Fosca Giannotti, and Dino Pedreschi. 2018. A survey of methods for explaining black box models. ACM computing surveys (CSUR) 51, 5 (2018), 1–42.
- Gurrin et al. (2016) Cathal Gurrin, Hideo Joho, Frank Hopfgartner, Liting Zhou, and Rami Albatal. 2016. Ntcir lifelog: The first test collection for lifelog research. In Proceedings of the 39th International ACM SIGIR conference on Research and Development in Information Retrieval. 705–708.
- Hancox-Li (2020) Leif Hancox-Li. 2020. Robustness in machine learning explanations: does it matter?. In Proceedings of the 2020 conference on fairness, accountability, and transparency. 640–647.
- Hendrycks and Dietterich (2019) Dan Hendrycks and Thomas Dietterich. 2019. Benchmarking neural network robustness to common corruptions and perturbations. arXiv preprint arXiv:1903.12261 (2019).
- Hendrycks et al. (2020) Dan Hendrycks, Norman Mu, Ekin D. Cubuk, Barret Zoph, Justin Gilmer, and Balaji Lakshminarayanan. 2020. AugMix: A Simple Data Processing Method to Improve Robustness and Uncertainty. Proceedings of the International Conference on Learning Representations (ICLR) (2020).
- Hohman et al. (2018) Fred Hohman, Minsuk Kahng, Robert Pienta, and Duen Horng Chau. 2018. Visual analytics in deep learning: An interrogative survey for the next frontiers. IEEE transactions on visualization and computer graphics 25, 8 (2018), 2674–2693.
- Hohman et al. (2019) Fred Hohman, Haekyu Park, Caleb Robinson, and Duen Horng Polo Chau. 2019. S ummit: Scaling deep learning interpretability by visualizing activation and attribution summarizations. IEEE transactions on visualization and computer graphics 26, 1 (2019), 1096–1106.
- Howard ([n.d.]) Jeremy Howard. [n.d.]. The imagenette dataset. https://github.com/fastai/imagenette. Github.
- Kahng et al. (2017) Minsuk Kahng, Pierre Y Andrews, Aditya Kalro, and Duen Horng Chau. 2017. ActiVis: Visual exploration of industry-scale deep neural network models. IEEE transactions on visualization and computer graphics 24, 1 (2017), 88–97.
- Kaur et al. (2020) Harmanpreet Kaur, Harsha Nori, Samuel Jenkins, Rich Caruana, Hanna M. Wallach, and Jennifer Wortman Vaughan. 2020. Interpreting Interpretability: Understanding Data Scientists’ Use of Interpretability Tools for Machine Learning. Proceedings of the 2020 CHI Conference on Human Factors in Computing Systems (2020).
- Kim et al. (2018) Been Kim, Martin Wattenberg, Justin Gilmer, Carrie Cai, James Wexler, Fernanda Viegas, et al. 2018. Interpretability beyond feature attribution: Quantitative testing with concept activation vectors (tcav). In International conference on machine learning. PMLR, 2668–2677.
- Kittley-Davies et al. (2019) Jacob Kittley-Davies, Ahmed Alqaraawi, Rayoung Yang, Enrico Costanza, Alex Rogers, and Sebastian Stein. 2019. Evaluating the effect of feedback from different computer vision processing stages: a comparative lab study. In Proceedings of the 2019 CHI Conference on Human Factors in Computing Systems. 1–12.
- Kizilcec (2016) René F Kizilcec. 2016. How much information? Effects of transparency on trust in an algorithmic interface. In Proceedings of the 2016 CHI Conference on Human Factors in Computing Systems. 2390–2395.
- Koh et al. (2020) Pang Wei Koh, Thao Nguyen, Yew Siang Tang, Stephen Mussmann, Emma Pierson, Been Kim, and Percy Liang. 2020. Concept bottleneck models. In International Conference on Machine Learning. PMLR, 5338–5348.
- Komodakis and Zagoruyko (2017) Nikos Komodakis and Sergey Zagoruyko. 2017. Paying more attention to attention: improving the performance of convolutional neural networks via attention transfer. In ICLR.
- Konow (2005) James Konow. 2005. Blind spots: The effects of information and stakes on fairness bias and dispersion. Social Justice Research 18, 4 (2005), 349–390.
- Krizhevsky et al. (2012) Alex Krizhevsky, Ilya Sutskever, and Geoffrey E Hinton. 2012. Imagenet classification with deep convolutional neural networks. Advances in neural information processing systems 25 (2012), 1097–1105.
- Kupyn et al. (2018) Orest Kupyn, Volodymyr Budzan, Mykola Mykhailych, Dmytro Mishkin, and Jiří Matas. 2018. Deblurgan: Blind motion deblurring using conditional adversarial networks. In Proceedings of the IEEE conference on computer vision and pattern recognition. 8183–8192.
- Laffont et al. (2014) Pierre-Yves Laffont, Zhile Ren, Xiaofeng Tao, Chao Qian, and James Hays. 2014. Transient attributes for high-level understanding and editing of outdoor scenes. ACM Transactions on graphics (TOG) 33, 4 (2014), 1–11.
- Lage et al. (2019) Isaac Lage, Emily Chen, Jeffrey He, Menaka Narayanan, Been Kim, Sam Gershman, and Finale Doshi-Velez. 2019. An evaluation of the human-interpretability of explanation. arXiv preprint arXiv:1902.00006 (2019).
- Lage et al. (2018) Isaac Lage, Andrew Slavin Ross, Been Kim, Samuel J Gershman, and Finale Doshi-Velez. 2018. Human-in-the-loop interpretability prior. Advances in neural information processing systems 31 (2018).
- Lakkaraju and Bastani (2020) Himabindu Lakkaraju and Osbert Bastani. 2020. " How do I fool you?" Manipulating User Trust via Misleading Black Box Explanations. In Proceedings of the AAAI/ACM Conference on AI, Ethics, and Society. 79–85.
- Langer et al. (2021) Markus Langer, Daniel Oster, Timo Speith, Holger Hermanns, Lena Kästner, Eva Schmidt, Andreas Sesing, and Kevin Baum. 2021. What do we want from Explainable Artificial Intelligence (XAI)?–A stakeholder perspective on XAI and a conceptual model guiding interdisciplinary XAI research. Artificial Intelligence 296 (2021), 103473.
- Li et al. (2015) Jia Li, Changqun Xia, Yafei Song, Shu Fang, and Xiaowu Chen. 2015. A data-driven metric for comprehensive evaluation of saliency models. In Proceedings of the IEEE international conference on computer vision. 190–198.
- Li et al. (2018) Kunpeng Li, Ziyan Wu, Kuan-Chuan Peng, Jan Ernst, and Yun Fu. 2018. Tell me where to look: Guided attention inference network. In Proceedings of the IEEE Conference on Computer Vision and Pattern Recognition. 9215–9223.
- Lim and Dey (2011) Brian Y Lim and Anind K Dey. 2011. Investigating intelligibility for uncertain context-aware applications. In Proceedings of the 13th international conference on Ubiquitous computing. 415–424.
- Lim et al. (2009) Brian Y Lim, Anind K Dey, and Daniel Avrahami. 2009. Why and why not explanations improve the intelligibility of context-aware intelligent systems. In Proceedings of the SIGCHI conference on human factors in computing systems. 2119–2128.
- Lipton (2018) Zachary C Lipton. 2018. The Mythos of Model Interpretability: In machine learning, the concept of interpretability is both important and slippery. Queue 16, 3 (2018), 31–57.
- Lundberg and Lee (2017) Scott M Lundberg and Su-In Lee. 2017. A unified approach to interpreting model predictions. In Advances in neural information processing systems. 4765–4774.
- McLoughlin et al. (2015) Ian McLoughlin, Haomin Zhang, Zhipeng Xie, Yan Song, and Wei Xiao. 2015. Robust sound event classification using deep neural networks. IEEE/ACM Transactions on Audio, Speech, and Language Processing 23, 3 (2015), 540–552.
- Miller (2019) Tim Miller. 2019. Explanation in artificial intelligence: Insights from the social sciences. Artificial intelligence 267 (2019), 1–38.
- Muller and Kogan (2010) Michael J Muller and Sandra Kogan. 2010. Grounded theory method in HCI and CSCW. Cambridge: IBM Center for Social Software 28, 2 (2010), 1–46.
- Nourani et al. (2019) Mahsan Nourani, Samia Kabir, Sina Mohseni, and Eric D Ragan. 2019. The effects of meaningful and meaningless explanations on trust and perceived system accuracy in intelligent systems. In Proceedings of the AAAI Conference on Human Computation and Crowdsourcing, Vol. 7. 97–105.
- Olah et al. (2017) Chris Olah, Alexander Mordvintsev, and Ludwig Schubert. 2017. Feature visualization. Distill 2, 11 (2017), e7.
- Papineni et al. (2002) Kishore Papineni, Salim Roukos, Todd Ward, and Wei-Jing Zhu. 2002. BLEU: a method for automatic evaluation of machine translation. In Proceedings of the 40th annual meeting of the Association for Computational Linguistics. 311–318.
- Posner et al. (2004) Michael I Posner, Charles R Snyder, and R Solso. 2004. Attention and cognitive control. Cognitive psychology: Key readings 205 (2004).
- Poursabzi-Sangdeh et al. (2021) Forough Poursabzi-Sangdeh, Daniel G Goldstein, Jake M Hofman, Jennifer Wortman Wortman Vaughan, and Hanna Wallach. 2021. Manipulating and measuring model interpretability. In Proceedings of the 2021 CHI Conference on Human Factors in Computing Systems. 1–52.
- Ramaswamy et al. (2020) Harish Guruprasad Ramaswamy et al. 2020. Ablation-CAM: Visual Explanations for Deep Convolutional Network via Gradient-free Localization. In The IEEE Winter Conference on Applications of Computer Vision. 983–991.
- Ribeiro et al. (2016) Marco Tulio Ribeiro, Sameer Singh, and Carlos Guestrin. 2016. " Why should i trust you?" Explaining the predictions of any classifier. In Proceedings of the 22nd ACM SIGKDD international conference on knowledge discovery and data mining. 1135–1144.
- Roese and Vohs (2012) Neal J. Roese and Kathleen D. Vohs. 2012. Hindsight Bias. Perspectives on Psychological Science 7 (2012), 411 – 426.
- Ross et al. (2017) Andrew Slavin Ross, Michael C Hughes, and Finale Doshi-Velez. 2017. Right for the right reasons: training differentiable models by constraining their explanations. In Proceedings of the 26th International Joint Conference on Artificial Intelligence. 2662–2670.
- Rudin (2019) Cynthia Rudin. 2019. Stop explaining black box machine learning models for high stakes decisions and use interpretable models instead. Nature Machine Intelligence 1, 5 (2019), 206–215.
- Ryoo et al. (2017) Michael Ryoo, Brandon Rothrock, Charles Fleming, and Hyun Jong Yang. 2017. Privacy-preserving human activity recognition from extreme low resolution. In Proceedings of the AAAI Conference on Artificial Intelligence, Vol. 31.
- Saito and Rehmsmeier (2015) Takaya Saito and Marc Rehmsmeier. 2015. The precision-recall plot is more informative than the ROC plot when evaluating binary classifiers on imbalanced datasets. PloS one 10, 3 (2015), e0118432.
- Schramowski et al. (2020) Patrick Schramowski, Wolfgang Stammer, Stefano Teso, Anna Brugger, Franziska Herbert, Xiaoting Shao, Hans-Georg Luigs, Anne-Katrin Mahlein, and Kristian Kersting. 2020. Making deep neural networks right for the right scientific reasons by interacting with their explanations. Nature Machine Intelligence 2, 8 (2020), 476–486.
- Selvaraju et al. (2017) Ramprasaath R Selvaraju, Michael Cogswell, Abhishek Das, Ramakrishna Vedantam, Devi Parikh, and Dhruv Batra. 2017. Grad-cam: Visual explanations from deep networks via gradient-based localization. In Proceedings of the IEEE international conference on computer vision. 618–626.
- Selvaraju et al. (2019) Ramprasaath R Selvaraju, Stefan Lee, Yilin Shen, Hongxia Jin, Shalini Ghosh, Larry Heck, Dhruv Batra, and Devi Parikh. 2019. Taking a hint: Leveraging explanations to make vision and language models more grounded. In Proceedings of the IEEE/CVF International Conference on Computer Vision. 2591–2600.
- Sharpe et al. (2000) William F Sharpe, Daniel G Goldstein, and Phil W Blythe. 2000. The distribution builder: A tool for inferring investor preferences. preprint (2000).
- Simonyan et al. (2014) Karen Simonyan, Andrea Vedaldi, and Andrew Zisserman. 2014. Deep inside convolutional networks: Visualising image classification models and saliency maps. (2014).
- Simonyan and Zisserman (2015) Karen Simonyan and Andrew Zisserman. 2015. Very Deep Convolutional Networks for Large-Scale Image Recognition. In International Conference on Learning Representations.
- Sundararajan et al. (2017) Mukund Sundararajan, Ankur Taly, and Qiqi Yan. 2017. Axiomatic attribution for deep networks. arXiv preprint arXiv:1703.01365 (2017).
- Szegedy et al. (2016) Christian Szegedy, Vincent Vanhoucke, Sergey Ioffe, Jon Shlens, and Zbigniew Wojna. 2016. Rethinking the inception architecture for computer vision. In Proceedings of the IEEE conference on computer vision and pattern recognition. 2818–2826.
- Vasiljevic et al. (2016) Igor Vasiljevic, Ayan Chakrabarti, and Gregory Shakhnarovich. 2016. Examining the impact of blur on recognition by convolutional networks. arXiv preprint arXiv:1611.05760 (2016).
- Vinyals et al. (2015) Oriol Vinyals, Alexander Toshev, Samy Bengio, and Dumitru Erhan. 2015. Show and tell: A neural image caption generator. In Proceedings of the IEEE conference on computer vision and pattern recognition. 3156–3164.
- Wang et al. (2019) Danding Wang, Qian Yang, Ashraf Abdul, and Brian Y Lim. 2019. Designing theory-driven user-centric explainable AI. In Proceedings of the 2019 CHI conference on human factors in computing systems. 1–15.
- Wang et al. (2021) Danding Wang, Wencan Zhang, and Brian Y Lim. 2021. Show or suppress? Managing input uncertainty in machine learning model explanations. Artificial Intelligence 294 (2021), 103456.
- Wang et al. (2020) Haofan Wang, Zifan Wang, Mengnan Du, Fan Yang, Zijian Zhang, Sirui Ding, Piotr Mardziel, and Xia Hu. 2020. Score-CAM: Score-Weighted Visual Explanations for Convolutional Neural Networks. In Proceedings of the IEEE/CVF Conference on Computer Vision and Pattern Recognition Workshops. 24–25.
- Wang and Yin (2021) Xinru Wang and Ming Yin. 2021. Are Explanations Helpful? A Comparative Study of the Effects of Explanations in AI-Assisted Decision-Making. In 26th International Conference on Intelligent User Interfaces. 318–328.
- Yang et al. (2020) Fumeng Yang, Zhuanyi Huang, Jean Scholtz, and Dustin L Arendt. 2020. How do visual explanations foster end users’ appropriate trust in machine learning?. In Proceedings of the 25th International Conference on Intelligent User Interfaces. 189–201.
- Yin et al. (2019) Ming Yin, Jennifer Wortman Vaughan, and Hanna Wallach. 2019. Understanding the effect of accuracy on trust in machine learning models. In Proceedings of the 2019 chi conference on human factors in computing systems. 1–12.
- Zeiler and Fergus (2014) Matthew D Zeiler and Rob Fergus. 2014. Visualizing and understanding convolutional networks. In European conference on computer vision. Springer, 818–833.
- Zhang et al. (2018) Quanshi Zhang, Ying Nian Wu, and Song-Chun Zhu. 2018. Interpretable convolutional neural networks. In Proceedings of the IEEE Conference on Computer Vision and Pattern Recognition. 8827–8836.
- Zhang and Zhu (2018) Quan-shi Zhang and Song-Chun Zhu. 2018. Visual interpretability for deep learning: a survey. Frontiers of Information Technology & Electronic Engineering 19, 1 (2018), 27–39.
- Zhang and Lim (2022) Wencan Zhang and Brian Y Lim. 2022. Towards Relatable Explainable AI with the Perceptual Process. Proceedings of the 2022 CHI Conference on Human Factors in Computing Systems (2022).
- Zhang et al. (2020b) Xinyang Zhang, Ningfei Wang, Hua Shen, Shouling Ji, Xiapu Luo, and Ting Wang. 2020b. Interpretable deep learning under fire. In 29th USENIX Security Symposium (USENIX Security 20).
- Zhang et al. (2020a) Yunfeng Zhang, Q Vera Liao, and Rachel KE Bellamy. 2020a. Effect of confidence and explanation on accuracy and trust calibration in AI-assisted decision making. In Proceedings of the 2020 Conference on Fairness, Accountability, and Transparency. 295–305.
- Zhang et al. (2019) Zijian Zhang, Jaspreet Singh, Ujwal Gadiraju, and Avishek Anand. 2019. Dissonance between human and machine understanding. Proceedings of the ACM on Human-Computer Interaction 3, CSCW (2019), 1–23.
- Zhao et al. (2021) Xuejun Zhao, Wencan Zhang, Xiaokui Xiao, and Brian Lim. 2021. Exploiting Explanations for Model Inversion Attacks. In Proceedings of the IEEE/CVF International Conference on Computer Vision. 682–692.
- Zheng et al. (2016) Stephan Zheng, Yang Song, Thomas Leung, and Ian J. Goodfellow. 2016. Improving the Robustness of Deep Neural Networks via Stability Training. 2016 IEEE Conference on Computer Vision and Pattern Recognition (CVPR) (2016), 4480–4488.
- Zhou et al. (2016) Bolei Zhou, Aditya Khosla, Agata Lapedriza, Aude Oliva, and Antonio Torralba. 2016. Learning deep features for discriminative localization. In Proceedings of the IEEE conference on computer vision and pattern recognition. 2921–2929.
- Zhou et al. (2018) Bolei Zhou, Yiyou Sun, David Bau, and Antonio Torralba. 2018. Interpretable basis decomposition for visual explanation. In Proceedings of the European Conference on Computer Vision (ECCV). 119–134.
Appendix A Technical Approach Appendix
A.1. Datasets and model implementation details
In simulation studies, we evaluated the models on three datasets for two image tasks (summarized in 1). For Simulation Study 1 (Blur Bias), we used Inception v3 (Szegedy et al. 2016) pretrained on ImageNet ILSVRC-2012 (Deng et al. 2009) and fine-tuned on blur biased images of ImageNette (Howard [n.d.]), which is a subset of ILSVRC-2012. We only retrained layers from the last two Inception blocks of the Inception v3 model. For Simulation Studies 2 and 4 (Blur and Color Temperature Bias on egocentric activity images), we also used Inception v3 pretrained on ILSVRC-2012, and fine-tuned it on the NTCIR-12 (Gurrin et al. 2016). For Simulation Study 3 (Blur Bias Captioning), we used the Neural Image Captioner (NIC) (Vinyals et al. 2015) with Inceptionv3-LSTM model and fine-tuned on blur biased images from COCO (Chen et al. 2015). We retrained the last two inception blocks of Inception v3 as well as LSTM blocks. For Simulation Study 5 (Lighting Bias), we fine-tuned the Inception v3 (pretrained on ILSVRC-2012) on the Transient Attribute database (TransAttr) (Laffont et al. 2014) for multi-label classification. We limited our evaluations to four labels: Snowy, Sunny, Cloudy, Dawn/Dusk. All model hyperparameters were tuned using the Adam optimizer with batch size 64 and learning rate .
A.2. Model Variants
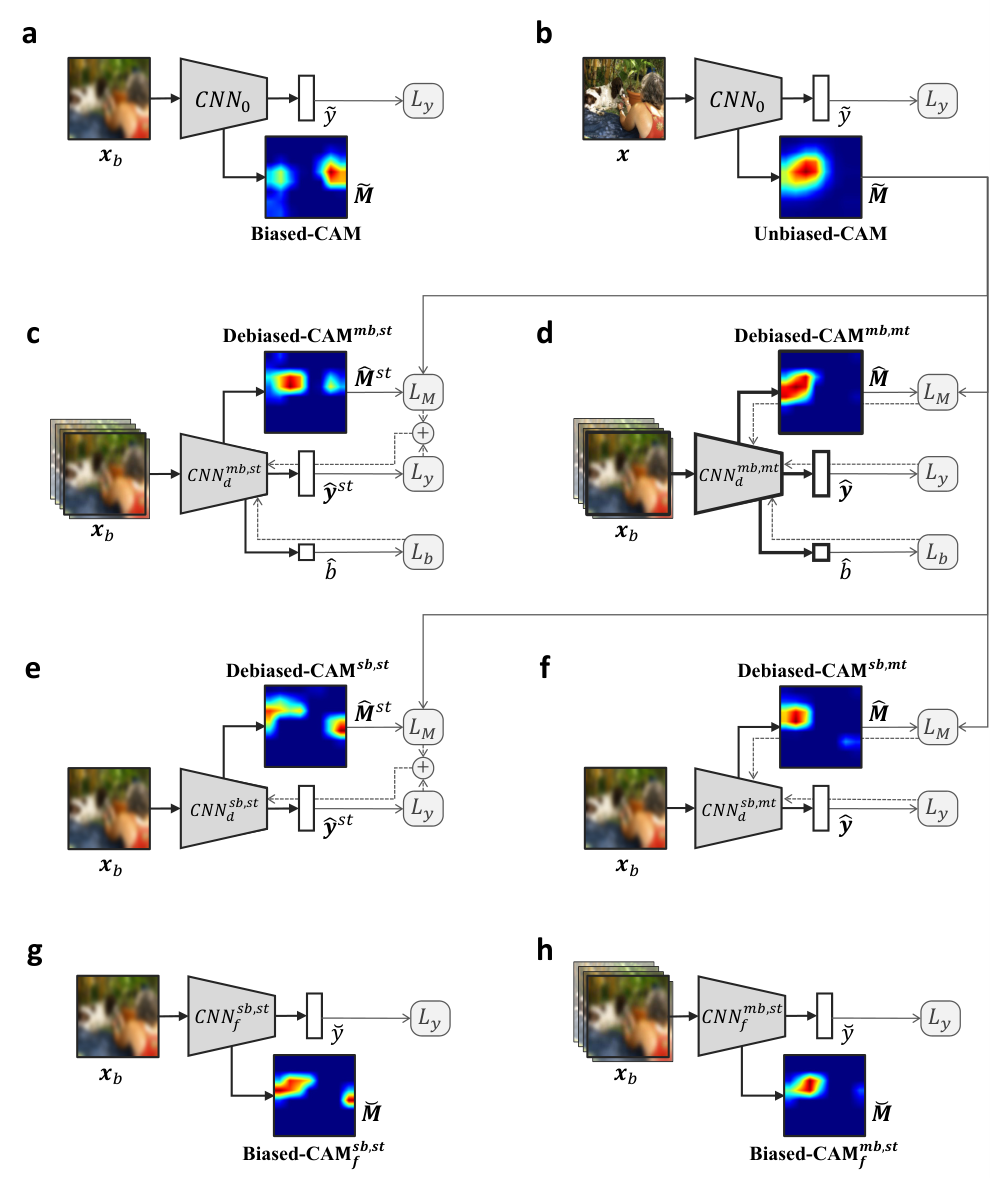
A.3. Debiasing spurious explanations of privacy-preserving AI

Appendix B Simulation Studies Appendix
B.1. Supplemental Method: Calculating Bias Levels
We provide details to calculate different bias for color temperature and lighting biases.
B.1.1. Color Temperature Bias
Color temperature refers to the temperature of an ideal blackbody radiator as if illuminating the scene. We biased color temperature as follows. Each pixel in an unbiased image has color , where represent the red, green, and blue color values within range 0-255, respectively. Each pixel is biased from neutral temperature by at bias level by multiplying a diagonal correction matrix with its color, i.e.,
| (5) |
where are scaling factors obtained from Charity’s color mapping function to map a blackbody temperature to RGB values (Charity [n.d.]) (Supplementary Fig. 3). We set the neutral color temperature to 6600K, which represents cloudy/overcast daylight. Color temperature biasing is asymmetric about zero bias, because people are more sensitive to perceiving changes in orange than blue colors (Kruithof Curve (Davis and Ginthner 1990)); and due to the non-linear monotonic relationship between blackbody temperature and modal color frequency (Wien’s Displacement Law). This asymmetry explains why orange biasing led to stronger CAM deviation than blue biasing.
B.1.2. Lighting Bias
Lighting bias occurs when the same scene is lit brightly or dimly. In nature, this occurs as sunlight changes hour-to-hour, or season-to-season. The Transient Attributes database (Laffont et al. 2014) contains photos of scenes from the same camera position taken across different times of the day and year. Attribute changes include whether the scene is daytime or nighttime, snowy, foggy, dusk/dawn or not. We sought to generate images with different degrees of darkness, but the dataset only contained photos that were very bright or very dark. Therefore, we interpolated photos to generate scenes with intermediate darkness. For each scene, with a daytime image and nighttime image , we performed the pixel-wise interpolation as,
| (6) |
where is the night/day ratio. An unbiased image has indicating daytime, and the most biased image has indicating nighttime.
B.2. Supplemental Results


Appendix C User Studies Appendix
C.1. User Studies Image Selection and CAMs
For both user studies, we chose 10 images to select one instance per class label for 10 classes of ImageNette. This balanced between selecting a variety of images for better external validity, and too much workload for participants due to too many trials. CAMs were generated from specific CNN models in Simulation Study 1. At each blur level, Unbiased-CAM and Biased-CAM were generated from RegularCNN, while Debiased-CAM was generated from DebiasedCNN (mb, mt). A key objective of the user studies was to validate the results of the simulation studies regarding CAM types and image blur bias levels, hence, we selected canonical images that:
- (1)
Had RegularCNN and DebiasedCNN predict correct labels for unblurred images, since we were not investigating the use of CAMs to debug model errors. CNN predictions on blurred images may be wrong, but we showed the CAM of the correct label.
- (2)
Were easy to recognize when unblurred, so that users can perceive whether a CAM is representative of a recognizable image. This was validated in our pilot study.
- (3)
Were somewhat difficult but not impossible to recognize with Weak blur, so that participants can feasibly verify image labels with some help from CAMs.
- (4)
Were very difficult to recognize with Strong blur, such that about half of pilot participants were unable to recognize the scene, to investigate the upper limits of CAM helpfulness.
- (5)
Had Unbiased-CAMs that were representative of their labels, to evaluate perceptions with respect to truthful CAMs. Conversely, debiasing towards untruthful CAMs is futile.
- (6)
Had Biased-CAMs for Strong blur that were perceptibly deviated and localized irrelevant objects or pixels; otherwise, no difference between Unbiased-CAM and Biased-CAM will lead to no perceived difference between Unbiased-CAM and Debiased-CAM too.
- (7)
Had Debiased-CAMs that were an approximate interpolation between the Unbiased-CAM and Biased-CAM of each image, to represent the intermediate CAM Faithfulness of Debiased-CAM found in the simulation studies.
These criteria were verified with participants in a pilot study and the selected images had CAM Faithfulness representative of Simulation Study 1 for Debiased-CAM, but with slightly lower CAM Faithfulness for Biased-CAM to represent worse case scenarios. CAMs were different based on CAM type and Blur Bias level. Unbiased-CAMs were the same for all Blur Bias levels, and Unbiased-CAM and Biased-CAM were the same for None blur level. For other conditions, CAMs were deviated and debiased based on CAM type and Blur Bias level. We chose not to test participants with images in NTCIR-12 due to quality and recognizability issues. Since images were automatically captured at regular time intervals, many images were transitional (e.g., pointing at ceiling while “Watching TV”), which made them unrepresentative of the label. Furthermore, in pilot testing, participants had great difficulty recognizing some scenes (e.g., “Cleaning and Chores”) in images with Strong blur, such that the tasks became too confusing to test. Nevertheless, our results can generalize to wearable camera images with Weak blur, for users who are familiar with or can remember their personal recent or likely activities.


C.2. User Study 1 and 2 Questionnaires
We illustrate key sections in the questionnaire for the CAM Truthfulness User Study 1 and CAM Helpfulness User Study 2. Both questionnaires were identical except for the main study section.