[ beforeskip=-1afterskip=.1]section \RedeclareSectionCommand[ beforeskip=-1afterskip=.1]section \RedeclareSectionCommand[ beforeskip=-1afterskip=.1]section
Measurement of the deposit formation during pneumatic transport of polydisperse PMMA powder
Nuki Susantia,b, Holger Grosshansa,b
a Physikalisch-Technische Bundesanstalt (PTB), Braunschweig, Germany
b Institute of Apparatus- and Environmental Technology, Otto von Guericke University Magdeburg, Germany
E-mail: holger.grosshans@ptb.de
Abstract
Deposits which form during the pneumatic transport of particles are a frequent source of explosions in industrial facilities. Thus, to contribute to the operational safety of industrial plants, we explore the deposit formation of powder flows with our new experimental test-rig. To this end, the particle flow was analyzed optically using a square-shaped transparent pipe as a measuring section. We characterized the deposit pattern and quantified the fraction of particles that deposit depending on the flow conditions. The parameters under consideration included the flow Reynolds number, the powder loading, the duct material, and the ambient conditions (temperature, humidity). More specifically, we investigated the transport of polydisperse PMMA particles through pipes made of PMMA and PC.
Keywords: pneumatic conveying, deposits, electrostatics, particle-laden flow, experiment
1 Introduction
When powders are conveyed pneumatically through pipes or ducts, they form deposit layers on component surfaces. These deposits are a frequent source of explosions in industrial particle flow facilities (Eckhoff 2003). For example, if the powder is charged by triboelectric effects, a deposit represents a local accumulation of electrostatic energy, which may lead to hazardous spark discharges. Also, an external heat source such as welding at the outside of the pipe may initiate the deposit to smolder. Moreover, it was recently observed that deposited dust in an enclosed pipeline can trigger a reverse explosion (Song and Zhang 2019) and the re-entrainment of deposited particles can cause secondary explosions (Eckhoff 2003). Also, particle deposition along the transporting pipeline causes a reduced cross-sectional area and blockage which might lead to a reduced operation efficiency (Klinzing 1981, Klinzing 2018). Thus, an increased understanding of the physical mechanisms involved in particle deposition will help to design safe and efficient particle transport systems.
In dilute flow pneumatic conveying, which is the focus of the present study, particles are known to adopt preferential positions due to the inhomogeneity of the flow inside the pipe (Eaton and Fessler 1994) and electrostatic forces (Grosshans 2018, Grosshans 2020). The particle concentration becomes even more complicated when the conveying line is of a non-cylindrical shape, such as a square or rectangular duct (Noorani et al. 2016). Further, pneumatic transport is known to generate high charge due to severe particle-wall collisions (Bailey 1984, Grosshans and Papalexandris 2017, Grosshans and Papalexandris 2016b, Grosshans and Papalexandris 2016a, Grosshans and Papalexandris 2016c). Those issues make a seemingly simple process highly convoluted since a wide range of factors influences particle motion, dispersion, preferential concentration, and subsequent deposition.
Particle deposition from turbulent flow in non-cylindrical enclosures has been widely studied, both by means of numerical simulation (Wang et al. 2019, Yao and Fairweather 2011, Winkler et al. 2006, Klahn and Grosshans 2020, Klahn and Grosshans 2019) and experimental investigation (Sippola and Nazaroff 2004, Kaftori et al. 1995, Matsusaka et al. 1998). Wang et al. 2019, as well as Yao and Fairweather 2011, used large eddy simulation (LES) combined with a Lagrangian approach of one-way coupling to simulate deposition at almost the same range of particle sizes (50 m–500 m) and Reynolds numbers (10 000-250 000). They found that particles have preferential deposition locations depending on size and Reynolds number, either in the center or in the corner of the duct. Sippola and Nazaroff 2004 experimentally measured small particle deposition (1 m–16 m) at relatively low air velocities (2.2 m/s–8.8 m/s) in a steel ventilation and an insulated duct. They pointed out the deposition rate increases due to surface roughness. The experimental work of Kaftori et al. 1995 using water as conveying fluid and particles ranging from 100 m–900 m revealed a relation of the particle motion and, thus, deposition with near-wall coherent vortices.
Despite its obvious importance, the detailed mechanism of deposit formation remains unknown such as which forces mainly contribute and where the deposit tends to form. This can be attributed to the complex interaction of the fluid mechanics, particle dynamics, and various adhesive forces acting on the particles. Consequently, the main objective of the present study is to design, based on our experience with a previous facility (Schwindt et al. 2017) a new experimental test-rig to investigate particle deposition in a square duct. The presented experimental facility was designed with the aim to maximize consistency with our complimentary numerical simulations (Grosshans 2018, Grosshans et al. 2019). Then, the influence of the Reynolds number, particle mass flow rate, and relative air humidity (RH) and temperature was investigated. In this experiment, first particles and a duct of the same material (PMMA) were used to minimize the triboelectric charging effect which might influence deposition. Subsequently, in the second part of the study, a measurement is conducted to investigate the influence of particle deposition due to triboelectric charging by using a different duct material (PC).
2 Experimental set-up
The schematics of the new experimental setup at Physikalisch-Technische Bundesanstalt (PTB) Braunschweig, Germany, is depicted in Fig. 1. It consists of an air blower (Moro MHR 452) equipped with a frequency converter (Danfoss FC 51) that is connected to a square duct (PMMA ID:45 mm or PC ID: 46 mm) of a length of 1.8 m. At the end of the duct, a pitot tube anemometer (PCE-HVAC 2) is placed to measure the mean bulk air velocity using the duct traversing technique (Log-Tchebychef). Point P in the schemata represents an airflow measuring point. Particles are fed into the duct via a vibratory feeder (Retsch DR100) and transported to the bin where the particle mass leaving the duct is weighed and recorded every 60 seconds. Thus, the particle mass fraction deposited in the duct can be calculated as
| (1) |
In the above equations are the particle mass flow rate input and output in kg/hr.
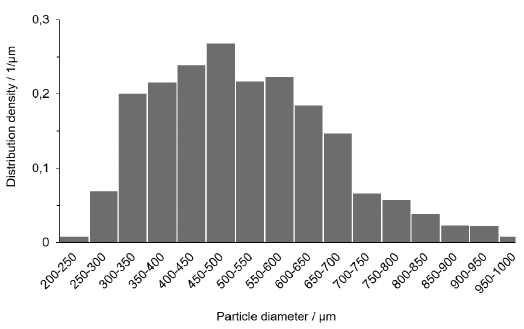
We used the same PMMA particles provided by KFG GmbH Biebesheim which were already used in previous work (Schwindt et al. 2017). The particle size distribution is plotted in Fig. 2 The experiments were not conducted in the climate chamber, thus, the day-to-day temperature and RH were always carefully considered and recorded.
3 Results and discussion
3.1 Characterization of the airflow
Since a pitot tube can only measure the velocity at one particular point, a method to observe the velocity distribution and, thus, the average flow velocity is needed. To this end, we used the pitot-static traverse technique (Cheong 2001) as proposed by ISO standard 3966. According to the Log-Tchebychef method the duct is divided into several small squares and the velocity in each corner of the small square is measured. In order to get a good average velocity, a minimum of 25 measurements is required. For a duct of a height less than 30 inches (76.2 cm), 5 traversal lines are required. Peszýnski et al. 2018 compared this method to the numerical integration curve resulting in a 2.2% difference.
The profile of the flow in the PMMA duct is plotted in Fig. 3(a) and in the PC duct in Fig. 3 (b). This air velocity measurement is taken at the end of the duct located at 1.8 m from the air inlet point respectively 1.5 m from the particle feeding point (see the experimental sketch) and expressed in terms of the time-averaged velocity. The measured streamwise air velocity, , and the distance from the wall, and , are normalized using the mean bulk velocity, , and the inner height of the duct, , respectively. Thus, is given by
| (2) |
where is kinematic viscosity.
3.2 Influence of the environmental conditions on the deposition velocity
An important quantity in the following analysis is the deposition velocity which represents the minimum conveying air velocity required to transport particles without settling or forming any stationary or resting deposition layer. This quantity indicates the operation range of a specific conveying system. In our experiments, we defined the depoision velocity as the velocity at which particles halt within the first minute of the transport process and form a deposition layer at the bottom of the duct. We observed that at an air velocity close to this point, the flow appears to be unstable which manifests by the intermittent appearance of particle clusters. As the air velocity is further reduced, particles start to settle and form a deposition layer.
It is well known that air RH and temperature may affect particle deposition (Han et al. 2011, He and Ahmadi 1998). Thus, we first examine the influence of RH and temperature on the deposition velocity and fraction. Experiments are initially performed to capture the general behavior. For that purpose, a constant particle flow rate of 3 kg/hr was adjusted. Three different RHs (31%, 49%, and 59%) were tested while the room temperature was 18 ∘C–23 ∘C. The results shown in Fig. 4 indicate that for our coarse polydisperse particles the RH is not of significant influence on the deposition velocity. Only a slight increase of the deposition velocity occurs as air RH increases drastically causing a comparable deposition fraction. To examine the temperature effect tests were performed at three temperatures (18∘C, 20∘C, and 23∘C) at fixed RH (31%) using the PMMA duct. The constant deposition velocity plotted in Fig. 4 indicates a negligible effect of the temperature at least for relatively large particles. He and Ahmadi 1998 confirmed that the temperature predominantly influences particle transport and deposition in turbulent flow when the particles are rather small, namely less than 0.1 m (1 m according to Han et al. 2011). Therefore, the effect of temperature will not be considered for the entire discussion of the present work.
3.3 Influence of and the particle mass flow rate on particle deposition
For polydisperse particles, we measured the instantaneous particle deposition fraction for different flow numbers keeping the particle flow rate constant during each experiment while varying the flow rate in different experiments between 3 kg/hr and 24 kg/hr. Thus, a dilute conveying phase is present. Each test was performed for 20 min using the PMMA duct and RH ranging between 30% and 36%.
The results presented in Fig. 5 show that by reducing more particles settle at the pipe bottom and the deposition process occurs faster. Thus, a layered bed is created which at a certain time will block the cross-sectional area of the duct and prevent the particles to flow. As mentioned above, close to the deposition velocity the flow is highly unstable. This process is optically clearly observable at higher particle flow rates where the particles are no longer homogeneously distributed, but rather resemble particle clusters sliding at the bottom of the pipe.
Finally, the resulting deposition velocity for all experiments in both a PC and PMMA duct are summarized in Fig. 5. As expected, the deposition velocity increases with increasing particle flow rate. In essence, the more particles are present in the conveying air, the higher the required air velocity to keep the particle in suspension.
Moreover, the usage of transparent ducts enables us to ascertain that particles that do not have enough inertia to propagate to the discharge point halt once they hit the bottom wall of the duct. The following particles then hit these initially settling particles and join together resulting in a lengthwise monolayer deposit bed. Thus, the initial settling particle acts seed-like as an initial point where the deposit starts to grow. Meanwhile, the particles above the bed are still transported in the dilute phase. As the deposit bed increases its length towards the feeding point, the following particles no longer hit the bottom of the pipe, but the deposit layer. These particle collisions decrease the particle velocity. Thus, they are no longer in suspension, rather rolling above the deposit bed and slowly adding up the bed height into a multilayer deposit until it is sufficient to completely block the duct.
As can be seen in Fig. 5, the deposition velocity of polydisperse particle fed at a rate of 3 kg/hr is 5.0 m/s ( = 14769). However, deposition is also observed at 5.6 m/s ( = 16521) related to a different mechanism. Before 5 min deposition forms and afterward the particles start to drop out of suspension and generate a tail pattern of monolayer deposit at the center part of the bottom duct. The following particles hit these deposited particles; however, they do not join together as with the lower . We could observe that the airborne particles swept away the particles in the deposit and took instead their place. Thus, an equilibrium of deposited and resuspended particles is created and, in sum, the amount of deposit is constant. This type of equilibrium behavior was reported by other authors before (Adhiwidjaja et al. 2000, Matsusaka et al. 1998).
3.4 Deposition shape and location


In Fig. 6 typical deposit patterns for two different Reynolds numbers are presented. Therein, the left picture relate to a flow slightly above the respective deposition velocity and the right one slightly below. As can be seen, the particles tend to deposit at the center of the duct.
This is likely related to fluid mechanical phenomena: it is known that the concentration of particles in a wall-bounded flow is inhomogeneous due to the turbophoretic drift under the influence of near-wall coherent turbulent structures. Also, the squared-shaped duct under consideration has two inhomogeneous directions (wall-normal and spanwise) which induces a secondary flow of Prandtl’s second kind (Gessner 1973, Yao and Fairweather 2010). As a result of this mechanism, four pairs of counter-rotating vortices are generated in the square duct (Wu et al. 2018). This secondary flow affects particle transport and dispersion, and consequently, deposition location. It enhances lateral mixing which is found stronger at the corner of the duct and supposedly responsible for the particle spanwise motion and transporting particles from the duct corner to the duct center (Sharma and Phares 2006). However, that motion considerably weakens in the duct center. Here, streamwise turbulence dominates the flow where turbophoresis occurs and brings the particles again to the region having low turbulence intensity, which is in the duct corner. These visual evidences confirm the results of several numerical studies (Noorani et al. 2016, Winkler et al. 2006, Sharma and Phares 2006, Lin et al. 2017, Zhang et al. 2015).
Further, based on the Reynolds number, the shape of the deposit appears differently. Analyzing the deposition shape of the lower flow depicted in Fig. 6(b) it can be seen that the streaky pattern looks more dispersed compared to concentrated ones of the higher case in Figs. 6(a). When the shear rate is decreased, the near-wall vortices are no longer able to eject and entrain particles. As a result, they will only be pushed aside by the sweep motion. On the contrary, when the shear rate is increased, vortices have sufficient energy to entrain particles causing the thin streaky deposition pattern (Kaftori et al. 1995).
Moreover, we investigated the influence of the air velocity on the deposition point. The deposition point is the point at which particles start to deposit and create a layer measured as the distance from the feeding point. For that analysis, a PC duct with a total length of 5.4 m was used. As shown in Fig. 7, the increasing air velocity is able to convey particles a farther distance until a constant point is reached. In other words, a higher air velocity will no longer influence the transport distance. This point is also called the boundary saltation.
4 Conclusion
The presence of particle deposits during pneumatic conveying is a potential hazard and ignition source for dust explosions. The objective of this work is to design and build a new test-rig to investigate particle deposition phenomena in squared ducts. Further, we analyzed the influence of the air conveying velocity, particle mass flow rate, relative air humidity and temperature, and duct material. It was found that the higher the particles’ flow rate, the higher the required air velocity to transport the powder to the outlet. High RH caused small particles to deposit at higher air conveying velocity and increases the particle deposition fraction. These findings enhance our understanding of the detailed mechanisms underlying the formation of deposits.
Acknowledgements
The authors gratefully acknowledge the financial support from Max Buchner Research Foundation.
References
- Adhiwidjaja et al. (2000) Adhiwidjaja, I., Matsusaka, S., Tanaka, H., Masuda, H. (2000). Simultaneous phenomenon of particle deposition and reentrainment: Effects of surface roughness on deposition layer of striped pattern. Aerosol Sci. Technol., 33(4):323–333.
- Bailey (1984) Bailey, A. (1984). Electrostatic phenomena during powder handling. Powder Technol., 37(1):71–85.
- Cheong (2001) Cheong, K. W. D. (2001). Airflow measurements for balancing of air distribution systems - tracer-gas technique as an alternative? Building and Environment, 36:955–964.
- Eaton and Fessler (1994) Eaton, J. K., Fessler, J. R. (1994). Preferential concentration of particles by turbulence. Int. J. Multiphase Flows, 20:169–209.
- Eckhoff (2003) Eckhoff, R. K. (2003). Dust Explosions in the Process Industries. Gulf Professional Publishing, 3rd edition.
- Gessner (1973) Gessner, F. (1973). The origin of secondary flow in turbulent flow along a corner. J. Fluid Mech., 58:1–25.
- Grosshans (2018) Grosshans, H. (2018). Modulation of particle dynamics in dilute duct flows by electrostatic charges. Phys. Fluids, 30(8):083303.
- Grosshans (2020) Grosshans, H. (2020). Simulation of Turbulent Particle-laden Flows and their Electrostatic Charging. Habilitation, Otto-von-Guericke-Universität Magdeburg.
- Grosshans and Papalexandris (2016a) Grosshans, H., Papalexandris, M. V. (2016a). Evaluation of the parameters influencing electrostatic charging of powder in a pipe flow. J. Loss Prev. Process Ind., 43:83–91.
- Grosshans and Papalexandris (2016b) Grosshans, H., Papalexandris, M. V. (2016b). Large eddy simulation of triboelectric charging in pneumatic powder transport. Powder Technol., 301:1008–1015.
- Grosshans and Papalexandris (2016c) Grosshans, H., Papalexandris, M. V. (2016c). A model for the non-uniform contact charging of particles. Powder Technol., 305:518–527.
- Grosshans and Papalexandris (2017) Grosshans, H., Papalexandris, M. V. (2017). Direct numerical simulation of triboelectric charging in a particle-laden turbulent channel flow. J. Fluid Mech., 818:465–491.
- Grosshans et al. (2019) Grosshans, H., Villafañe, L., Banko, A., Papalexandris, M. V. (2019). Case study on the influence of electrostatic charges on particle concentration in turbulent duct flows. Powder Technol., 357:46–53.
- Han et al. (2011) Han, Y., Hu, Y., Qian, F. (2011). Effects of air temperature and humidity on particle deposition. Chem. Eng. Res. Des., 89(10):2063–2069. ISSN 0263-8762.
- He and Ahmadi (1998) He, C., Ahmadi, G. (1998). Particle deposition with thermophoresis in laminar and turbulent duct flows. Aerosol Sci. Tech., 29(6):525–546.
- Kaftori et al. (1995) Kaftori, D., Hetsroni, G., Banerjee, S. (1995). Particle behavior in the turbulent boundary layer. i. motion, deposition, and entrainment. Phys. Fluids, 7(5):1095–1106.
- Klahn and Grosshans (2019) Klahn, E., Grosshans, H. (2019). Modeling the agglomeration of electrostatically charged particles. In Electrostatics 2019. Manchester, UK.
- Klahn and Grosshans (2020) Klahn, E., Grosshans, H. (2020). An accurate and efficient algorithm to model the agglomeration of macroscopic particles. J. Comput. Phys., 407:109232.
- Klinzing (1981) Klinzing, G. E. (1981). Gas-solid transport. McGraw-Hill,.
- Klinzing (2018) Klinzing, G. E. (2018). A review of pneumatic conveying status, advances and projections. Powder Technol., 333:78–90.
- Lin et al. (2017) Lin, Z. W., Xueming, S., Yu, Z. S., Wang, L. P. (2017). Effects of finite-size heavy particles on the turbulent flows in a square duct. J. Hydrodynam. B, 29:272–282.
- Matsusaka et al. (1998) Matsusaka, S., Adhiwidjaja, I., Nishio, T., Masuda, H. (1998). Formation of striped pattern deposition layers by an aerosol flow — analysis of thickness and interval of layers. Adv. Powder Technol., 9(3):207–218. ISSN 0921-8831.
- Noorani et al. (2016) Noorani, A., Vinuesa, R., Brandt, L., Schlatter, P. (2016). Aspect ratio effect on particle transport in turbulent duct flows. Phys. Fluids, 28(11):115103.
- Peszýnski et al. (2018) Peszýnski, K., Olszewski, L., Smyk, E., Perczy´nski, D. (2018). Analysis of the velocity distribution in different types of ventilation system ducts. EPJ Web Conf., 180:02081. 10.1051/epjconf/201817002081.
- Schwindt et al. (2017) Schwindt, N., von Pidoll, U., Markus, D., Klausmeyer, U., Papalexandris, M. V., Grosshans, H. (2017). Measurement of electrostatic charging during pneumatic conveying of powders. J. Loss Prev. Process Ind., 49:461–471.
- Sharma and Phares (2006) Sharma, G., Phares, D. J. (2006). Turbulent transport of particles in a straight square duct. Int. J. Multiph. Flow, 32(7):823–837. ISSN 0301-9322.
- Sippola and Nazaroff (2004) Sippola, M. R., Nazaroff, W. W. (2004). Experiments measuring particle deposition from fully developed turbulent flow in ventilation ducts. Aerosol Sci. Technol., 38(9):914–925.
- Song and Zhang (2019) Song, Y., Zhang, Q. (2019). Multiple explosions induced by the deposited dust layer in enclosed pipeline. J. Hazard. Mater., 371:423–432.
- Wang et al. (2019) Wang, Y., Zhao, Y., Yao, J. (2019). Large eddy simulation of particle deposition and resuspension in turbulent duct flows. Adv. Powder Technol., 30(3):656–671. ISSN 0921-8831.
- Winkler et al. (2006) Winkler, C., Rani, S. L., Vanka, S. (2006). A numerical study of particle wall-deposition in a turbulent square duct flow. Powder Technol., 170(1):12–25. ISSN 0032-5910.
- Wu et al. (2018) Wu, J., Xiao, H., Paterson, E. (2018). Physics-informed machine learning approach for augmenting turbulence models: A comprehensive framework. Phys. Rev. Fluids, 3:74602.
- Yao and Fairweather (2010) Yao, J., Fairweather, M. (2010). Inertial particle resuspension in a turbulent, square duct flow. Phys. Fluids, 22(3):33303.
- Yao and Fairweather (2011) Yao, J., Fairweather, M. (2011). Particle deposition in turbulent square duct flows. In J. Phys. Conf. Ser., volume 318, page 052005. IOP Publishing.
- Zhang et al. (2015) Zhang, H., Trias, F. X., Gorobets, A., Oliva, A., Yang, D., Tan, Y., Sheng, Y. (2015). Effect of collisions on the particle behavior in a turbulent square duct flow. Powder Technol., 269:320–336.