Results from high-frequency all-sky search for continuous gravitational waves from small-ellipticity sources
Abstract
We present the results of an all-sky search for continuous gravitational wave signals with frequencies in the 1700-2000 Hz range from neutron stars with ellipticity of . The search employs the Falcon analysis pipeline Dergachev:2019wqa on LIGO O2 public data. Our results improve by a factor greater than 5 over lvc_O2_allsky. This is a huge leap forward: it takes an entirely new generation of gravitational wave detectors to achieve a 10-fold sensitivity increase over the previous generation Reitze:2019iox. Within the probed frequency range and aside from the detected outliers, we can exclude neutron stars with ellipticity of within 65 pc of Earth. We set upper limits on the gravitational wave amplitude that hold even for worst-case signal parameters. New outliers are found, some of which we are unable to associate with any instrumental cause. If any were associated with a rotating neutron star, this would likely be the fastest neutron star today.
Detectable continuous gravitational waves are expected from fast rotating neutron stars if they present some sort of non-axially symmetric deformation. The deformation in this context is usefully described by the ellipticity of the object, defined as , where is the moment of inertia tensor of the star and is along the star’s rotation axis Jaranowski:1998qm.
In our previous paper O2_falcon we searched for gravitational wave emission in the 500-1700 Hz range, targeting objects with ellipticity of . We found a number of outliers, some corresponding to known instrumental artifacts, some in data with pristine frequency spectrum.
Ellipticities of are interesting: they are well within the range of what the neutron star crusts can sustain Gittins:2020cvx and observational indications exist that millisecond pulsars might have a minimum ellipticity of ellipticity.
The search O2_falcon using the Falcon pipeline Dergachev:2019wqa; loosely_coherent; loosely_coherent2; loosely_coherent3 was performed on public LIGO data from the O2 science run. In order to investigate the consistency of our outliers waveforms with new data we would need at least a few Hz around the outliers frequency over the entire duration of a more sensitive data set. This data set is the O3 data, and we will be able to access it after it is released, in April 2021 DataManagementPlan.
The LIGO bulk data releases do not include any auxiliary-channel data O2_env, thus we are limited to the analysis of the gravitational wave channel to identify detector artifacts. Given the amount of contamination found in the O1 data, we would not be surprised if some of the outliers from O2_falcon could be easily attributed to detector disturbances.
So far none of our outliers from O2_falcon have been linked to any instrumental cause, nor have results of follow-ups on O3 data been reported. This leaves us in the same state of knowledge as when O2_falcon came out and justifies further expanding the search range to higher frequencies where fewer detector artifacts are commonly observed.

| SNR | Frequency | Spindown | Comment | ||
|---|---|---|---|---|---|
| Hz | pHz/s | degrees | degrees | ||
| ip14 | |||||
| ip14 echo | |||||
| H1 line | |||||
| L1 line |
| Label | Frequency | Spindown | ||
| Hz | pHz/s | degrees | degrees | |
| ip14 | -1 |
In the new Hz band we expand the first-order frequency derivative search range to Hz/s, consistent with our ellipticity target at a level . We leave unchanged the rest of the search parameters.
Our search looks for signals that are phase coherent over a certain time-span, called the coherence-length, and that evolve slowly over longer timescales. The search detects with highest efficiency continuous wave signals from isolated objects, with constant amplitude and frequency evolution that can be described by a Taylor expansion around nominal frequency and frequency derivative values, see for example Section II of Jaranowski:1998qm. We will refer to these signals as the “ IT2 model” continuous wave signals. Here “I” indicates the source being isolated and “T2” indicates an intrinsic frequency evolution given by a Taylor polynomial of degree 2. In the literature IT2 signals are used as a reference to measure search performance, and for upper limits.
This search employs a first coherence-length of 12 hours. Regions of parameter space associated with high SNR results are searched again with a coherence length of 24 hours. The process is repeated with a coherence length of 48 and finally of 144 hours, as done in O2_falcon. This search is considerably more computationally intensive per unit frequency interval compared to O2_falcon, and in fact it took approximately the same amount of compute cycles to cover 300 Hz in this frequency range than it did to cover 1200 Hz at the lower frequencies investigated in O2_falcon.
High-frequency searches are not only interesting because they can probe lower neutron star deformations. Detecting continuous gravitational waves between 1700 and 2000 Hz would also unveil the fastest rotating neutron star and would be a breakthrough in explaining why electro-magnetic observations have not revealed any pulsar rotating faster than about 700 Hz, while the maximum rotation frequency cannot be lower than 1.2 kHz Haskell:2018nlh.

The new search could see such low ellipticity objects up to 200 pc away (Figure 2) for circularly polarized signals, and we would expect to detect an arbitrary oriented source within 65 pc. The gravitational wave amplitude upper limits from this search are shown in Figure 1 and are available in numerical form in data.
Our upper limits can be translated into limits on gravitational waves from boson condensates around black holes boson1; boson2, which are expected to emit monochromatic continuous wave signals discovering_axions. We leave it to the interested reader to constrain from our upper limits physical quantities of interest, based on the specific model they wish to consider. Assuming the ensemble signal of Zhu:2020tht from a galactic population of isolated stellar mass black holes with maximum mass 30 and maximum initial spin uniformly distributed in [0,1], our results extend the boson mass exclusion region to eV (Fig. 18 of Zhu:2020tht).
A key result of our search are several outliers (Table 1), two of which are located in bands with clean frequency spectrum.
The outlier with the highest signal-to-noise ratio (SNR) is at 1891.76 Hz and it is not associated with any reported detector artifact Covas:2018oik. At such high frequency the Doppler shift changes the frequency of the received signal by 0.25 Hz during O2 (Figure 3). The spectrum in this frequency band is clean (Figure 4) with no evidence of any contamination in either detector.
We examine the SNR build-up for the two highest-SNR unmarked outliers. An IT2 continuous wave signal would be expected to have constant rate of signal accumulation and be consistently identified by other search methods. Our two outliers deviate from this behaviour, showing SNR accumulation peaks in subsets of the data (see appendix for more details and cautions on over-interpreting this fact). A semi-coherent matched-filter search of the type used in EHO2, combining the results of 29 coherent searches, each on stretches of data 126 hours long, does not return particularly significant results.
In spite of significant search efforts, continuous gravitational waves have yet to be detected. As we have pointed out in O2_falcon the reason could be that the signal strength is lower than what searches can nowadays detect. But it could also be that the signal may not be an IT2 signal. There are many reasons for which this could happen: the signal itself might not be perfectly phase coherent. After all, we do know that pulsars exist which glitch and that present spin irregularities. The pulse profiles of pulsars show that the physics of these objects is rich and complex. It may also be that the signal is perfectly regular but different than the IT2 model: For instance the star could have a companion or its spin axis could be slowly precessing.
The loosely coherent search employed by the Falcon pipeline is specifically designed to be more robust than matched-filter based searches with respect to deviations of the signal from the IT2 model. Signals can be imagined that would produce the observed results but these are a-posteriori considerations that do not add to the significance of the present outliers. The reason why we highlight these outliers is that it is time to entertain the possibility that continuous waves may not come in the IT2 signal form. The detection of such signals will be harder and it begins with the careful consideration of all outliers that cannot be reasonably ascribed to instrumental causes. Such are the outliers presented here and in O2_falcon. The big sensitivity improvement of this search over previous ones makes these results uniquely interesting. The small parameter range associated with the outliers identified here, enables dedicated follow-ups on new data that will advance our understanding of these first observations.
The number of known spectral instrumental artifacts typically decreases with frequency, many of them being harmonics of low-frequency noise sources and the higher frequency “violin” modes being carefully segregated in specific frequency bands to avoid contamination of the rest of the spectrum. Thus the fact that we see two outliers in a 300 Hz band makes them interesting. If they are due to a noise source this provides a unique opportunity to identify it and remove it, perhaps unveiling a new class of “weak” contaminants. If no instrumental noise source is found, these signals should be a focus of thorough future investigations.
Acknowledgements.
The authors thank the scientists, engineers and technicians of LIGO, whose hard work and dedication produced the data that made this search possible. The search was performed on the ATLAS cluster at AEI Hannover. We thank Bruce Allen, Carsten Aulbert and Henning Fehrmann for their support. We also thank Bernard Schutz and Bruce Allen for interesting and helpful discussions on the significance of the results presented here. This research has made use of data, software and/or web tools obtained from the LIGO Open Science Center (https://losc.ligo.org), a service of LIGO Laboratory, the LIGO Scientific Collaboration and the Virgo Collaboration. LIGO is funded by the U.S. National Science Foundation. Virgo is funded by the French Centre National de Recherche Scientifique (CNRS), the Italian Istituto Nazionale della Fisica Nucleare (INFN) and the Dutch Nikhef, with contributions by Polish and Hungarian institutes.*
Appendix A SNR accumulation
For an ideal signal, in ideal noise and ideal data any reasonable measure of SNR should display a steady increase as more data is used. For an instrumental or environmental disturbance that does not match the signal waveform, it is unlikely that one would observe the same steady accumulation of SNR. One could then think of using this SNR-accumulation “signature” to discriminate between candidates that stem from signals and ones that stem from disturbances. The purpose of this section is to caution the reader against over-interpreting SNR-accumulation curves, especially when they come from just-above-threshold candidates.
In the real world there are a number of factors that produce deviations of the SNR-accumulation with respect to the ideal case, even for an ideal signal: the noise of the instruments is not constant, so the SNR-accumulation is different than if the detectors were perfectly stable. The extreme manifestation of this is when there is no science-quality data available from one or either of the detectors for a period of time. Since the data from both detectors is coherently combined, this impacts the SNR-accumulation.
The sensitivity variations of the detectors are not completely random. For example there are evident day/night modulations, from anthropogenic activity. Since the beam-pattern functions of the instruments are not constant in time for a given source, unfortunate combinations may occur of the higher sensitivity periods being affected by higher noise. This again impacts the SNR-accumulation.
Of course there are time scales of the search set-up and of the disturbances for which some of the effects average out, but fundamentally the SNR-accumulation is the projection of a complex process affected by a number of factors, on a single figure of merit. To draw meaningful conclusions about any signal candidate based on the associated SNR-accumulation is not trivial.
One of the ways that one could characterise the SNR-accumulation is with extensive Monte Carlos, using fake signals on the real data. Our past attempts to find a safe and effective veto for just-above threshold candidates, based on SNR-accumulation for all-sky searches, have not been successful, and we are not aware of any SNR-accumulation veto being systematically incorporated in any all-sky search.
SNR-accumulation becomes more reliable as the signal strength increases, “washing-out” all other effects. But the loud-signal regime is not particularly interesting in the O2 data because we do not expect to observe very loud signals: after all, no continuous wave signals have been detected in any data collected earlier. For this reason we have not revisited the question of setting up a veto based on SNR-accumulation for this search.
The Falcon pipeline stores SNR-accumulation data for all outliers, for historical reasons (from past attempts to construct vetoes) and to highlight whether very egregious deviations exist, that sometimes point to very evident disturbances that can be easily identified in the strain data.
While this was not the case for the two outliers of Table I, their behaviour was also not what is expected for loud signals. For the interested reader, in this section we show the SNR-accumulation plots for the outliers. We think that it is though necessary to provide some sense of the broader context for these and so we also show SNR-accumulation plots for fake signals.

We partition the O2 data into 15 chunks of equal duration; we perform searches like the last stage of our search with different durations. Specifically we consider 15 durations, for each using the first chunks.
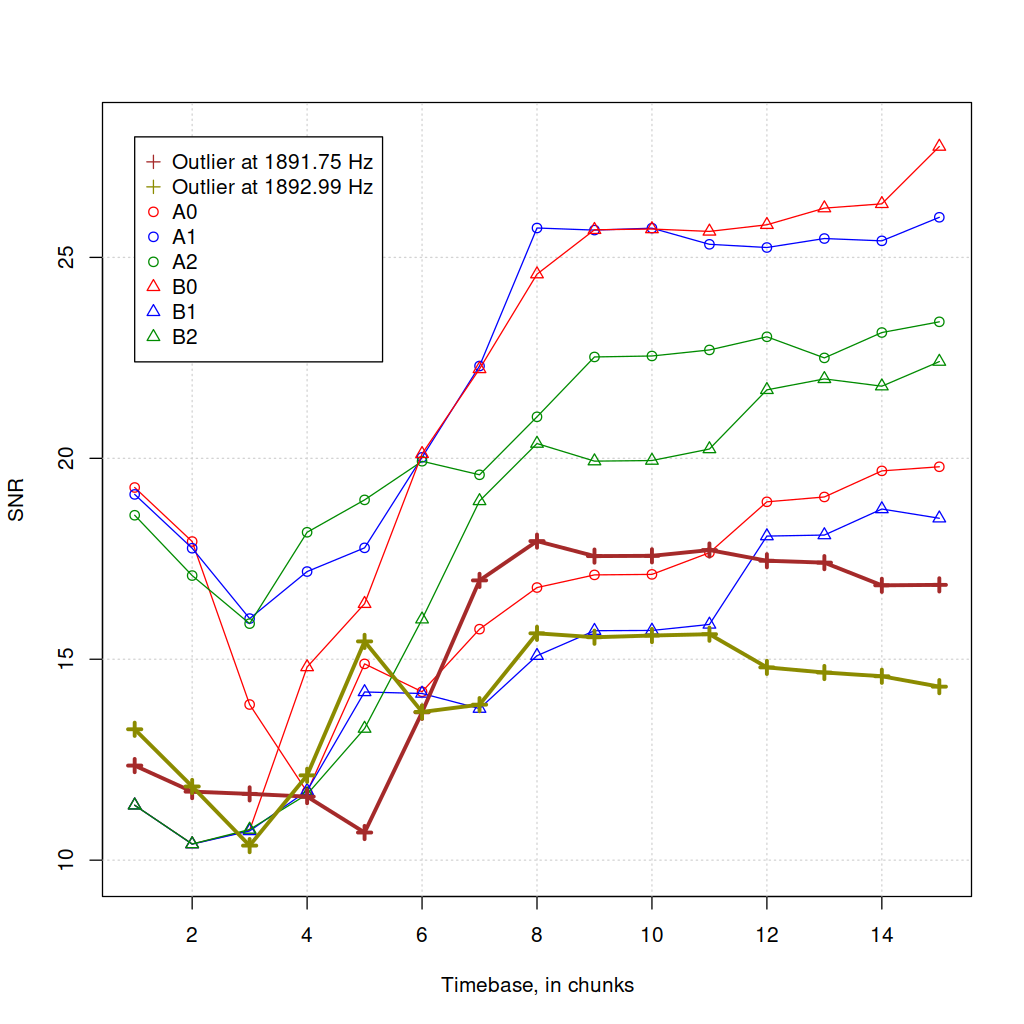
Figure 5 shows the SNR-accumulation for the hardware injected signal ip14. This is a simulated pulsar signal introduced into the strain channel by artificially moving the mirrors. With an intrinsic strain amplitude of this is a rather loud signal for our search, reaching SNR of when using all the data. For reference our population-average upper limit at that frequency is . The LVC search lvc_O2_allsky does not extend beyond 1922 Hz, but extrapolating the upper limit at that frequency at , we conclude that this signal would be detectable by that search as well.
We see that the SNR increases with increasing data, but does not follow a square-root law, as expected in the ideal case. It is instructive to appreciate how much the non-stationarities of the real situation impact the SNR-accumulation, even for a very loud signal.
Figure 6 shows the SNR-accumulation plot of the outliers at 1891.75 Hz and 1892.99 Hz, together with SNR-accumulation for 6 fake signals. The fake signals have a frequency that is close to that of the outliers, so that the character of the noise is not completely different, but far away enough that the search results are completely independent: 0.5 Hz lower than the lowest-frequency outlier, i.e. at 1891.25 Hz.
The intrinsic strain amplitude of the fake signal is set to the worst-case upper limit in that frequency range. The sky-position value is set equal to that of the 1891.75 Hz outlier’s. We consider three spin-down values : Hz/s, where is the spin-down value associated with the 1891.75 Hz outlier and Hz/s is -th of the uncertainty in spin-down for outlier signals O2_falcon; Dergachev:2019wqa. We consider signals with different initial phases, namely the “A” series with phase set to at the reference time, and the “B” series with phase set to .
We observe that there is large variability in SNR depending on the signal. The outliers’ curves display smaller SNRs than the fake signals, which is to be expected, because the 95% confidence worst-case upper limit strain is larger than most detectable signal strains.

We compare the SNR-accumulation of all signals and outliers independently of their SNR value by dividing the SNR for each chunk by the SNR of the shortest chunk (the first chunk). This relative SNR is shown in figure 7. The loud hardware injection gains a factor of in SNR, consistent with timebase increase by a factor of 15. The software fake signals show smaller overall increase and this illustrates how much random fluctuations as well as the non-stationarities of the problem may impact the resulting SNR. The non-linear interaction between the analysis pipeline and the underlying noise is very hard to model for small signals.
In conclusion, the SNR-accumulation curve can be of help for very loud signals, and is a diagnostic tool that may help to identify egregious disturbances. Based on extensive studies we have in the past found that it is hard to find a safe and reliable veto based on such plots for candidates with SNR of and smaller. The small-scale studies reported here, focused around the outliers’ parameters, support that conclusion.
References
- (1)
- (2) P. Jaranowski, A. Krolak and B. F. Schutz, “Data analysis of gravitational - wave signals from spinning neutron stars. 1. The Signal and its detection,” Phys. Rev. D 58 (1998), 063001 doi:10.1103/PhysRevD.58.063001 [arXiv:gr-qc/9804014 [gr-qc]].
- (3) V. Dergachev, M. A. Papa, “Results from the first all-sky search for continuous gravitational waves from small-ellipticity sources”, Phys. Rev. Lett. 125, no.17, 171101 (2020) doi:10.1103/PhysRevLett.125.171101 [arXiv:2004.08334 [gr-qc]].
- (4) F. Gittins, N. Andersson and D. I. Jones, “Modelling neutron star mountains,” [arXiv:2009.12794 [astro-ph.HE]].
- (5) G. Woan, M. D. Pitkin, B. Haskell, D. I. Jones, and P. D. Lasky, Evidence for a Minimum Ellipticity in Millisecond Pulsars, ApJL 863 L40 (2018)
- (6) V. Dergachev and M. A. Papa, “Sensitivity improvements in the search for periodic gravitational waves using O1 LIGO data,” Phys. Rev. Lett. 123, no.10, 101101 (2019) doi:10.1103/PhysRevLett.123.101101 [arXiv:1902.05530 [gr-qc]].
- (7) V. Dergachev, On blind searches for noise dominated signals: a loosely coherent approach, Class. Quantum Grav. 27, 205017 (2010).
- (8) V. Dergachev, Loosely coherent searches for sets of well-modeled signals, Phys. Rev. D 85, 062003 (2012)
- (9) V. Dergachev, Loosely coherent searches for medium scale coherence lengths, arXiv:1807.02351
- (10) LIGO Data Management Plan texttt https://dcc.ligo.org/public/0009/M1000066/025/LIGO-M1000066-v25.pdf (2017)
- (11) P. Nguyen, R. M. S. Schofield, A. Effler, C. Austin, V. Adya, et al., Environmental Noise in Advanced LIGO Detectors, arXiv:2101.09935 [astro-ph.IM]
- (12) B. P. Abbott et al. (LIGO Scientific Collaboration and Virgo Collaboration), All-sky search for continuous gravitational waves from isolated neutron stars using Advanced LIGO O2 data, Phys. Rev. D 100 024004 (2019).
- (13) D. Reitze, R. X. Adhikari, S. Ballmer, B. Barish, L. Barsotti, G. Billingsley, D. A. Brown, Y. Chen, D. Coyne and R. Eisenstein, et al. “Cosmic Explorer: The U.S. Contribution to Gravitational-Wave Astronomy beyond LIGO,” Bull. Am. Astron. Soc. 51, 035 [arXiv:1907.04833 [astro-ph.IM]].
- (14) C. Palomba et al., Direct constraints on ultra-light boson mass from searches for continuous gravitational waves, Phys. Rev. Lett. 123, 171101 (2019)
- (15) B. Haskell, J. L. Zdunik, M. Fortin, M. Bejger, R. Wijnands and A. Patruno, “Fundamental physics and the absence of sub-millisecond pulsars,” Astron. Astrophys. 620 (2018), A69 doi:10.1051/0004-6361/201833521
- (16) See EPAPS Document No. [number will be inserted by publisher] for numerical values of upper limits, outlier tables and hardware injection parameters. Also at https://www.aei.mpg.de/continuouswaves/O2Falcon500-1700
- (17) M. Baryakhtar, R. Lasenby, M. Teo, Black Hole Superradiance Signatures of Ultralight Vectors, Phys. Rev. D 96, 035006s (2017)
- (18) A. Arvanitaki, M. Baryakhtar, R. Lasenby, S. Dimopoulos, S. Dubovsky, Black Hole Mergers and the QCD Axion at Advanced LIGO, Phys. Rev. D 95, 043001 (2017)
- (19) A. Arvanitaki, M. Baryakhtar, and X. Huang, Discovering the QCD axion with black holes and gravitational waves, Phys. Rev. D 91, 084011 (2015)
- (20) S. J. Zhu, M. Baryakhtar, M. A. Papa, D. Tsuna, N. Kawanaka and H. Eggenstein, Characterizing the continuous gravitational-wave signal from boson clouds around Galactic isolated black holes, Phys. Rev. D 102, 063020 (2020)
- (21) P. B. Covas, A. Effler, E. Goetz, P. M. Meyers, A. Neunzert, M. Oliver, B. L. Pearlstone, V. J. Roma, R. M. S. Schofield, et al., Identification and mitigation of narrow spectral artifacts that degrade searches for persistent gravitational waves in the first two observing runs of Advanced LIGO, Phys. Rev. D 97 082002 (2018)
- (22) B. Steltner, M. A. Papa, H.-B. Eggenstein, B. Allen, V. Dergachev, R. Prix, B. Machenschalk, S. Walsh, S. J. Zhu, S. Kwang, Einstein@Home all-sky search for continuous gravitational waves in LIGO O2 public data, arXiv:2009.12260