Atomistic simulations of the human proteasome inhibited by a covalent ligand
Abstract
The proteasome is a large biomolecular complex responsible for protein degradation. It is under intense research due to its fundamental role in cellular homeostasis, and tremendous potential for medicinal applications. Recent data from X-ray crystallography and cryo-electron microscopy have suggested that there is a large-scale structural change upon binding of an inhibitor. We carried out atomistic molecular dynamics simulations of the native and inhibited proteasomes to understand the molecular details of the inhibition. Here we describe the technical details of the simulations and assess the quality of the trajectories obtained. The biochemical aspects of the proteasome are under further investigation and will be published elsewhere. This work was a part of the GCS-Prot project at the HLRS, run on the Cray XC40 supercomputing system.
1 Introduction
Over the many years since the pioneering studies Levitt and Warshel 1975; McCammon et al. 1977, biomolecular molecular dynamics (MD) simulations have become a valuable source of scientific data. They capture functional motions of biomolecules with high spatial and temporal resolution and bring information about dynamics and energetics. They complement classic biophysical techniques for structure determination Trabuco et al. 2008; Igaev et al. 2019, facilitate drug design Śledź and Caflisch 2018 or successfully tackle important questions of molecular biology Lindorff-Larsen et al. 2011; Kohlhoff et al. 2014; Kopec et al. 2018.
Routinely, microsecond-long trajectories of systems up to few tens of thousands atoms can be achieved on workstations equipped by the customer-class graphical processor units Kutzner et al. 2019. However, simulating larger assemblies and multi-component biomolecular complexes, such as ribosome Bock et al. 2018 or proteasome Wehmer et al. 2017, remains a challenge, and can only be done on high-performance supercomputers Nagel et al. 2019, or through distributed computing Lane et al. 2013; Chen et al. 2019.
Here, we present results of atomistic MD simulations of human proteasome on a multi-microsecond time scale. The proteasome is a stochastic 2.5 MDa nanomachine responsible for protein degradation in eukaryotic cells via the ubiquitin-proteasome pathway Saeki and Tanaka 2012. It helps maintaining the delicate balance of protein concentrations, and thus plays a fundamental role in cell life cycle. Modulation of proteasome function has a direct effect on cell homeostasis, disruption of which often leads to the cell death Rechsteiner and Hill 2005.

The proteasome contains two major functional parts: a 20S core particle (CP) and a 19S regulatory particle (RP), which together form the 26S particle depicted in Fig. 1. The CP is a barrel-shape complex of several protein subunits organized in four rings - two -rings and two -rings in a stacked arrangement. Three -subunits (, , and ) have been shown to catalyze the proteolysis. The RP consists of a base and a lid. The base is formed by a ring of six distinct ATPases associated with diverse cellular activities (AAA+), so called regulatory particle triple A proteins. The AAA+ works as an engine that pushes the substrate into the CP Bar-Nun and Glickman 2012. In addition, several non-ATPase subunits belong to the base and are involved in the recognition of proteasome substrates. Overall, the RP lid consists of eleven different subunits, which recognize and pre-processes protein substrate before it is transferred into CP for degradation.
Large amounts of structural information have been gathered since the proteasome discovery. Recently, several groups have determined the 26S proteasome structure at atomic or near-atomic resolution Haselbach et al. 2017; Schweitzer et al. 2016; Huang et al. 2016; Chen et al. 2016. Despite the continuous efforts, some parts of RP still remain unresolved, mostly due to their high inherent mobility. Understanding the proteasome structure and function poses a fundamental scientific challenge. However, the proteasome is under intensive investigation also due to a tremendous potential for medicinal applications Bedford et al. 2011; Kisselev et al. 2012.
Oprozomib (OPR) Demo et al. 2007 is one of the ligands which have already reached the market as potent anti-cancer agents. The X-ray crystal structure of the CP-OPR complex, resolved at resolution of 1.8 Å, revealed two OPR molecules in the CP – one per each of the two -subunits. Remarkably, the inhibited CP structure is highly similar to the structure of native CP (at 1.9 Å) Schrader et al. 2016. The protein backbone root-mean-square deviation (RMSD) is only 0.4 Å, hence the inhibitors do not induce marked structural changes of the CP.
However, based on cryo-electron microscopy (cryo-EM) structures of the 26S proteasome, it has been recently suggested that the RP undergoes a large conformational change upon inhibition Haselbach et al. 2017. When OPR is bound to the CP 5-subunits, the RP rotates by about 25∘ into a non-productive state. Intriguingly, the drug binding triggers an allosteric signal which is transferred and amplified over a distance larger than 150 Å, while keeping the (average) structure of the CP almost intact. Our main objective is to understand the atomic details of the CP-RP mutual motion possibly triggered by the OPR binding.
Here we present the computational details of our MD simulations performed on HLRS Hazel Hen, and assess the quality of the trajectories obtained.
2 Methods
2.1 Simulated Systems
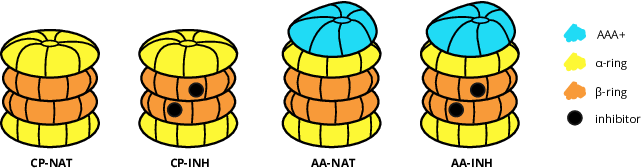
We have built four proteasome constructs: native CP, inhibited CP, native AA, and inhibited AA, where AA stands for a CP with one AAA+ ring (Fig. 2). The inhibited AA structure was prepared from the available cryo-EM data (PDB 5m32 Haselbach et al. 2017). The dangling N-terminal -helices of the AAA+ regulatory subunits 6A, 6B, 8 and 10 (UniProt naming convention) were omitted. Where needed, the CP subunits were completed by missing amino acids to keep the up-down sequence symmetry of the pairs of - and -rings. By removing the two inhibitors from the inhibited AA, we prepared the native AA structure. Experimentally determined coordinates of water molecules, K+, Mg2+ and Cl- ions were taken from the X-ray data (PDB 5le5 Schrader et al. 2016) and added after superimposing the backbone atoms of the CP. Each of the six AAA+ subunits contained one adenosine diphosphate as found in the cryo-EM model.
Each construct was placed into a periodic rhombic dodecahedron box of sufficient size such that the distance between the solute and box faces was not shorter than 1.5 nm. The system was dissolved in a solution of K+ and Na+ ions of the excess concentrations of 139 mM and 12 mM, respectively, and neutralized by Cl- anions. In total, the simulations contained about 0.8 and 1.6 million atoms, for the CP and AA constructs, respectively.
2.2 Simulation Setup
Molecular dynamics simulations were carried out using classical interaction potentials. A standard version of the Amber force field was used for the proteasome Lindorff-Larsen et al. 2010. The OPR was parametrized together with its covalently bound N-terminal threonine in the spirit of the Amber family of force fields, using fitted partial atomic charges from the Restricted Electrostatic Potential method Bayly et al. 1993, and General Amber Force Field parameters Wang et al. 2004. The TIP3P water model Jorgensen et al. 1983 and ion parameters by Joung and Cheatham Joung and Cheatham 2008 were used.
Newton’s equations of motion were integrated using the leap-frog algorithm. All bonds were constrained to their equilibrium lengths using the parallel LINCS algorithm of the sixth order Hess 2008. Hydrogen atoms were converted into virtual sites Berendsen and Van Gunsteren 1984 which allowed using 4-fs integration time step in the production simulations. Electrostatic interactions were treated by the Particle Mesh Ewald method Darden et al. 1993 with the direct space cut-off of 1.0 nm and 0.12 nm grid spacing. Van der Waals interactions, described by the Lennard-Jones potential, used a cut-off of 1.0 nm.
The systems were equilibrated in several steps. First, each system was thoroughly energy minimized. In some instances, the virtual-site model caused crashes, thus for the minimization a model with explicit hydrogen atoms and flexible water molecules was used. Second after minimizing water molecules in roughly 50,000 steps of the steepest descent algorithm, the water was heated from 10 K to 300 K in a 5-ns long constant-volume MD simulation, where two thermostats were used separately for the solute and solvent. Velocities were selected randomly from the Maxwell-Boltzmann distribution at the given temperature. Moreover during heating, the solute heavy atoms were restrained by harmonic potential to their starting coordinates with the force constant of 5000 kJ mol-1 nm-2. Next, the density of the system was equilibrated in a 20-ns long constant-pressure MD simulation at 300 K and 1 bar, where v-rescale thermostat Bussi et al. 2007 and Berendsen barostat Berendsen et al. 1984 were used. During this step, the solute was still restrained. Finally, the position restraints were gradually released in a 50 ns-long simulation, where the force constant was interpolated between its initial value and zero.
In production runs, the isobaric-isothermal statistical ensembles were generated at 300 K and 1 bar using the v-rescale thermostat and Parrinello-Rahman barostat Parrinello and Rahman 1981, respectively. We simulated roughly 4 microseconds per trajectory with the exception of the CP-INH, where the length was increased up to 5.6 microseconds. For validation of the observed phenomena, another set of simulations was carried out. This started from the final conformation of the inhibited proteasome simulations, where the inhibitor was removed. Due to technical reasons, only the coordinates of the solute were kept, whereas the water and ions were added from scratch in the same manner as with the simulations initiated from the experimental conformation.
2.3 Software Details
The simulations were carried out in the GROMACS 2016 package Abraham et al. 2015. It is a well-established, highly-optimized C/C++ code released under Lesser General Public License. Initially, we used the standard module available on HLRS Hazel Hen supercomputer. After removal of version 2016 from the list of supported modules, we used a self-compiled version with very similar performance characteristics.
GROMACS uses a mixed MPI/OpenMP parallelization which may scale down to “few tens of atoms per core” Abraham et al. 2015. In our case, the scaling was better for the larger AA than smaller CP construct (Fig. 3). For the production runs, we employed 128 or 256 nodes with two 12-core Intel Xeon (Haswell gen.) processors each. For each system, four independent trajectories initiated with different velocities from the Maxwell-Boltzmann distribution were generated. To improve scaling, bundles of the four simulations were run as a single aprun argument.

Memory requirements were rather low, our system consumed about 600 MB of memory per MPI task (for the AA construct) comprising several OpenMP threads.
The simulations generated large amounts of data compressed to a high degree at the level of GROMACS output routines. GROMACS allows checkpoint-file dependent restarts of the simulations so the simulations were run as chained jobs to fit the maximum runtime of 24 hours on Hazel Hen. Due to our interest in the solute behavior and limited disk space, we saved the water coordinates less frequently (100 ps) than the coordinates of the solute (10 ps). Each chain step produced a portion of solute trajectory of about 5.5 GB. Due to the limited disk space, these portions were downloaded frequently to our local servers, and concatenated before the final analysis.
3 Results and Discussion
For all trajectories, we calculated the root-mean-square deviations (RMSDs) of the backbone atoms with respect to the starting proteasome conformation according to Eq. 1. The analysis was performed after a least-square alignment of the trajectory to the starting conformation using the backbone atoms of the CP subunits.
| (1) |
where is the number of atoms in a trajectory, the is position vector at time 0, i.e. the experimental structure, and is the position vector at time .
All of the trajectories appear stable within the limits of such a simple measure as RMSD. Fig. 5 shows the RMSD profiles with the averages over respective trajectories between 0.30 and 0.35 nm. These values are expected, given the size of the system (over 6,000 amino acids) and no significant drift. Similar plots for AA constructs are in Fig. 5. Here the RMSD values averaged over the trajectories are around 0.40 nm, with two instances higher than 0.45 nm. The profiles show no significant drift. Higher RMSD values are related to the size of the system (over 8300 amino acids), and to the fact that only the CP subunits were used for the alignment.


The natural sequence symmetry of the CP allowed us to assess the convergence of the simulations. The CP is free to move in the simulation box, so the structure and dynamics of the subunits in the upper and lower halves should converge to common values if the free-energy minimum is well defined.
For the CP constructs, we calculated the average conformation between 1600 and 3600 ns of each trajectory, i.e. the mean position vector x of all heavy atoms. We aligned the upper and lower halves using the backbone atoms. Then for each pair of equivalent subunits in the upper and lower half, the was calculated as follows.
| (2) |
where is the position vector of atom in the upper half, the is the position vector of the equivalent of atom in the lower half, and the sum runs over atoms on one proteasome half. If the mean structures were identical as proposed by the sequence symmetry, the would be zero. Non-zero values indicate structural variation between equivalent subunits.

Fig. 6 shows the of CP constructs obtained from the experimental structure and from the simulations. The non-zero values in the experimental structures may be related to crystal-packing effects. Moreover, there are number of surface protein loops and terminals which are flexible. Thus, the free-energy surface is expected to feature many shallow minima, so their conformation in the upper and lower halves may vary. The values from the simulations are higher, for -units by factor of about 3, for -units by factor of about 2.
Further after the least-square alignment of the backbone atoms of the two proteasome halves, we calculated distances between equivalent atoms in upper and lower halves. The histogram of shows (Fig. 7) a maximum about 0.05 nm for the crystal. For simulation, the maximum lies slightly beyond 0.1 nm and is broader. This indicates that the proteasome conformations averaged over a trajectory are structurally less symmetric than the crystal. A projection of the simulation onto the proteasome structure (Fig. 8) reveals that the largest structural variations are located in the surface loops and terminal chains. In the course of simulation time, the profiles do not diverge (Fig. 8), or even slightly improve towards shorter values.


4 Concluding Remarks
Using the Cray XC40 supercomputer, we have performed atomistic MD simulations of the proteasome, a multi-protein complex responsible for protein degradation recently used as an anti-cancer drug target. We obtained trajectories totalling 100 s in length of several systems with 0.8 and 1.6 million atoms.
Here, we have presented a technical report focused on the simulation setup, run-time performance and basic analyses. Next, we will focus on proteasome function and its regulation and will present such biochemical aspects in future texts. The trajectories obtained through the MD simulations are likely of sufficient quality to explain at atomic level what changes the inhibitor OPR triggers and how these can modulate proteasome function.
References
- Levitt and Warshel (1975) Levitt, M.; Warshel, A. Computer Simulation of Protein Folding. Nature 1975, 253, 694–698.
- McCammon et al. (1977) McCammon, J. A.; Gelin, B. R.; Karplus, M. Dynamics of Folded Proteins. Nature 1977, 267, 585–590.
- Trabuco et al. (2008) Trabuco, L. G.; Villa, E.; Mitra, K.; Frank, J.; Schulten, K. Flexible Fitting of Atomic Structures into Electron Microscopy Maps Using Molecular Dynamics. Structure 2008, 16, 673–683.
- Igaev et al. (2019) Igaev, M.; Kutzner, C.; Bock, L. V.; Vaiana, A. C.; Grubmüller, H. Automated Cryo-EM Structure Refinement Using Correlation-Driven Molecular Dynamics. eLife 2019, 8, e43542.
- Śledź and Caflisch (2018) Śledź, P.; Caflisch, A. Protein Structure-Based Drug Design: From Docking to Molecular Dynamics. Current Opinion in Structural Biology 2018, 48, 93–102.
- Lindorff-Larsen et al. (2011) Lindorff-Larsen, K.; Piana, S.; Dror, R. O.; Shaw, D. E. How Fast-Folding Proteins Fold. Science 2011, 334, 517–520.
- Kohlhoff et al. (2014) Kohlhoff, K. J.; Shukla, D.; Lawrenz, M.; Bowman, G. R.; Konerding, D. E.; Belov, D.; Altman, R. B.; Pande, V. S. Cloud-Based Simulations on Google Exacycle Reveal Ligand Modulation of GPCR Activation Pathways. Nature Chemistry 2014, 6, 15–21.
- Kopec et al. (2018) Kopec, W.; Köpfer, D. A.; Vickery, O. N.; Bondarenko, A. S.; Jansen, T. L. C.; de Groot, B. L.; Zachariae, U. Direct Knock-on of Desolvated Ions Governs Strict Ion Selectivity in K + Channels. Nature Chemistry 2018, 10, 813–820.
- Kutzner et al. (2019) Kutzner, C.; Páll, S.; Fechner, M.; Esztermann, A.; de Groot, B. L.; Grubmüller, H. More Bang for Your Buck: Improved Use of GPU Nodes for GROMACS 2018. Journal of Computational Chemistry 2019, 40, 2418–2431.
- Bock et al. (2018) Bock, L. V.; Kolář, M. H.; Grubmüller, H. Molecular Simulations of the Ribosome and Associated Translation Factors. Current Opinion in Structural Biology 2018, 49, 27–35.
- Wehmer et al. (2017) Wehmer, M.; Rudack, T.; Beck, F.; Aufderheide, A.; Pfeifer, G.; Plitzko, J. M.; Förster, F.; Schulten, K.; Baumeister, W.; Sakata, E. Structural Insights into the Functional Cycle of the ATPase Module of the 26S Proteasome. Proceedings of the National Academy of Sciences 2017, 114, 1305–1310.
- Nagel et al. (2019) Nagel, W. E.; Kröner, D. H.; Resch, M. M. High Performance Computing in Science and Engineering’18: Transactions of the High Performance Computing Center, Stuttgart (HLRS) 2018; Springer, 2019.
- Lane et al. (2013) Lane, T. J.; Shukla, D.; Beauchamp, K. A.; Pande, V. S. To Milliseconds and beyond: Challenges in the Simulation of Protein Folding. Current Opinion in Structural Biology 2013, 23, 58–65.
- Chen et al. (2019) Chen, S. et al. The Dynamic Conformational Landscape of the Protein Methyltransferase SETD8. eLife 2019, 8, e45403.
- Saeki and Tanaka (2012) Saeki, Y.; Tanaka, K. In Ubiquitin Family Modifiers and the Proteasome; Dohmen, R. J., Scheffner, M., Eds.; Methods in Molecular Biology 832; Humana Press, 2012; pp 315–337.
- Rechsteiner and Hill (2005) Rechsteiner, M.; Hill, C. P. Mobilizing the Proteolytic Machine: Cell Biological Roles of Proteasome Activators and Inhibitors. Trends in Cell Biology 2005, 15, 27–33.
- Haselbach et al. (2017) Haselbach, D.; Schrader, J.; Lambrecht, F.; Henneberg, F.; Chari, A.; Stark, H. Long-Range Allosteric Regulation of the Human 26S Proteasome by 20S Proteasome-Targeting Cancer Drugs. Nature Communications 2017, 8, 1–8.
- Bar-Nun and Glickman (2012) Bar-Nun, S.; Glickman, M. H. Proteasomal AAA-ATPases: Structure and Function. Biochimica et Biophysica Acta (BBA) - Molecular Cell Research 2012, 1823, 67–82.
- Schweitzer et al. (2016) Schweitzer, A.; Aufderheide, A.; Rudack, T.; Beck, F.; Pfeifer, G.; Plitzko, J. M.; Sakata, E.; Schulten, K.; Förster, F.; Baumeister, W. Structure of the Human 26S Proteasome at a Resolution of 3.9 Å. Proceedings of the National Academy of Sciences 2016, 113, 7816–7821.
- Huang et al. (2016) Huang, X.; Luan, B.; Wu, J.; Shi, Y. An Atomic Structure of the Human 26S Proteasome. Nature Structural & Molecular Biology 2016, 23, 778–785.
- Chen et al. (2016) Chen, S.; Wu, J.; Lu, Y.; Ma, Y.-B.; Lee, B.-H.; Yu, Z.; Ouyang, Q.; Finley, D. J.; Kirschner, M. W.; Mao, Y. Structural Basis for Dynamic Regulation of the Human 26S Proteasome. Proceedings of the National Academy of Sciences 2016, 113, 12991–12996.
- Bedford et al. (2011) Bedford, L.; Lowe, J.; Dick, L. R.; Mayer, R. J.; Brownell, J. E. Ubiquitin-like Protein Conjugation and the Ubiquitin–Proteasome System as Drug Targets. Nature Reviews Drug Discovery 2011, 10, 29–46.
- Kisselev et al. (2012) Kisselev, A. F.; van der Linden, W. A.; Overkleeft, H. S. Proteasome Inhibitors: An Expanding Army Attacking a Unique Target. Chemistry & Biology 2012, 19, 99–115.
- Demo et al. (2007) Demo, S. D. et al. Antitumor Activity of PR-171, a Novel Irreversible Inhibitor of the Proteasome. Cancer Research 2007, 67, 6383–6391.
- Schrader et al. (2016) Schrader, J.; Henneberg, F.; Mata, R. A.; Tittmann, K.; Schneider, T. R.; Stark, H.; Bourenkov, G.; Chari, A. The Inhibition Mechanism of Human 20S Proteasomes Enables Next-Generation Inhibitor Design. Science 2016, 353, 594–598.
- Lindorff-Larsen et al. (2010) Lindorff-Larsen, K.; Piana, S.; Palmo, K.; Maragakis, P.; Klepeis, J. L.; Dror, R. O.; Shaw, D. E. Improved side-chain torsion potentials for the Amber ff99SB protein force field. Proteins: Structure, Function, and Bioinformatics 2010, 78, 1950–1958.
- Bayly et al. (1993) Bayly, C. I.; Cieplak, P.; Cornell, W.; Kollman, P. A. A Well-Behaved Electrostatic Potential Based Method Using Charge Restraints for Deriving Atomic Charges: The RESP Model. The Journal of Physical Chemistry 1993, 97, 10269–10280.
- Wang et al. (2004) Wang, J.; Wolf, R. M.; Caldwell, J. W.; Kollman, P. A.; Case, D. A. Development and Testing of a General Amber Force Field. Journal of Computational Chemistry 2004, 25, 1157–1174.
- Jorgensen et al. (1983) Jorgensen, W. L.; Chandrasekhar, J.; Madura, J. D.; Impey, R. W.; Klein, M. L. Comparison of Simple Potential Functions for Simulating Liquid Water. The Journal of Chemical Physics 1983, 79, 926–935.
- Joung and Cheatham (2008) Joung, I. S.; Cheatham, T. E. Determination of Alkali and Halide Monovalent Ion Parameters for Use in Explicitly Solvated Biomolecular Simulations. The Journal of Physical Chemistry B 2008, 112, 9020–9041.
- Hess (2008) Hess, B. P-LINCS: A Parallel Linear Constraint Solver for Molecular Simulation. Journal of Chemical Theory and Computation 2008, 4, 116–122.
- Berendsen and Van Gunsteren (1984) Berendsen, H. J. C.; Van Gunsteren, W. F. In Molecular Liquids: Dynamics and Interactions; Barnes, A. J., Orville-Thomas, W. J., Yarwood, J., Eds.; NATO ASI Series; Springer Netherlands: Dordrecht, 1984; pp 475–500.
- Darden et al. (1993) Darden, T.; York, D.; Pedersen, L. Particle Mesh Ewald: An Nlog(N) Method for Ewald Sums in Large Systems. The Journal of Chemical Physics 1993, 98, 10089–10092.
- Bussi et al. (2007) Bussi, G.; Donadio, D.; Parrinello, M. Canonical Sampling through Velocity Rescaling. The Journal of Chemical Physics 2007, 126, 014101.
- Berendsen et al. (1984) Berendsen, H. J. C.; Postma, J. P. M.; van Gunsteren, W. F.; DiNola, A.; Haak, J. R. Molecular Dynamics with Coupling to an External Bath. The Journal of Chemical Physics 1984, 81, 3684–3690.
- Parrinello and Rahman (1981) Parrinello, M.; Rahman, A. Polymorphic Transitions in Single Crystals: A New Molecular Dynamics Method. Journal of Applied Physics 1981, 52, 7182–7190.
- Abraham et al. (2015) Abraham, M. J.; Murtola, T.; Schulz, R.; Páll, S.; Smith, J. C.; Hess, B.; Lindahl, E. GROMACS: High Performance Molecular Simulations through Multi-Level Parallelism from Laptops to Supercomputers. SoftwareX 2015, 1-2, 19–25.