Patient similarity: methods and applications
Abstract
Patient similarity analysis is important in health care applications. It takes patient information such as their electronic medical records and genetic data as input and computes the pairwise similarity between patients. Procedures of typical a patient similarity study can be divided into several steps including data integration, similarity measurement, and neighborhood identification. And according to an analysis of patient similarity, doctors can easily find the most suitable treatments. There are many methods to analyze the similarity such as cluster analysis. And during machine learning become more and more popular, Using neural networks such as CNN is a new hot topic. This review summarizes representative methods used in each step and discusses applications of patient similarity networks especially in the context of precision medicine.
1 Introduction
With the development of digital healthcare systems and high throughput laboratory technologies, a variety of patient-specific data such as diagnoses, treatment records, biochemical tests, genetic information become electronically available[Koh15]. On the other hand, lacking qualified and specialized physicians has become a problem in many parts of the world. Ability to automatically build a patient similarity network without incurring additional efforts physicians can improve the efficiency of our health care systems and benefit both patients and hospitals. One field that patient similarity would contribute to is precision medicine. According to the Precision Medicine Initiative, precision medicine is "an emerging approach for disease treatment and prevention that takes into account individual variability in genes, environment, and lifestyle for each person"[GAV+18]. Putting it differently, precision medicine is the personalization of health care.
There is general public enthusiasm around harnessing the personalized information in big data collected from electronic medical records, human genome sequencing, environmental factors, and many other aspects [MIT14]. With the right patient similarity network built from large scale data in place, physicians can retrieve a cohort of similar patients for a target patient based on the case of study, make medical comparisons and, thereafter, make personalized treatment plan effectively. One goal of precision medicine is to build quantitative models that could assist clinical decision making[MJA+12, Koh15].However, clinical decision support systems that assist physicians in interpreting complex patient data typically operate on a per-patient basis. This strategy does not exploit the extensive latent medical knowledge from the whole database and multiple data types. The emergence of large digital systems offers the opportunity to integrate population information actively into these tools. Patient similarity analysis is one way to utilize recently available digital data sets and facilitates integration from the whole database and multiple data types for data-driven medical decision making.
The patient similarity could take both phenotypic and genotypic data into account including but not limited to the electronic medical record, social media data, genomics, transcriptomics, proteomics, microbiomics, and other “omics”. When it comes to technical details, patient data types are often heterogeneous which means data types can exist in different forms such as continuous numerical, categorical, binary, and temporal. Patient similarity analytics calculate the similarity between each pair of patients based on these heterogeneous data. Therefore, one of the first steps to consider inpatient similarity analysis is data integration. After the data integration strategy is decided, the next step is to define a patient similarity metric so that distance or similarity scores between patients can be calculated in a systematic and consistent manner. Many analyses can be done after a patient similarity network is built but one common next step is to cluster patient-based similarity scores or define a group of patients that are most similar to the target patient (Figure 1). In this review, applications of patient similarity and each of the technical steps mentioned above is explored.
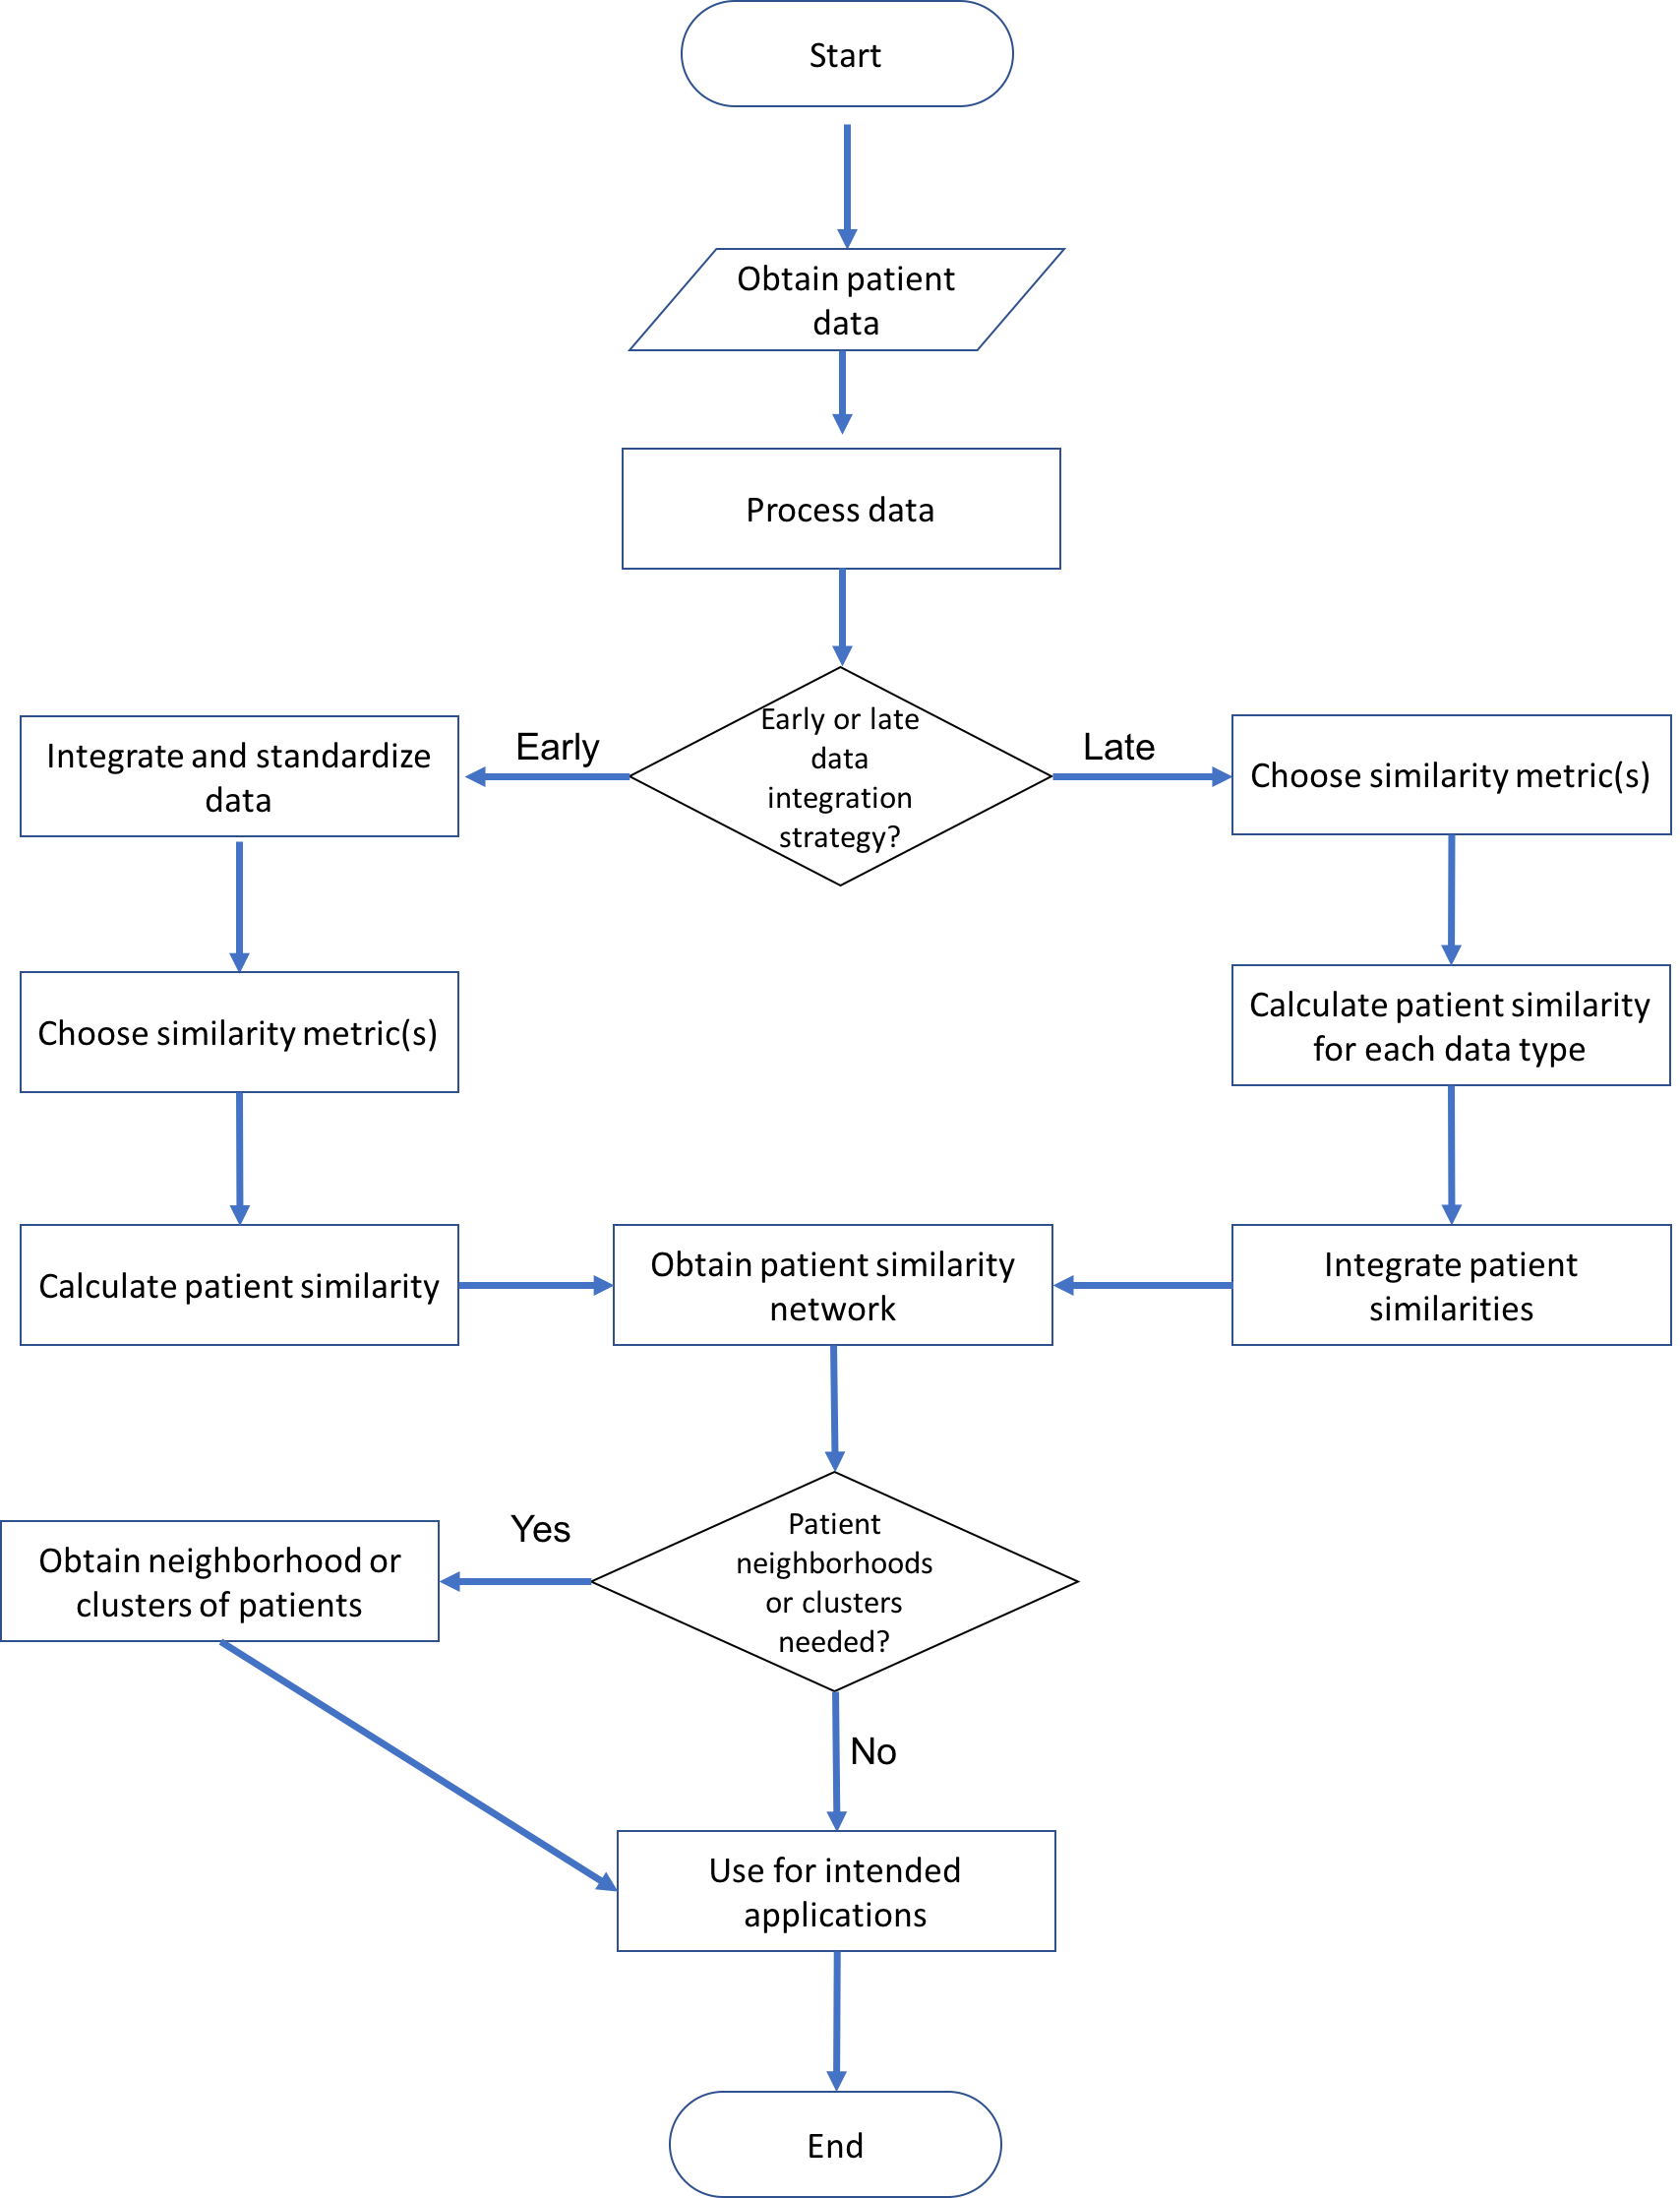
2 Values and applications of patient similarity networks
The effective utilization of different data about patients is important for medical activities such as physician decision support, comparative effectiveness research, disease modeling, and policymaking. Patient similarity measurements could possibly make contributions to these activities.
2.1 Patient and disease sub-typing
Patient similarity has been used to identify sub-types of diseases. In the case of glioblastoma multiforme, patient similarity networks have been used to identify patient sub-groups, including a patient subgroup with a substantially more favorable prognosis and patients with favorable responses to the drug temozolomide[WMD+14]. The patient similarity was also used to obtain distinct subtypes of type 2 diabetes, each of which is associated with different diseases and specific genetic mutations. Similar sub-typing or grouping approaches have been applied to many other diseases like lung pneumonitis.[LCG+15, TPHW15, Koh82, CZY+08].
2.2 Personalized medical predictive models
Medical prediction is one of the key applications of big data, artificial intelligence, and other modern technologies in health care. Instead of one-fits-all approaches, medical outcome prediction and decision making based on personalized models could be more accurate, especially when the amount of data available is limited [LPS+17, LMD15]. Patient similarity analysis would facilitate the development of personalized medical prediction. One such example is mortality prediction in intensive care units(ICUs) where patient similarity has been to boost the power of the model by using only patients most similar to the target patient in model training [LMD15]. Also, a patient similarity network has been used to develop an automated method to infer an individual patient’s discharge diagnosis based on electronic medical record [GSR+13].
It has been suggested that network-based prediction which takes advantage of using the whole network of a patient sometimes has better performance than just using a subgroup of patients [WMD+14].Therefore, it is often worth the time and effort to conduct a systematic patient similarity analysis to obtain the whole network before designing the model training strategy next step.
2.3 Personalized treatment design
Patient similarity has also been used to design personalized treatment. Using techniques such as label propagation, the effectiveness of different treatments can be estimated for each patient using information from patient similarity network, drug-drug similarity network, and patient-drug prior association. This strategy has been used to study hypercholesterolemia patients’ responses to different treatments [ZWHS14].
In addition to the three types of networks mentioned above, many other data types could be utilized for personalized treatment design. These include but are not limited to disease-disease networks [KIMED+07],disease-symptom network [ZMBS14], disease-gene [KIMED+07] and gene regulatory networks[LAN17, ALPN16].
2.4 Select informative patients
Sometimes only a small portion of medical information is available for patients in a database or cohort of interest. It is often challenging to collect complete data from all patients given limited time and resources. With an established patient similarity network in hand, it is possible to decide quantitatively which patients are most informative to make a medical decision or build a predictive model. In research on breast and diabetes, patient similarity networks derived from electronic medical records have been used to select potentially more informative patients from the population for experts to give feedback. Similar methods have been applied to analyze Alzheimer’s disease using patient similarity estimated from MRI brain scan. [QWC+15].

3 Data integration strategies
The massive clinical and biological data around patients are highly heterogeneous. This means the data exist in different forms such as numeric values, categorical values, temporal waves, medical images. Although there are many similarity learning algorithms, they typically work with a single type of data. The first step in patient similarity analysis is often to process the raw patient data so that they can be put into desired models. Therefore, one thing to consider before applying any sophisticated algorithm is how to integrate all the data of each patient. In the patient similarity analysis process, data integration can be generally categorized as early or late integration[GP15].
Early data integration strategy combines different patient features into a single dataset, usually feature vector, on which the data model is built (Figure 2 A). This often requires a transformation of data types into a common representation. This transformation process may result in information loss. Late data integration builds a model for each data type (patient feature) and then combine them into a unified model(Figure 2 B). Building models from each dataset in isolation from others disregard their mutual relations, often resulting in reduced performance of the final model
In early integration strategy, many methods represent each patient as a feature vector where refers patient and is the number of features. If is a vector of only numeric values, all patient data need to be converted into the same format such as a real number. For example, max, min, and the mean of a temporal measurement can be used. In an early feature integration strategy, A similarity metric is used to measure the similarity between patients (or distance metric can bed used which could be roughly understood as ). Further analysis can be conducted based on . There are many possible options for the metric . The choice should be informed by the problem of interest and format of input data (See details in Section 4).
In late integration strategy , instead of obtaining a distance between and , a list of similarity scores or distances are calculated for each data type. All the similarity scores or distances between and are then integrated into a a single score. Features do not need to be converted into the same format and different similarity/distance metrics can be used between for each data type. For examples, can be the euclidean distances between numeric measurement and can be the correlation between two temporal measurements. There are many ways to combine multiple similarity measures.
There is also another strategy called intermediate integration which combines data through inferring a joint model. This strategy does not require any data transformation and thus, it theoretically does not result in any information loss[GP15, LDVZK19]. However,to the best of our knowledge, intermediate data integration has not been widely used in patient similarity analysis yet.
4 Similarity/distance metrics
There is more than one way to quantitatively measure similarity or distance between each pair of patients. The methods can be generally classified into unsupervised, supervised, and semi-supervised. Unsupervised methods obtain similarity among patients directly using predefined static similarity or distance metrics to unveil hidden patterns in the datasets. In supervised approaches, "real similarity" labels are given to pairs of patients which are usually obtained from clinician experts and medical diagnoses. The patient similarity metrics are calculated according to the labels. Semi-supervised methods fall between unsupervised and supervised methods and utilized both labeled and unlabeled data. [JLDL19, KAW+20]
4.1 Unsupervised methods: static similarity/distance metrics
In early integration strategy , there are also many potential methods to measure similarity or distances between feature vectors of each pair of patient vectors( and ). One of the simplest options is Euclidean distance which measures straight line distances between points in Euclidean space. Standardization is necessary if scales of features differ.
[NSHW15].
One widely used distance metric in patient similarity study is Mahalanobis distance[LDL+13, P. 36] or variations of it[PTPP15]. The equation of Mahalanobis distance is as follow:
where is the the covariance matrix for all . Mahalanobis distance is a generalized method to measure how many standard deviations exist between two points or a a point and a distribution. Mahalnoibis distance is unit less and scale-invariant which means it is independent of the units in which the covariants are expressed. When is an identity matrix , it is equivalent to Euclidean distance.
Another similarity metric frequently used in patient similarity measurement is cosine similarity[LCG+15, LMD15, Lee16].
Since the patient similarity metric is an angle cosine, it normalizes between −1 (meaning exactly opposite) and 1 (meaning exactly the same).
Jaccard similarity coefficient is a measurement of similarity between finite sample sets and is defined as the size of intersection divided by the size of the union. Jaccard similarity was used to estimate similarity between patient vectors with binary attributes [ZWHS14].
Where is the Jaccard similarity coefficient. Patient vectors and are of the same length and with binary inputs or . is the intersection between and ,meaning attributes of the same values in the both vector. is the union of the two vectors,meaning all the attributes in each vector. is length of the vector.
In late integration strategy, similarity/distances scores for each data types are usually calculated separately and the choice of metrics are highly dependent on the type of data. For example, for scalar data, ,where . can be considered as [CCCM10]. For binary data type, the similarity score can be calculated as whether and have the same value,ie [QWC+15]. These obtained independent similarity measures can then be integrated different similarity networks in unsupervised manner using methods like network fusion or matrix factorization [WMD+14, LDVZK19, ŽZ15, ŽZ15].
4.2 Supervised patient similarity metrics
Sometimes, patient similarity analysis is highly context sensitive and depends depends on factors such as diseases and stages of diseases. An alternative to calculating patient similarity using static metrics is using metrics obtained from supervised learning. This means estimating the patient similarity according to certain ground truth label.
One such approach is to use physician’s judgment of patient similarity as gold standard. A distance metric can be designed to automatically adjust the importance of each features according to physician’s belief. In early integration strategy, one such option is to learn a generalized Mahalanobis distance which is defined as the equation below [SSHE10, SWHE12] :
Where is a by precision matrix. is the number of patients. Matrix is positive semi-definite and is used to incorporate correlations between different feature dimensions. The goal is to learn the optimal such that patients with the same label from physician’s feedback are close while the patient with different labels is away from each other. The optimal can be obtained using approaches such as decomposed Newtown’s method [JNZ09, LJI+20].
A similar approach has been used to get metrics trained using disease onset as a label. The metric obtained from this supervised learning has been shown to perform better than static metrics when used for diabetes onset prediction and risk factor profiling[NSHW15, WSLA09]. When using a late integration strategy to combine multiple similarity measures, one simple way is to assign a weight to each measure.
Where is the similarity measure for the data type between each pair of patients( and ). is the weight for the corresponding similarity measure and its value can be learned in a supervised manner using methods such as logistic regression and Cox regression [KDFH10].
4.3 Semi-supervised method
When doing medical data analysis, it is often that physician’s feedbacks or diagnosis for certain diseases is only available for some patients. This makes some of the data labeled while others are unlabeled. In this scenario, the patient similarity metric can be obtained using a semi-supervised approach. A practical method to do design a low dimensional space in which the distances between each pair of the patient are transformed into. An optimal space is identified by minimizing a cost function considering both labeled and unlabeled data. Let the original patient feature vector be . is the set of patient vectors transformed into a lower-dimensional space with and , usually [WS15, WHS12, Zho17, WRS10] . Then the objective function is:
is designed to minimize such that the distance between unlabeled patient vector with similar feature values () are small and distance between labeled pairs match the ground truth (). Methods such as PCA or local spine regression can be used to capture and weighted Euclidean distance can be used for. The exact optimization algorithms can be found in the original publications [WS15, WHS12]
4.4 Neural Network Learning
Neural Network Learning more and more popular in recent years. Neural Network is one of the machine learning algorithms to analyze image voice and some data-set contains the heavy size of data. It is a network structure composed of many simple elements. This network structure is similar to the biological nervous system and is used to simulate the interaction between living things and the natural environment. In CNN(Convolutional Neural Network), analyze Electronic Health Records will provide the similarity between all patient pairs and it can predict the health status of patients.[ZJH+19, LY20].
4.5 Active learning
The key idea of active learning is that a machine learning algorithm can achieve higher accuracy with fewer training labels if it is allowed to choose the data from which it learns. Active learning extends machine learning by allowing learning algorithms to typically query the labels from an oracle for currently unlabeled instances [QWC+15, SMY+18]. To obtain similarity metrics using supervised or semi-supervised strategies, one challenge is that getting labeled data, eg. similarity estimation from experts, in medical settings is usually expensive and time-consuming. Using an active learning strategy, such as counting set cover, to select the most informative patient pairs or groups from the cohort would make studies efficient [QWC+15, RCCXW20, ZCQ+16].
Similarity metrics metric type neighborhood/ cluster detection data integration strategy Application Publication Euclidean distance Unsupervised spectral clustering late disease sub-typing , survival risk prediction Wanget al. 2014 [WMD+14] Euclidean distance Unsupervised SOM early self-caring behaviour study for diabettes Tirunagari et al. 2015 [TPHW15] Euclidean distance Unsupervised SOM early lung radiation pneumonitis risk prediction Chen et al. 2008 [CZY+08] Euclidean distance Unsupervised SOM /Gaussian mixture model early hospital length of stay prediction Gorunescuet al. 2010 [GEDBG10] Euclidean distance in transformed space Semi-supervised KNN early heart failure prediction Wang et al.2015 [WS15] Cosine similarity Unsupervised KNN early post discharge mortality prediction Lee et al. 2015 [LMD15] Cosine similarity Unsupervised Topology based clustering early subgroups identification of type 2 daibetes Li et al. 2015 [LCG+15] Cosine similarity Unsupervised Weighted sampling early post discharge mortality prediction Lee et al. 2016 [Lee16] Tanimoto coefficient Unsupervised N.A. early personalized treatments for hypercholesterolemia Zhang et al.2014 [ZWHS14] Mahalanobis distance Unsupervised KNN early predict survival curve of kidney transplantation Lowsky et al. 2013 [LDL+13] Mahalanobis distance Unsupervised K-means/ hierarchical clustering/supervised classification early hear failure therapy recommendation Panahiazar et al. 2015 [PTPP15] low rank Mahalanobis distance Unsupervised/ Semi-supervised KNN early congestive heart failure prediction Wang et al.2012 [WSE12] generalized Mahananobis distance Supervised KNN early classify arterial hypotensive episode Sunet al. 2010 [SSHE10] generalized Mahananobis distance Supervised KNN , K-means early combine feedbacks into patient similarity metrics Sun et al. 2012 [SWHE12] generalized Mahananobis distance Supervised KNN early diabetes onset prediction and risk profiling Ng et al. 2015 [NSHW15] Sharing diagnoses Semi-supervised fixed threshold N.A. risk prediction of multiple diseases Qianet al.2014 [QWC+15] multiple similarity metrics Unsupervised N.A. late inferring discharge diagnosis Gottlieb et al.2013 [GSR+13] multiple similarity metrics Unsupervised N.A late treatment recommendation Wang et al.2015 [WTT+15] multiple similarity metrics Supervised Supervised classification late cancer chemotherapy survival prediction Chanet al.2010 [CCCM10] multiple similarity metrics Supervised N.A. late Medical social medium recommendation Klenket al.2010 [KDFH10] patient-similarity-based model supervised KNN late medical recommendation Zhenget al. [JLDL19] Multi-modal Data for Retinal Disease Diagnosis self-supervised NA early medical and treatment recommendation Liet al.[LJI+20] GAN model for clinc treatment self-supervised GAN early medical and treatment advice Yange al.[YNY+19] Risk-based forecasting supervised NA late forecasting advice Oviedoet al.[OCQ+19] lung cancer classification supervised NA late medical advices Ahmedet al.[AABMA19]
5 Patient neighborhoods and clusters detection methods
With patient similarity network(s) in place, one common practice is to define the neighborhood of patients who are most similar to the patient of interest or divide the population into clusters.
5.1 Neighborhood
One way to define a neighborhood is to set a fixed threshold of similarity score or distance. If a patient’s similarity score is larger than the threshold or distance is smaller than the threshold, he/she is considered a neighbor to the patient of interest [QWC+15].
Another unsupervised approach is is K-nearest neighbors(KNN). K-nearest neighbors to ,, are chosen. Choice of can be chosen using heuristic methods such as separating into training and validation sets[LDL+13, WHS12, LMD15, SSHE10, NSHW15, JZD+20].
A weighted sampling of similar patients has also been used to get a neighborhood of similar patients. Firstly, pairwise similarity values between every patient and the patient of interest are calculated. A fixed number of patients are sampled from the population in a probabilistic manner using the similarity values as weights [LMD15]. The sampled patients are then used for further study. This sampling process can repeat multiple times. If each sample was used to train a separate predictive model. The approach can be considered as a form of ensemble learning.
5.2 Clusters
Sometimes, instead of identifying neighbors of the patient of interest, it is more useful to organize the patient population into clusters(or groups).
K-means algorithm is one of the most popular algorithms in current use due to its simplicity and computational speed [RBBL16].For a set of patient vectors ,K-means clustering aims to partition the n observations into K(K<=n) sets . This object is to minimize within cluster sum of squares:
The algorithm to obtain K-means clusters usually includes selecting K, randomly choosing initial means, associate each patient to means, recalculating the new centroid, and repeat until converge. As K-means is a heuristic algorithm, there is no guarantee that it will converge to a global minimum.
Another method used for patient clustering is spectral clustering [WMD+14]. Spectral clustering uses the spectrum (eigenvalues) of the similarity matrix of the data to perform dimensionality reduction before clustering in fewer dimensions. Let be the symmetric similarity matrix , where is the similarity between patient and patient (i.e between and ). A general approach is to use a standard clustering method (eg. K-means) on relevant eigenvectors of a Laplacian matrix of .
Maximuma-posteriori Dirichlet process mixtures is a method developed recently and has applied to patient clustering [RBBL16]. It is related to nonparametric Bayesian Dirichlet process mixture modeling and has a couple of advantages such as being able to automatically estimate number of clusters from the data.
Self-organizing map(SOM) is a type of artificial neural network that is trained in a unsupervised manner to conduct non-linear transformation of the input space into low dimension. Different from many other artificial neural networks, SOM uses competitive learning as opposed to error-correction learning (such as backpropagation with gradient descent). SOM uses a neighborhood function to preserve the topological features of the input space. There are two stages in using SOM , training and mapping. In training stage, the low dimensional representation (map) is built. In mapping stage, a new input is classified. A SOM consist of many neurons.Each neuron has a weight vector. The weight vector of neuron is . . is the number of output neurons. is the dimension of input vector. An input vector () is mapped by finding the the neuron with closest weight vector which can be written as
Where D is the distance measure between vectors such as Euclidean distance or Mahalanobis distance.SOM with a small number of neuron behaves similar to K-means.SOM has been used to visualize and understand to obtain similar patients clusters for diabetes , lung pneumonitis and other diseases.[TPHW15, Koh82, CZY+08]
6 Discussion and future opportunities
The patient similarity could be considered a branch of person similarity research which is a big topic. Compared with many other person similarity fields such as user preference, the amount of research that has been conducted on patient similarity is relatively limited[LMD15, BHK13, HKTR04]. There are many challenges in detecting patients’ similarities such as the heterogeneous nature of medical data and inconsistency between different data sources. Fortunately, many of the roadblocks can be simplified and conquered using technologies adapted from other fields. At the data integration stage, intermediate data integration technology such as non-negative matrix factorization methods used in studying disease-disease association and human chromatin interaction can be adapted to minimize information loss [ŽJL+13, ŽZ15, LDVZK19].More similarity metrics can be introduced into detecting patient similarity, especially supervised and semi-supervised methods. At the neighborhood/cluster detection stage, many advanced technologies like growing SOM and semi-supervised clustering can be utilized[KMJRW14, ZZ10]. One important field to which patient similarity network could make a contribution to precision medicine which can be considered a special type of personalized data science. A variety of personalized data analytic has been used in fields like product recommendation and consumer credit [AT05, HH97]. Personalized data-driven clinical analysis is still a developing field. Recently, there are a couple of efforts such as applying personalized machine learning for pain prediction in medical settings [LPS+17]. With patient similarity networks in place, a lot more research can be done and many modern technologies such as domain adaptation and transfer learning can be applied to achieve high accuracy[GBB11].
References
- [AABMA19] Saadaldeen Rashid Ahmed Ahmed, Israa Al Barazanchi, Ammar Mhana, and Haider Rasheed Abdulshaheed. Lung cancer classification using data mining and supervised learning algorithms on multi-dimensional data set. Periodicals of Engineering and Natural Sciences, 7(2):438–447, 2019.
- [ALPN16] L. Albergante, D. Liu, S. Palmer, and T J Newman. Insights into Biological Complexity from Simple Foundations. In Mark C Leake, editor, Biophysics of Infection, pages 295–305. Springer International Publishing, Cham, 2016.
- [AT05] Gediminas Adomavicius and Alexander Tuzhilin. Toward the next generation of recommender systems: A survey of the state-of-the-art and possible extensions. IEEE transactions on knowledge and data engineering, 17(6):734–749, 2005.
- [BHK13] John S Breese, David Heckerman, and Carl Kadie. Empirical analysis of predictive algorithms for collaborative filtering. arXiv preprint arXiv:1301.7363, 2013.
- [CCCM10] L. W C Chan, T. Chan, L. F. Cheng, and W. S. Mak. Machine learning of patient similarity: A case study on predicting survival in cancer patient after locoregional chemotherapy. 2010 IEEE International Conference on Bioinformatics and Biomedicine Workshops, BIBMW 2010, pages 467–470, 2010.
- [CZY+08] Shifeng Chen, Sumin Zhou, Fang Fang Yin, Lawrence B. Marks, and Shiva K. Das. Using patient data similarities to predict radiation pneumonitis via a self-organizing map. Physics in Medicine and Biology, 2008.
- [GAV+18] Pilar Garrido, Azucena Aldaz, R Vera, MA Calleja, E de Alava, Miguel Martín, Xavier Matías-Guiu, and José Palacios. Proposal for the creation of a national strategy for precision medicine in cancer: a position statement of seom, seap, and sefh. Clinical and Translational Oncology, 20(4):443–447, 2018.
- [GBB11] Xavier Glorot, Antoine Bordes, and Yoshua Bengio. Domain adaptation for large-scale sentiment classification: A deep learning approach. In ICML, 2011.
- [GEDBG10] Florin Gorunescu, Elia El-Darzi, Smaranda Belciug, and Marina Gorunescu. Patient grouping optimization using a hybrid self-organizing map and Gaussian mixture model for length of stay-based clustering system. In 2010 IEEE International Conference on Intelligent Systems, IS 2010 - Proceedings, 2010.
- [GP15] Vladimir Gligorijević and Nataša Pržulj. Methods for biological data integration: perspectives and challenges. Journal of The Royal Society Interface, 2015.
- [GSR+13] Assaf Gottlieb, Gideon Y. Stein, Eytan Ruppin, Russ B. Altman, and Roded Sharan. A method for inferring medical diagnoses from patient similarities. BMC Medicine, 11(1), 2013.
- [HH97] D. J. Hand and W. E. Henley. Statistical classification methods in consumer credit scoring: A review. Journal of the Royal Statistical Society. Series A: Statistics in Society, 1997.
- [HKTR04] Jonathan L. Herlocker, Joseph A. Konstan, Loren G. Terveen, and John T. Riedl. Evaluating collaborative filtering recommender systems. ACM Transactions on Information Systems, 2004.
- [JLDL19] Zheng Jia, Xudong Lu, Huilong Duan, and Haomin Li. Using the distance between sets of hierarchical taxonomic clinical concepts to measure patient similarity. BMC medical informatics and decision making, 19(1):91, 2019.
- [JNZ09] Yangqing Jia, Feiping Nie, and Changshui Zhang. Trace ratio problem revisited. IEEE Transactions on Neural Networks, 2009.
- [JZD+20] Zheng Jia, Xian Zeng, Huilong Duan, Xudong Lu, and Haomin Li. A patient-similarity-based model for diagnostic prediction. International Journal of Medical Informatics, 135:104073, 2020.
- [KAW+20] Masaki Kato, Yuko Asami, Dalia B Wajsbrot, Xuemei Wang, Matthieu Boucher, Rita Prieto, and Elizabeth Pappadopulos. Clustering patients by depression symptoms to predict venlafaxine er antidepressant efficacy: Individual patient data analysis. Journal of Psychiatric Research, 129:160–167, 2020.
- [KDFH10] Sebastian Klenk, Jürgen Dippon, Peter Fritz, and Gunther Heidemann. Determining patient similarity in medical social networks. In CEUR Workshop Proceedings, 2010.
- [KIMED+07] Goh Kwang-Il, Cusick Michael E., Valle David, Childs Barton, Vidal Marc, and Barabasi Albert-Laszlo. The human disease network. PNAS, 104:8685–8690, 2007.
- [KMJRW14] Durk P Kingma, Shakir Mohamed, Danilo Jimenez Rezende, and Max Welling. Semi-supervised learning with deep generative models. Advances in neural information processing systems, 27:3581–3589, 2014.
- [Koh82] Teuvo Kohonen. Self-organized formation of topologically correct feature maps. Biological Cybernetics, 1982.
- [Koh15] Isaac S. Kohane. Ten things we have to do to achieve precision medicine, 2015.
- [LAN17] Dianbo Liu, Luca Albergante, and Timothy J. Newman. Universal attenuators and their interactions with feedback loops in gene regulatory networks. Nucleic Acids Research, 2017.
- [LCG+15] Li Li, Wei-Yi Cheng, Benjamin S Glicksberg, Omri Gottesman, Ronald Tamler, Rong Chen, Erwin P Bottinger, and Joel T Dudley. Identification of type 2 diabetes subgroups through topological analysis of patient similarity HHS Public Access. Sci Transl Med, 7(311):311–174, 2015.
- [LDL+13] D. J. Lowsky, Y. Ding, D. K K Lee, C. E. McCulloch, L. F. Ross, J. R. Thistlethwaite, and S. A. Zenios. A K-nearest neighbors survival probability prediction method. Statistics in Medicine, 32(12):2062–2069, 2013.
- [LDVZK19] Dianbo Liu, Jose Davila-Velderrain, Zhizhuo Zhang, and Manolis Kellis. Integrative construction of regulatory region networks in 127 human reference epigenomes by matrix factorization. Nucleic acids research, 47(14):7235–7246, 2019.
- [Lee16] Joon Lee. Personalized mortality prediction for the critically ill using a patient similarity metric and bagging. In 3rd IEEE EMBS International Conference on Biomedical and Health Informatics, BHI 2016, pages 332–335, 2016.
- [LJI+20] Xiaomeng Li, Mengyu Jia, Md Tauhidul Islam, Lequan Yu, and Lei Xing. Self-supervised feature learning via exploiting multi-modal data for retinal disease diagnosis. IEEE Transactions on Medical Imaging, 2020.
- [LMD15] Joon Lee, David M. Maslove, and Joel A. Dubin. Personalized mortality prediction driven by electronic medical data and a patient similarity metric. PLoS ONE, 2015.
- [LPS+17] Dianbo Liu, Fengjiao Peng, Andrew Shea, Rosalind Picard, et al. Deepfacelift: interpretable personalized models for automatic estimation of self-reported pain. arXiv preprint arXiv:1708.04670, 2017.
- [LY20] Zhihuang Lin and Dan Yang. Medical concept embedding with variable temporal scopes for patient similarity. Engineering Letters, 28(3), 2020.
- [MIT14] MIT technology review. Data-Driven Health Care, 2014.
- [MJA+12] Daniel R Masys, Gail P Jarvik, Neil F Abernethy, Nicholas R Anderson, George J Papanicolaou, Dina N Paltoo, Mark A Hoffman, Isaac S Kohane, and Howard P Levy. Technical desiderata for the integration of genomic data into electronic health records. Journal of biomedical informatics, 45(3):419–422, 2012.
- [NSHW15] Kenney Ng, Jimeng Sun, Jianying Hu, and Fei Wang. Personalized Predictive Modeling and Risk Factor Identification using Patient Similarity. MIA Jt Summits Transl Sci Proc., pages 132–136, 2015.
- [OCQ+19] Silvia Oviedo, Ivan Contreras, Carmen Quirós, Marga Giménez, Ignacio Conget, and Josep Vehi. Risk-based postprandial hypoglycemia forecasting using supervised learning. International journal of medical informatics, 126:1–8, 2019.
- [P. 36] P. C. Mahalanobis. On the Generalized Distance in Statistics. Proceedings. National Institute of Sciences (India), 2(1936):49–55, 1936.
- [PTPP15] Maryam Panahiazar, Vahid Taslimitehrani, Naveen L Pereira, and Jyotishman Pathak. Using ehrs for heart failure therapy recommendation using multidimensional patient similarity analytics. Studies in health technology and informatics, 210:369, 2015.
- [QWC+15] Buyue Qian, Xiang Wang, Nan Cao, Hongfei Li, and Yu Gang Jiang. A relative similarity based method for interactive patient risk prediction. Data Mining and Knowledge Discovery, 2015.
- [RBBL16] Yordan P Raykov, Alexis Boukouvalas, Fahd Baig, and Max A Little. What to do when k-means clustering fails: a simple yet principled alternative algorithm. PloS one, 11(9):e0162259, 2016.
- [RCCXW20] Asif Rahman, Yale Chang, Bryan Conroy, and Minnan Xu-Wilson. Phenotyping with prior knowledge using patient similarity. In Machine Learning for Healthcare Conference, pages 331–351. PMLR, 2020.
- [SMY+18] Qiuling Suo, Fenglong Ma, Ye Yuan, Mengdi Huai, Weida Zhong, Jing Gao, and Aidong Zhang. Deep patient similarity learning for personalized healthcare. IEEE transactions on nanobioscience, 17(3):219–227, 2018.
- [SSHE10] Jimeng Sun, Daby Sow, Jianying Hu, and Shahram Ebadollahi. Localized supervised metric learning on temporal physiological data. In Proceedings - International Conference on Pattern Recognition, 2010.
- [SWHE12] Jimeng Sun, Fei Wang, Jianying Hu, and Shahram Edabollahi. Supervised patient similarity measure of heterogeneous patient records. ACM SIGKDD Explorations Newsletter, 2012.
- [TPHW15] Santosh Tirunagari, Norman Poh, Guosheng Hu, and David Windridge. Identifying similar patients using self-organising maps: a case study on type-1 diabetes self-care survey responses. arXiv preprint arXiv:1503.06316, 2015.
- [WHS12] Fei Wang, Jianying Hu, and Jimeng Sun. Medical prognosis based on patient similarity and expert feedback. In Proceedings of the 21st International Conference on Pattern Recognition (ICPR2012), pages 1799–1802. IEEE, 2012.
- [WMD+14] Bo Wang, Aziz M Mezlini, Feyyaz Demir, Marc Fiume, Zhuowen Tu, Michael Brudno, Benjamin Haibe-Kains, and Anna Goldenberg. Similarity network fusion for aggregating data types on a genomic scale. Nature Methods, 2014.
- [WRS10] Jionglin Wu, Jason Roy, and Walter F. Stewart. Prediction Modeling Using EHR Data. Medical Care, 2010.
- [WS15] Fei Wang and Jimeng Sun. PSF: A unified Patient similarity evaluation framework through metric learning with weak supervision. IEEE Journal of Biomedical and Health Informatics, 19(3):1053–1060, 2015.
- [WSE12] Fei Wang, Jimeng Sun, and Shahram Ebadollahi. Composite distance metric integration by leveraging multiple experts’ inputs and its application in patient similarity assessment. Statistical Analysis and Data Mining, 5(1):54–69, 2012.
- [WSLA09] Fei Wang, Jimeng Sun, Tao Li, and Nikos Anerousis. Two heads better than one: Metric+Active learning and its applications for IT service classification. In Proceedings - IEEE International Conference on Data Mining, ICDM, 2009.
- [WTT+15] Yu Wang, Yu Tian, Li-Li Tian, Yang-Ming Qian, and Jing-Song Li. An Electronic Medical Record System with Treatment Recommendations Based on Patient Similarity. Journal of Medical Systems, 39(5):55, 2015.
- [YNY+19] Yun Yang, Fengtao Nan, Po Yang, Qiang Meng, Yingfu Xie, Dehai Zhang, and Khan Muhammad. Gan-based semi-supervised learning approach for clinical decision support in health-iot platform. IEEE Access, 7:8048–8057, 2019.
- [ZCQ+16] Mengting Zhan, Shilei Cao, Buyue Qian, Shiyu Chang, and Jishang Wei. Low-rank sparse feature selection for patient similarity learning. In 2016 IEEE 16th International Conference on Data Mining (ICDM), pages 1335–1340. IEEE, 2016.
- [Zho17] Zhi-Hua Zhou. A Brief Introduction to Weakly Supervised Learning. National Science Review, 2017.
- [ZJH+19] Xian Zeng, Zheng Jia, Zhiqiang He, Weihong Chen, Xudong Lu, Huilong Duan, and Haomin Li. Measure clinical drug–drug similarity using electronic medical records. International journal of medical informatics, 124:97–103, 2019.
- [ŽJL+13] Marinka Žitnik, Vuk Janjić, Chris Larminie, Blaž Zupan, and Nataša Pržulj. Discovering disease-disease associations by fusing systems-level molecular data. Scientific Reports, 2013.
- [ZMBS14] Xuezhong Zhou, Jörg Menche, Albert László Barabási, and Amitabh Sharma. Human symptoms-disease network. Nature Communications, 2014.
- [ZWHS14] Ping Zhang, Fei Wang, Jianying Hu, and Robert Sorrentino. Towards personalized medicine: leveraging patient similarity and drug similarity analytics. AMIA Joint Summits on Translational Science proceedings. AMIA Joint Summits on Translational Science, 2014:132–6, 2014.
- [ZZ10] Guojin Zhu and Xingyin Zhu. The growing self-organizing map for clustering algorithms in programming codes. In Proceedings - International Conference on Artificial Intelligence and Computational Intelligence, AICI 2010, 2010.
- [ŽZ15] Marinka Žitnik and Blaž Zupan. Data fusion by matrix factorization. IEEE Transactions on Pattern Analysis and Machine Intelligence, 2015.