Metal-insulator transition in transition metal dichalcogenide heterobilayer moiré superlattices
Abstract
Moiré superlattices formed in two-dimensional semiconductor heterobilayers provide a new realization of Hubbard model physics in which the number of electrons per effective atom can be tuned at will. We report on an exact diagonalization study of the electronic properties of half-filled narrow moiré bands in which correlation strengths are varied by changing twist angles or interaction strengths. We construct a phase diagram for the bilayer, identifying where the metal-insulator phase transition occurs, estimating the sizes of the charge gaps in the insulating phase, and commenting on the nature of the transition and the importance of sub-dominant interaction parameters.
pacs
Valid PACS appear hereI Introduction
A moiré superlattice is formed when two or more van der Waals layers are stacked with small differences in lattice constant or orientation. When the isolated layers are semiconductors or semimetals, the electronic properties of the bilayer are accurately described by continuum models that have the periodicity of the moiré superlattice, thereby realizing moiré materials - artificial two-dimensional crystals in which the lattice constant is on the moiré pattern scale. One of the most attractive aspects of moiré materials is that the longer periodicity allows the number of electrons per effective atom to be tuned through large ranges with electrical gates. When the moiré minibands are flat, electronic correlations are strong and can lead to new physics. In magic angle twisted bilayer graphene, for example, strong correlations are manifested by insulating states surrounded by superconducting domes Cao et al. 2018a; Cao et al. 2018b; Lu et al. 2019; Yankowitz et al. 2019, and quantum anomalous Hall ferromagnets Sharpe et al. 2019; Serlin et al. 2020.

In this article we report on an exact diagonalization study of the moiré superlattices formed in transition metal dichalcogenide (TMD) heterobilayers in which correlated insulators and Wigner crystal states have already been observed Tang et al. 2020; Wang et al. 2020; Regan et al. 2020; Shimazaki et al. 2020; Xu et al. 2020; Jin et al. 2021; Huang et al. 2021. In heterobilayer systems, which have different two-dimensional semiconductors on opposite sides of the junction, there is an interval of energy near the band extremum within which carriers are localized in one of the two layers. For example, for WSe2 heterobilayers formed with either MoSe2 or MoS2, the carriers at the top of the valence band are localized in the WSe2 layer, but experience a periodic potential due to the moiré pattern. Spin-valley locking in WSe2 then leads to low-energy physics described by a Hubbard-like model in which spinful electrons experience a periodic potential whose extrema form a triangular lattice Wu et al. 2018; Zhang et al. 2020. We limit our attention to the case of one-electron per moiré period and focus on the metal to insulator phase transition (MIT) Imada et al. 1998; Mott 1973 that is expected to occur when interactions become strong compared to moiré miniband widths.
The bilayer is described by a continuum model that depends on moiré potential depth and on the moiré period (or equivalently the twist angle), which determine the kinetic energy scale and interaction energy scale . Our main results are summarized by the phase diagram in Fig. 1, which is controlled by the dimensionless parameters and . We find that the metal-insulator phase transition points can be readily identified by calculating the charge gap vs. for fixed , as shown in Fig. 1(a). Repeating these calculations at different modulation strengths yields the phase diagram shown in Fig. 1(b). In order to emphasize the importance of a non-mean-field theory treatment of the metal-insulator phase transition, we have included an estimate for transition line obtained from the Hartree-Fock method applied to a groundstate without broken translational symmetry. The insulating state is favored, as expected, at large and but its stability is overestimated by the Hartree-Fock calculation. Momentum-state occupation-number distribution functions where is the many-body ground state, plotted as insets in Fig. 1(b), clearly distinguish the two states by the presence or absence of a Fermi surface (schematically represented as a green circle). These numerical results clearly indicate that a MIT occurs at half-filling in moiré materials, demonstrating that they are an attractive platform for searches for superconductivity in doped Mott-insulators, and spin-liquid states on the insulating side of metal-insulator phase transitions. Below we first explain the technical details of our calculations and then discuss their implications.
II Moiré band model
The moiré Hamiltonian of twisted TMD heterobilayer valence bands is Wu et al. 2018
| (1) |
where is an external potential with moiré periodicity. Experimental Fallahazad et al. 2016 and theoretical Kormányos et al. 2015; Zibouche et al. 2014 values for the effective mass of valence band monolayer WSe2 vary; here we take . In the dominant harmonic approximation , where and . In this approximation the moiré modulation potential is completely characterized by strength () and shape () parameters. The potential strength depends on heterobilayer and, when strain effects are accounted for, also on twist angle. The shape parameter controls the relative depth of potential extrema locations and, as shown in Ref. Zhang et al. 2020, strongly influences the strength of particle-hole asymmetry relative to the half-filled moiré band case considered in this work. For concreteness we choose the value , estimated from ab initio calculations for WSe2/MoSe2 in Ref. Wu et al. 2018. For this the valence band potential has a single maximum centered at the AA positions of the moiré superlattice.
An example of the moiré minibands obtained by diagonalizing the Hamiltonian in Eq. (1) in a plane wave basis is shown in Fig. 2(a). Clearly, the topmost valence moiré band is well-separated and flat in this case. The width of the topmost moiré band, and the energy gap to the second moiré band are plotted as a function of twist angle and shape parameter in Fig. 2(b) and 2(c) respectively. The width increases with twist angle but is almost -independent except near and , where the bands broaden. This property is explained by Fig. 2(c). Outside of the blue regions, the topmost moiré miniband is not spectrally isolated, and any mapping to a one-band Hubbard model is inaccurate. At both and , the shape parameter value imposed by emergent symmetries in the case of -valley TMD homobilayers Angeli and MacDonald 2021, the moiré potential has two identical maxima that sit on honeycomb lattice sites, and it is therefore necessary to retain at least two bands to model the low-energy physics. As is varied there is a smooth crossover between triangular and honeycomb lattice limits, with intermediate values of providing a realizationZhang et al. 2020; Zhang et al. 2021 of charge-transfer insulator physics. In this work we limit our attention to the one-band Hubbard model case.

Using a harmonic oscillator approximation near the highest extremum, we estimate that the moiré triangular lattice hopping parameter , where is a constant, and that the on-site Coulomb interaction , where is the width of the flat band Wannier function and is the static dielectric constant. By varying the values of , and , the ratios between interaction strength and hopping can be tuned. Experimentally, the potential depth can be varied in situ by applying pressure Yankowitz et al. 2019; Yankowitz et al. 2018 or gate-controlled displacement fields Movva et al. 2018, while the dielectric environment can be modified by varying the carrier density of surrounding graphene gates Liu et al. 2021 and their separation from the active layer.
III Many-Hole Hamiltonian
Since our goal is to investigate the electronic properties of moiré materials, we simplify the many-body problem by projecting the continuum Hamiltonian to the Hilbert space of the topmost moiré miniband:
| (2) |
where creates (destroys) a hole with momentum in valley , are momentum labels, is a flat valence band single particle energy, and is a two-particle matrix element
| (3) |
The Coulomb long-range interaction is given by and is an interaction strength parameter related to the two-dimensional system’s three-dimensional dielectric environment. The matrix elements are sensitive to the tails of the flat band wavefunctions at positions away from their maxima in the moiré unit cell. The size of these tails is sensitive to the confinement potential at lattice sites, which is weaker in the moiré material case than in atomic lattices. For small twist angles the interaction physics is expected to be accurately described by a model with only on-site interactions. For larger angles, however, longer range Coulomb interaction and non-local terms become more important (see Supplemental Material for further comment Sup).
IV Metal-insulator transition
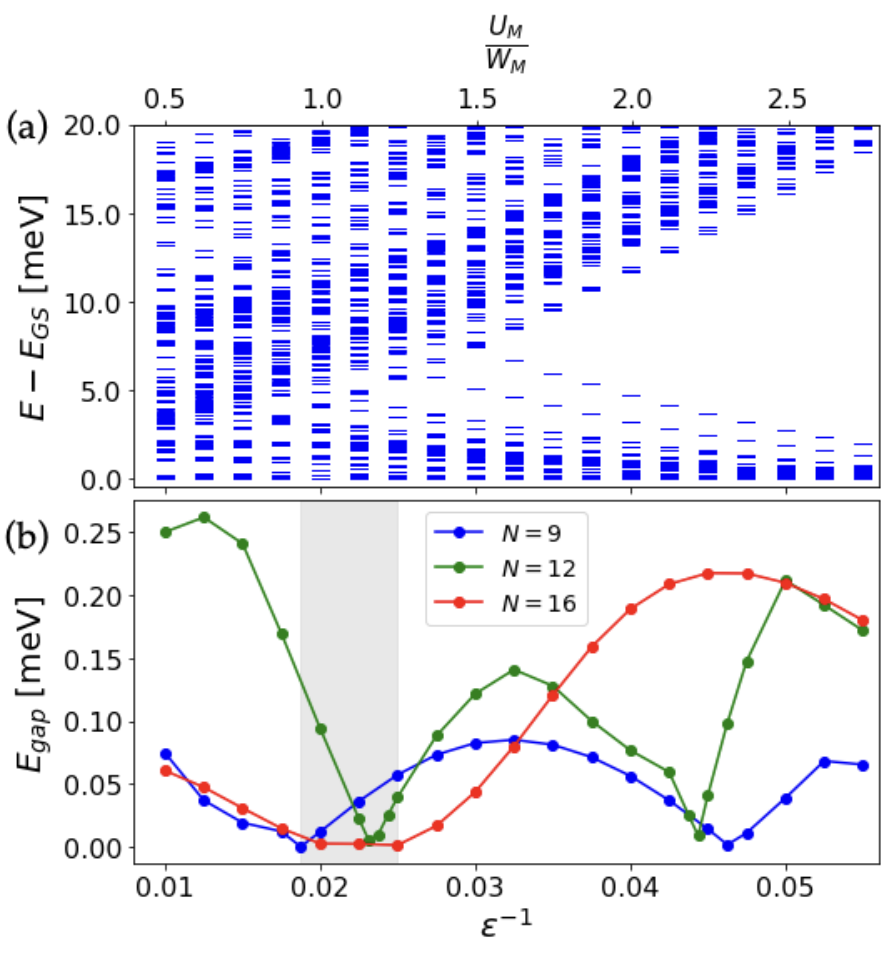
Our analysis is based on exact diagonalizations of Eq.(III) with periodic boundary conditions applied to different finite system sizes, limiting the number of momentum points in the discretized first Brillouin zone to . We note that for half-filling is also the number of particles in the spinful system. Typical results are illustrated in Fig. 3(a) where we plot the lowest 1700 many-body energies relative to the ground state as a function of for . We see a set of low-energy states separated by a Hubbard gap to higher states at strong interactions. This identifies a parameter range of insulating states where the many-body physics can be described by a spin model.
The picture of localized spins breaks down with decreasing interaction strength and a transition to a metallic phase is expected. Fig. 3(b) shows the energy gap to the first many-body excited state for system sizes and . For strong interactions, the total spin of the system is size dependent with for and , and for . The spectra for and show level crossings around , signaling a possible spin liquid intermediate phase with minimum total spin between a Fermi liquid and the strong interaction limit, as predicted for related models Shirakawa et al. 2017; Yang et al. 2010; Szasz et al. 2020. There is a level crossing in the gray-shaded region () in all three geometries, that we identify with the MIT. We have estimated the ratio between onsite Hubbard interaction and the nearest neighbor hopping integral for the shaded region, calculated from our model using Wannierization, obtaining . This estimate is consistent with previous studies of the triangular Hubbard model Shirakawa et al. 2017; Yang et al. 2010; Szasz et al. 2020. For moiré materials the precise value of is dependent on , and , because of longer range hopping and non-standard interaction terms.
To examine the MIT more directly we evaluate the charge gap , i.e., the difference between the energy to add a particle and the energy to remove a particle from a given ground state, to see if it remains finite in the thermodynamic limit. The charge gap shown in Fig. 1(a) is defined as , where
| (4) |
The values of for each potential stregth shown in Fig. 1 were obtained from extrapolations of results to (see Supplemental Material for further details Sup). The values obtained for the charge gaps in the insulating region of our phase diagram are in the order of tens of milielectronvolts, in agreement with results reported in Refs Tang et al. 2020; Wang et al. 2020. As noted earlier, these charge gap calculations show clear metal-insulator phase transitions at positions that can be accurately estimated. The insulating state is favored, as expected, at large potential strengths and at smaller twist angles, which decrease and produce a rapid decrease in band width at a fixed .

Metal-insulator transitions are more interesting when continuous but are usually first-order Shimizu et al. 2003; Kyung and Tremblay 2006; Szasz et al. 2020. In magnetically frustrated systems such as the organic compounds Furukawa et al. 2018; Shirakawa et al. 2017 metal-insulator transitions are often only weakly first-order. Some theoretical work Senthil 2008; Mishmash et al. 2015 suggests that spin liquids with a spinon Fermi surface could undergo continuous metal-insulator phase transitions, with implications for finite temperature behavior near the critical point. To address the order of the metal-insulator transition in moiré materials, we calculate the expectation value of the kinetic energy per particle, relative to the average energy of the band, . This metallic bonding energy is maximized when interactions are absent and is expected to be larger in magnitude when the system is more weakly correlated. If the transition were first-order this quantity would be discontinuous. Figure 4(a) shows the evolution of with interaction strength. At the system sizes we are able to study there is no clear signature of discontinuous behavior, suggesting that the metal-insulator phase transition in moiré materials is either continuous, or only weakly first-order. Figure 4(b) plots the numerical first derivative of with respect to interaction strength. Here we can see peaks for and in the shaded area, while for the derivative seems to be continuous. This evidence, combined with the apparently continuous vanishing of the charge gap vs. in Fig. 1(a), clearly shows that the MIT in moiré materials is not a simple strongly first order phase change.
V Discussion
The theory of metal-insulator transitions in two or more dimensions continues to be a challenge, partly because of the absence of a clear order parameter. In the case of triangular lattice systems, magnetic frustration in the insulating state adds an additional complication. A standard way to approach this problem theoretically is to study generalized single band Hubbard models in particular lattice geometries. Some layered organic compounds are believed to be described by a triangular lattice Hubbard model with on site interactions and nearest-neighbor hopping. In those systems an intermediate spin-liquid state seems to appear Shimizu et al. 2003; Yamashita et al. 2011; Kurosaki et al. 2005; Furukawa et al. 2018 in the vicinity of pressure-induced MITs. Previous numerical studies of the frustrated Hubbard model motivated by these experiments do identify the expected insulating (-Néel state) and the Fermi liquid states in the strong and weak on-site interaction limits Kyung and Tremblay 2006; Acheche et al. 2016; Shirakawa et al. 2017; Szasz et al. 2020. Between those phases an insulating phase without apparent magnetic order appears in agreement with experiment, separated from the metal by a first-order transition Szasz et al. 2020; Yang et al. 2010; Wietek and Läuchli 2017. Our calculations suggest that there is also a delicate intermediate state close to the MIT line in triangular lattice moiré materials and that the transition occurs under experimentally realizable conditions. It is clear from our numerical study that the moiré material metal-insulator transition is not strongly first order, in agreement with known properties of organic compound triangular lattice systems, in which magnetic frustration plays an important role.
The principal difference between moiré materials and atomic crystals is that the potential that attracts particles to lattice sites is bounded in the former case, and unbounded Coulomb ion-core attraction in the latter. In some cases Zhang et al. 2020; Zhang et al. 2021; Pan et al. 2020 the moiré potential can have two minima, and even two-identical minima per moiré unit cell Angeli and MacDonald 2021. One signal of this behavior is a relatively small splitting between the two topmost moiré minibands. In these cases the moiré insulator is more like a charge-transfer insulator than like a Mott-Hubbard insulator, and the minimal model for the description of its MIT includes at least two-bands. The boundary between Mott and charge-transfer insulators is set by the band structure shape parameter , as we show in Fig. 2.
Moiré materials are of special interest because of the possibility they present for in situ, tuning of relevant parameters. Most important among these is the possibility of using gates to alter the carrier density and to measure the chemical potential as a function of carrier density Tomarken et al. 2019; Lee et al. 2017. For metal-insulator phase transitions, the implication is that the charge gap at half-filling is directly measurable. Because the band-width in all heterobilayer moiré materials is very sensitive to twist angle, this knob can be used to prepare samples that are in the neighborhood of the metal-insulator transition. In situ tuning through the metal-insulator phase transition can then be achieved using gates, or pressure, or by changing gate screening properties. The prospects for unambiguous experimental determination of the order of the metal-insulator phase transition using transport Terletska et al. 2011; Reymbaut et al. 2020 and chemical potential measurements, and of the presence or absence of a spin-liquid state are excellent, and would set the stage for careful studies of weakly doped Mott insulators.
Acknowledgment – The authors acknowledge helpful interactions with Naichao Hu, Kin Fai Mak, and Jie Shan. This work was supported by the U.S. Department of Energy, Office of Science, Basic Energy Sciences, under Award DE‐SC0019481. PP acknowledges financial support by the Polish National Agency for Academic Exchange (NAWA). We acknowledge the Texas Advanced Computing Center (TACC) at The University of Texas at Austin for providing the high-performance computer resources used for our exact diagonalization calculations.
Note added – Two experimental studies of the metal-insulator phase transition in moiré superlattices have appeared on the arXiv since our original submission Li et al. 2021; Ghiotto et al. 2021.
References
- Cao et al. (2018a) Y. Cao, V. Fatemi, S. Fang, K. Watanabe, T. Taniguchi, E. Kaxiras, and P. Jarillo-Herrero, Nature 556, 43 (2018a).
- Cao et al. (2018b) Y. Cao, V. Fatemi, A. Demir, S. Fang, S. L. Tomarken, J. Y. Luo, J. D. Sanchez-Yamagishi, K. Watanabe, T. Taniguchi, E. Kaxiras, R. C. Ashoori, and P. Jarillo-Herrero, Nature 556, 80 (2018b).
- Lu et al. (2019) X. Lu, P. Stepanov, W. Yang, M. Xie, M. A. Aamir, I. Das, C. Urgell, K. Watanabe, T. Taniguchi, G. Zhang, A. Bachtold, A. H. MacDonald, and D. K. Efetov, Nature 574, 653 (2019).
- Yankowitz et al. (2019) M. Yankowitz, S. Chen, H. Polshyn, Y. Zhang, K. Watanabe, T. Taniguchi, D. Graf, A. F. Young, and C. R. Dean, Science 363, 1059 (2019).
- Sharpe et al. (2019) A. L. Sharpe, E. J. Fox, A. W. Barnard, J. Finney, K. Watanabe, T. Taniguchi, M. A. Kastner, and D. Goldhaber-Gordon, Science 365, 605 (2019).
- Serlin et al. (2020) M. Serlin, C. L. Tschirhart, H. Polshyn, Y. Zhang, J. Zhu, K. Watanabe, T. Taniguchi, L. Balents, and A. F. Young, Science 367, 900 (2020).
- Tang et al. (2020) Y. Tang, L. Li, T. Li, Y. Xu, S. Liu, K. Barmak, K. Watanabe, T. Taniguchi, A. H. MacDonald, J. Shan, and K. F. Mak, Nature 579, 353 (2020).
- Wang et al. (2020) L. Wang, E.-M. Shih, A. Ghiotto, L. Xian, D. A. Rhodes, C. Tan, M. Claassen, D. M. Kennes, Y. Bai, B. Kim, K. Watanabe, T. Taniguchi, X. Zhu, J. Hone, A. Rubio, A. N. Pasupathy, and C. R. Dean, Nature Materials 19, 861 (2020).
- Regan et al. (2020) E. C. Regan, D. Wang, C. Jin, M. I. Bakti Utama, B. Gao, X. Wei, S. Zhao, W. Zhao, Z. Zhang, K. Yumigeta, M. Blei, J. D. Carlström, K. Watanabe, T. Taniguchi, S. Tongay, M. Crommie, A. Zettl, and F. Wang, Nature 579, 359 (2020).
- Shimazaki et al. (2020) Y. Shimazaki, I. Schwartz, K. Watanabe, T. Taniguchi, M. Kroner, and A. Imamoğlu, Nature 580, 472 (2020).
- Xu et al. (2020) Y. Xu, S. Liu, D. A. Rhodes, K. Watanabe, T. Taniguchi, J. Hone, V. Elser, K. F. Mak, and J. Shan, Nature 587, 214 (2020).
- Jin et al. (2021) C. Jin, Z. Tao, T. Li, Y. Xu, Y. Tang, J. Zhu, S. Liu, K. Watanabe, T. Taniguchi, J. C. Hone, L. Fu, J. Shan, and K. F. Mak, Nature Materials (2021), https://doi.org/10.1038/s41563-021-00959-8.
- Huang et al. (2021) X. Huang, T. Wang, S. Miao, C. Wang, Z. Li, Z. Lian, T. Taniguchi, K. Watanabe, S. Okamoto, D. Xiao, S.-F. Shi, and Y.-T. Cui, Nature Physics (2021), 10.1038/s41567-021-01171-w.
- Wu et al. (2018) F. Wu, T. Lovorn, E. Tutuc, and A. H. MacDonald, Phys. Rev. Lett. 121, 026402 (2018).
- Zhang et al. (2020) Y. Zhang, N. F. Q. Yuan, and L. Fu, Phys. Rev. B 102, 201115 (2020).
- Imada et al. (1998) M. Imada, A. Fujimori, and Y. Tokura, Rev. Mod. Phys. 70, 1039 (1998).
- Mott (1973) N. F. Mott, Contemporary Physics 14, 401 (1973), https://doi.org/10.1080/00107517308210764 .
- Fallahazad et al. (2016) B. Fallahazad, H. C. P. Movva, K. Kim, S. Larentis, T. Taniguchi, K. Watanabe, S. K. Banerjee, and E. Tutuc, Phys. Rev. Lett. 116, 086601 (2016).
- Kormányos et al. (2015) A. Kormányos, G. Burkard, M. Gmitra, J. Fabian, V. Zólyomi, N. D. Drummond, and V. Fal’ko, 2D Materials 2, 022001 (2015).
- Zibouche et al. (2014) N. Zibouche, P. Philipsen, T. Heine, and A. Kuc, Phys. Chem. Chem. Phys. 16, 11251 (2014).
- Angeli and MacDonald (2021) M. Angeli and A. H. MacDonald, Proceedings of the National Academy of Sciences 118 (2021), 10.1073/pnas.2021826118.
- Zhang et al. (2021) Y. Zhang, T. Liu, and L. Fu, Phys. Rev. B 103, 155142 (2021).
- Yankowitz et al. (2018) M. Yankowitz, J. Jung, E. Laksono, N. Leconte, B. L. Chittari, K. Watanabe, T. Taniguchi, S. Adam, D. Graf, and C. R. Dean, Nature 557, 404 (2018).
- Movva et al. (2018) H. C. P. Movva, T. Lovorn, B. Fallahazad, S. Larentis, K. Kim, T. Taniguchi, K. Watanabe, S. K. Banerjee, A. H. MacDonald, and E. Tutuc, Phys. Rev. Lett. 120, 107703 (2018).
- Liu et al. (2021) X. Liu, Z. Wang, K. Watanabe, T. Taniguchi, O. Vafek, and J. I. A. Li, Science 371, 1261 (2021).
- (26) See supplemental material for a comparison between Coulomb matrix element distributions obtained from the continuum model and from nearest-neighbor triangular Hubbard model. We also include the extrapolations to the thermodynamic limit presented in the MS.
- Shirakawa et al. (2017) T. Shirakawa, T. Tohyama, J. Kokalj, S. Sota, and S. Yunoki, Phys. Rev. B 96, 205130 (2017).
- Yang et al. (2010) H.-Y. Yang, A. M. Läuchli, F. Mila, and K. P. Schmidt, Phys. Rev. Lett. 105, 267204 (2010).
- Szasz et al. (2020) A. Szasz, J. Motruk, M. P. Zaletel, and J. E. Moore, Phys. Rev. X 10, 021042 (2020).
- Shimizu et al. (2003) Y. Shimizu, K. Miyagawa, K. Kanoda, M. Maesato, and G. Saito, Phys. Rev. Lett. 91, 107001 (2003).
- Kyung and Tremblay (2006) B. Kyung and A.-M. S. Tremblay, Phys. Rev. Lett. 97, 046402 (2006).
- Furukawa et al. (2018) T. Furukawa, K. Kobashi, Y. Kurosaki, K. Miyagawa, and K. Kanoda, Nature Communications 9, 307 (2018).
- Senthil (2008) T. Senthil, Phys. Rev. B 78, 045109 (2008).
- Mishmash et al. (2015) R. V. Mishmash, I. González, R. G. Melko, O. I. Motrunich, and M. P. A. Fisher, Phys. Rev. B 91, 235140 (2015).
- Yamashita et al. (2011) S. Yamashita, T. Yamamoto, Y. Nakazawa, M. Tamura, and R. Kato, Nature Communications 2, 275 (2011).
- Kurosaki et al. (2005) Y. Kurosaki, Y. Shimizu, K. Miyagawa, K. Kanoda, and G. Saito, Phys. Rev. Lett. 95, 177001 (2005).
- Acheche et al. (2016) S. Acheche, A. Reymbaut, M. Charlebois, D. Sénéchal, and A.-M. S. Tremblay, Phys. Rev. B 94, 245133 (2016).
- Wietek and Läuchli (2017) A. Wietek and A. M. Läuchli, Phys. Rev. B 95, 035141 (2017).
- Pan et al. (2020) H. Pan, F. Wu, and S. Das Sarma, Phys. Rev. Research 2, 033087 (2020).
- Tomarken et al. (2019) S. L. Tomarken, Y. Cao, A. Demir, K. Watanabe, T. Taniguchi, P. Jarillo-Herrero, and R. C. Ashoori, Phys. Rev. Lett. 123, 046601 (2019).
- Lee et al. (2017) K. Lee, J. Jung, B. Fallahazad, and E. Tutuc, 2D Materials 4, 035018 (2017).
- Terletska et al. (2011) H. Terletska, J. Vučičević, D. Tanasković, and V. Dobrosavljević, Phys. Rev. Lett. 107, 026401 (2011).
- Reymbaut et al. (2020) A. Reymbaut, M. Boulay, L. Fratino, P. Sémon, W. Wu, G. Sordi, and A. M. S. Tremblay, “Mott transition and high-temperature crossovers at half-filling,” (2020), arXiv:2004.02302 .
- Li et al. (2021) T. Li, S. Jiang, L. Li, Y. Zhang, K. Kang, J. Zhu, K. Watanabe, T. Taniguchi, D. Chowdhury, L. Fu, J. Shan, and K. F. Mak, “Continuous mott transition in semiconductor moiré superlattices,” (2021), arXiv:2103.09779 .
- Ghiotto et al. (2021) A. Ghiotto, E.-M. Shih, G. S. S. G. Pereira, D. A. Rhodes, B. Kim, J. Zang, A. J. Millis, K. Watanabe, T. Taniguchi, J. C. Hone, L. Wang, C. R. Dean, and A. N. Pasupathy, “Quantum criticality in twisted transition metal dichalcogenides,” (2021), arXiv:2103.09796 .
Comparison between Continuum and Hubbard Coulomb matrix elements
A comparison between our TMD heterobilayer reciprocal space model and the Hubbard model on a triangular lattice can be made by looking at the distribution of two-body Coulomb matrix elements as the momentum labels are varied over the Brillouin zone. To make the comparison between moiré materials and Hubbard model systems we construct a Wannier function from the topmost moiré band wavefunctions and use it to calculate , and near-neighbor, , Hubbard parameters. Using these parameters, we define a –Hubbard model on a triangular lattice and calculate the distribution function of two-particle matrix elements at momentum conserving points in -space. Fig. 5 compares the histograms of the moiré material model and the related generalized Hubbard model for (a) and (b) with meV in a Brillouin zone mesh of 225 momentum points. For , the histograms have substantial overlap, sharing a peak near meV. If we considered approximating the moiré material by an on-site only Hubbard model, a single peak would be present near meV. The Wannier-estimation of the nearest-neighbor interaction is an order of magnitude smaller than the estimated , but for it spreads the distribution into several peaks and partially explains the differences compared to the moiré material model. We conclude that at small twist angles the moiré materials Hamiltonian is faithfully represented by a simple Hubbard model, with on-site and perhaps near-neighbor interactions. For larger angles, i.e. , the discrepancy between the models is clear, suggesting that non-local interaction terms that are normally neglected in lattice models start to play an important role. A detailed analysis of the role of long range Coulomb elements and non-local terms in moré materials is a subject of future work.

Extrapolations to the thermodynamic limit and comparison with Hartree-Fock method
We compare extrapolations to larger system sizes for quantities obtained from exact diagonalization with the corresponding extrapolations for quantities obtained from Hartree-Fock method calculations. For the Hartree-Fock calculations we assume that translational symmetry is not broken, i.e. we assume a ferromagnetic or paramagnetic groundstate, which allows access to larger system sizes. In Fig. 6(a) we show that Hartree-Fock method ground state energy per particle results for system sizes and lie in a line when plotted as function of , as do the exact diagonalization results for system sizes and discussed in the main text. The thermodynamic limit Hartree-Fock energy extrapolated from results for equals the result extrapolated from calculations at larger system sizes to within less than 1 meV per unit cell. We expect that the exact-diagonalization ground state energy results discussed in the main text have a similar accuracy. Fig. 6(b) compares charge-gap extrapolations based on ferromagnetic Hartree-Fock and exact diagonalization calculations. We see that the results follow the expected power laws accurately. In Fig. 6(c) we show how the charge gaps obtained from Hartree-Fock compare to the exact diagonalization charge gaps as a function of interaction strength. As pointed out in the MS, Hartree-Fock mean-field method tends to overestimate the stability of the insulating phase, which is manifested in larger values for and also in metal-insulator transition points at smaller values of . This discrepancy between charge gaps justifies the necessity of using a non-perturbative method like exact diagonalization in order to study physics near the metal-insulator phase transition.
