AstroSat view of IGR J17091–3624 and GRS 1915+105: decoding the ‘pulse’ in the ‘Heartbeat State’2020AstroSat view of IGR J17091–3624 and GRS 1915+105: decoding the ‘pulse’ in the ‘Heartbeat State’–References
Abstract
IGR J17091–3624 is a transient galactic black hole which has a distinct quasi-periodic variability known as ‘heartbeat’, similar to the one observed in GRS 1915+105. In this paper, we report the results of ks AstroSat observations of this source during the 2016 outburst. For the first time a double peaked QPO (DPQ) is detected in a few time segments of this source with a difference of mHz between the two peaks. The nature of the DPQ was studied based on hardness ratios and using the static as well as the dynamic power spectrum. Additionally, a low frequency (25–48 mHz) ‘heartbeat’ single peak QPO (SPQ) was observed at different intervals of time along with harmonics ( mHz). Broadband spectra in the range keV, obtained with SXT and LAXPC, could be fitted well with combination of a thermal Comptonisation and a multicolour disc component model. During AstroSat observation, the source was in the Soft-Intermediate State (SIMS) as observed with Swift/XRT. We present a comparative study of the ‘heartbeat’ state variability in IGR J17091–3624 with GRS 1915+105. Significant difference in the timing properties is observed although spectral parameters ( and keV) in the broad energy band remain similar. Spectral properties of segments exhibiting SPQ and DPQ are further studied using simple phase resolved spectroscopy which does not show a significant difference. Based on the model parameters, we obtain the maximum ratio of mass accretion rate in GRS 1915+105 to that in IGR J17091–3624 as . We discuss the implications of our findings and comment on the physical origin of these exotic variabilities.
Keywords:
accretion, accretion discs – black hole physics – X-rays: binaries – stars: individual: IGR J17091–3624, GRS 1915+105.1 Introduction
A Low Mass X-ray Binary (LMXB) is formed when matter is accreted from a nearby companion star onto a compact object such as a black hole (BH) or a neutron star (NS) (Frank et al. 2002). They are categorized as transient and persistent sources based on their outbursts studied over a period of time. Most of the LMXBs display sudden outbursts marked by increase in luminosity by a few orders of magnitude, within tens of days, and remain active for several weeks or months before decaying to quiescent phase (McClintock & Remillard 2006). It has been noticed from previous studies that the timing and spectral properties of some of the Black Hole Binaries (BHBs) display similar features during the outbursts (Miyamoto et al. 1992; Psaltis et al. 1999; Méndez et al. 2001; Belloni et al. 2011; Ingram & Motta 2020, and references therein).
The accretion dynamics close to the black hole can be studied by investigating the temporal and spectral properties of BHBs during the outbursts. The outburst begins in the hard state and thereafter transits to intermediate and high-soft state (HSS) resulting in softening of the spectrum. The source then traverses back to the hard state through intermediate states before decaying to quiescent phase (Belloni et al. 2005; Nandi et al. 2012; Nandi et al. 2018; Sreehari et al. 2019). Strong broadband noise along with Quasi-periodic Oscillations (QPOs) are seen in the Power Density Spectra (PDS) during the low-hard state (LHS) and hard-intermediate state (HIMS) while the PDS of soft-intermediate state (SIMS) and HSS are characterized by a red noise and weak/no signature of QPO features. The energy spectra are usually characterized by variations in the relative contributions of an optically thick disc and an optically thin corona produced by Comptonisation of seed photons by hotter electrons (Tanaka & Lewin 1995; Chakrabarti & Titarchuk 1995).
IGR J17091–3624 is known to be a galactic black hole (GBH) in a LMXB system. It was first discovered by INTEGRAL/IBIS in April 2003 (Kuulkers et al. 2003). The source was in outburst in 1994, 2001, 2003, 2007, 2011 and 2016 (Capitanio et al. 2009; Krimm et al. 2011; Miller et al. 2016; Sreehari et al. 2018, e.g.,) with a quiescent period of typically four years between these outbursts. It is observed that these bursts last for a couple of months. Although, mass, inclination and distance are not known precisely due to the non-detection of an optical counterpart, approximate estimates of these parameters exist through other means. Distance is estimated to be in the range of kpc (Rodriguez et al. 2011) using the luminosity at hard to soft state transition assuming mass of the black hole to be (Iyer et al. 2015, see). Better constraints on mass were obtained by Radhika et al. 2018 using two component flow model as . King et al. 2012 have proposed an inclination angle between to , the upper limit being determined by the absence of any eclipses.
The most striking feature of the source is the detection of variability classes similar to those observed in GRS 1915+105, discovered a decade earlier by WATCH onboard GRANAT (Castro-Tirado et al. 1992). GRS 1915+105 contains one of the most massive black holes among all the stellar mass black hole systems discovered so far with an estimated mass of lying at a distance of kpc (Reid et al. 2014). The light curve of this source shows a very rich class of variability pattern which have been categorized into 14 different classes based on its light curve and colour-colour diagram (Belloni et al. 2000; Klein-Wolt et al. 2002; Hannikainen et al. 2005). The exhibition of variability on time-scales from seconds to minutes makes it an interesting case study. Of all the variability classes, the -class or ‘heartbeat’ State (HS) is the most widely studied due to its uniquely structured, regular periodic profile in the X-ray light curve (Neilsen et al. 2011; Mineo et al. 2012). Comparative studies for the two similar classes of these two different sources — IGR J17091–3624 and GRS 1915+105, provide an excellent opportunity to decipher the underlying physics behind them.
IGR J17091–3624 shows morphological similarities with GRS 1915+105. During the outburst, IGR J17091–3624 revealed 9 set of variability classes of which seven are analogous to different classes observed in GRS 1915+105 (Court et al. 2017) and two are unique to the source. The most prominent pattern of the IGR J17091–3624 was the ‘heartbeat’ oscillations, similar to the -class in GRS 1915+105. A high-frequency QPO (HFQPO) having a frequency of 66 Hz was reported by Altamirano & Belloni 2012, identical to the one observed in GRS 1915+105 at Hz (Morgan et al. 1997). A low frequency feature was also noticed during the 2011 outburst as reported by Altamirano et al. 2011 with a frequency of 10 mHz initially which then evolved to QPOs in the mHz range in the later days. A similar low frequency feature was reported from s to 70 s in ‘heartbeat’ state (Capitanio et al. 2012). Pahari et al. 2014 also discovered an intermediate class before the ‘heartbeat’ class which showed variabilities between mHz and a broad range of low frequency features between to 100 mHz including the harmonics during the -class (Zhang et al. 2014). In the next outburst of 2016, such low frequency features were reported by Radhika et al. 2018 in the range of mHz. These low frequency features are considered similar to those seen in GRS 1915+105 resulting from the structured variability.
In this paper, we present the analysis of 2016 outburst of the IGR J17091–3624 observations by AstroSat using data from SXT and LAXPC instruments. A study of variabilities was carried out in the form of static and dynamic Power Density Spectrum (PDS) to look at low frequency QPOs during different phases of the bursts. We did not find any transition of states during the entire observation as the source was in soft-intermediate state (Radhika et al. 2018). We found the aperiodic burst ( mHz) resembling ‘heartbeat’ oscillation with harmonics varying between mHz, which are referred to as the ‘heartbeat’ QPOs (Altamirano et al. 2011; Pasham et al. 2013). For the first time, we observe a distinct split in this feature varying at two different frequency bands mHz and mHz in the static as well as dynamic PDS of a few segments. A very low ( mHz) frequency feature was also found along with its harmonics. Finally, the broadband spectral analysis of the source was carried out over the limited energy range keV using the SXT and LAXPC data due to the presence of another source, GX 349+2, in the LAXPC FOV (see, Sect. 2.3 for details). LAXPC data in keV was used for temporal analysis to lend more credibility to our findings with SXT data owing to its better temporal resolution. We also perform a comparative study of IGR J17091–3624 with respect to the temporal and spectral results obtained from the AstroSat observations of GRS 1915+105 in a similar state.
A summary of the procedures followed for data reduction is given in Sect. 2. The methodology considered for analysis of data from SXT and LAXPC are discussed in Sect. 3. The results obtained from the temporal and spectral analysis using phenomenological models and comparison with results from analysis of GRS 1915+105 are presented in Sect. 4. Finally, we discuss the implications of our results and summarize our findings in Sect. 5.
2 Observations & Data Reduction
The Indian multi-wavelength observatory, AstroSat, has the capability to view the sky in the X-ray band from 0.3 to 100 keV simultaneously. This can be achieved with the help of on-board co-aligned X-ray instruments — Soft X-ray Telescope (SXT) (Singh et al. 2017), Large Area X-ray Proportional Counter (LAXPC) (Antia et al. 2017) and Cadmium Zinc Telluride Imager (CZTI) (Vadawale et al. 2016). AstroSat observed IGR J17091–3624 between Apr 26, 2016 (MJD 57504.26) and Apr 27, 2016 (MJD 57505.72) for the duration of ks during a ToO observation11 1 ObsID: 20160426_T01_118T01_9000000430. We found 35 segments of Good Time Intervals (GTIs) out of which 19 segments 1 ks were considered having the total duration of ks, while the rest of GTIs were not considered due to an exposure time ks or presence of data gaps. The AstroSat data from the SXT and LAXPC instruments were used for the timing and spectral analysis. During this observation, these instruments were in their default operational modes of Photon Counting (PC) mode (SXT) and Event Analysis (EA) mode (LAXPC). SXT Level-2 data were obtained from the ISSDC data dissemination archive22 2 http://astrobrowse.issdc.gov.in/astro_archive/archive. The entire SXT observation of IGR J17091–3624 is summarized in the Table 1 where all the 19 segments with their exposure times and average count rates are also listed.
| IGR J17091–3624∗ | ||
| Segment | Exposure | SXT Avg. Rate |
| (No) | (s) | (counts s-1) |
| 01 | 1749 | |
| 02 | 2275 | |
| 03 | 2289 | |
| 04 | 2291 | |
| 05 | 2291 | |
| 06 | 1483 | |
| 07 | 2292 | |
| 08 | 2294 | |
| 09 | 1507 | |
| 10 | 1671 | |
| 11 | 1244 | |
| 12 | 993 | |
| 13 | 1324 | |
| 14 | 1455 | |
| 15 | 2294 | |
| 16 | 2296 | |
| 17 | 2296 | |
| 18 | 2296 | |
| 19 | 2296 | |
| GRS 1915+105 | ||
| Orbit | Exposure | Avg. Rate |
| (No) | (s) | (counts s-1) |
| 8118 | 1201 | (SXT) |
| 1774 | (LAXPC) | |
| *Observation log of LAXPC data of IGR J17091–3624 is not | ||
| mentioned due to contamination by the source GX 349+2. | ||
| See section 2.3 for details. Rows marked with are the | ||
| ones selected for the broadband spectral analysis. | ||
AstroSat observed the source GRS 1915+105 for a total duration of ks on 28 March 2017 as part of a Guaranteed Time (GT) proposal33 3 ObsId: 20170328_G06_033T01_9000001116. The source was found to exhibit three different variability classes in this time period (Rawat et al. 2019). It was in the class at the beginning, before undergoing a transition to the ‘heartbeat’ state through an intermediate state. ‘Heartbeat’ state was observed continuously for four orbits during this observational campaign, which amounts to an effective exposure time of 10 ks. Of these 4 orbits, we choose the orbit with longest uninterrupted GTI for both instruments. Archival data of both SXT and LAXPC have been used for broadband timing and spectral analysis. The net exposure time for the instruments were 1201 s and 1774 s, respectively (see Table 1). SXT was operated in the Photon Counting (PC) Mode for this duration while all three LAXPC units were in the Event Analysis Mode (EA).
2.1 SXT Data Reduction
For the SXT data analysis, we follow the guidelines given in the SXT user manual available at the website44 4 http://www.tifr.res.in/~astrosat_sxt/index.html. We incorporated the Level-2 data generated from the SXT pipeline version 1.4b released on 03 January 2019. The data analysis tools are downloaded from the SXT payload operation centre website along with background, spectral response and auxiliary response files (ARF) as suggested by the SXT instrument team for the analysis. All individual orbit data from PC mode were merged to generate the single clean event file using the SXT event merger script (Julia v1.0). Thereafter, the cleaned event file was used to generate the light curve and spectra between keV using XSELECT 2.4g. Offset ARF was generated for this data, to correct for the offset between SXT and LAXPC instruments, as the source pointing of the satellite was made with respect to LAXPC instrument.
For the IGR J17091–3624, the events were selected within circular region of 12 arcmin radius (blue circle) as seen in the left panel of Fig. 1. The source image is generated for the complete exposure time of ks. The core central pixel of the source registered maximum around 83 counts. The highest count rate noticed among the individual segments is 12.79 c/s (see Table 1) which is well below the pile-up limit of 40 c/s for PC mode as mentioned in the AstroSat Handbook55 5 https://www.issdc.gov.in/docs/as1/AstroSat-Handbook-v1.10.pdf.
Similarly, for the GRS 1915+105 observation, event selection was made from a circular source region with 12 arcmin radius as seen in the image on right panel of Fig. 1. The figure presented is for ks which is the GTI for entire duration of the ‘heartbeat’ state as observed by AstroSat. Of these, we choose an uninterrupted observation for 1201 s where the central pixel has a maximum counts that is below the pile-up limit of SXT.


2.2 LAXPC Data Reduction
LAXPC data were processed by LAXPC pipeline software66 6 https://www.tifr.res.in/~astrosat_laxpc/LaxpcSoft.html (laxpcl1 and backshiftv3 version 3.1) released on 4 Sep 2019. We follow Antia et al. 2017; Agrawal et al. 2018; Sreehari et al. 2019; Baby et al. 2020 to obtain the light curves and energy spectrum. IGR J17091–3624 and GRS 1915+105 light curves were generated in the energy range 3–20 keV with a time-bin of 0.01 s. All the three LAXPC units were used to generate the light curve and perform the timing analysis.
For IGR J17091–3624 and GRS 1915+105 observation, only LAXPC20 was used to generate the spectra in the energy range keV. To minimize the residuals due to instrumental effects in the spectra beyond 30 keV, we considered only the top layer of the detector along with the events reported as single detection of the event. However, contribution to the source spectra of IGR J17091–3624 from the nearby persistent source GX 349+2 cannot be ruled out during the observation. In the next section, we attempt to quantify and mitigate the effects of contamination in the IGR J17091–3624 source spectra.

2.3 Contamination from the Nearby Source GX 349+2
The left panel of Fig. 1 shows the SXT image of IGR J17091–3624 superimposed over the LAXPC FOV marked by the red square. Since the LAXPC FOV has a FWHM close to , a square having the side of marks the FOV. IGR J17091–3624 is close to the centre as seen in the SXT image along with the nearby neutron star GX 349+2 marked at RA and Dec at an angular separation of . For a comparison of the intensity of the two sources, the left panel of Fig. 2 shows the BAT light curves of IGR J17091–3624 (green points) and GX 349+2 (purple points) in the keV energy range. A contamination from a bright source out of the field of view seems to be present also in the SXT image. Rotation of the image by 110∘ aligns it in the direction of GX 349+2 source. Also, analysis of SXT observations of GX 349+2 available at a later date was performed to confirm if contribution from the source could extend to the FOV in consideration. Since no other bright X-ray sources are reported in the direction of the source for the duration of this observation, it is reasonable to assume that the contamination in the image is stray light from GX 349+2, but, in any case, it is negligible () with respect to the IGR J17091–3624 counts. The situation is different for LAXPC detector, in fact it is expected to have an efficiency of 30% of the nominal value at an angular separation of from the on-axis pointing (Antia et al. 2017). Also, an additional broad variability, absent in the SXT light curve, is seen in the LAXPC light curve for the same duration which cannot be attributed to this source. Therefore, it is possible that the LAXPC data for this duration was contaminated by the source GX 349+2. Due to lack of simultaneous observations by other imaging/pointed missions, we attempt to model and subtract the contribution from the source guided by previous studies of the source and using the off-axis response (Antia et al. 2017; Baby et al. 2020).
In order to quantify the contamination of nearby source GX 349+2 in the AstroSat observation data, we considered the results presented by Coughenour et al. 2018 on the various states of GX 349+2 source as observed by the NuSTAR observation on 6 June 2016. The corresponding MAXI 1-orbit binned light curve (red) of GX 349+2 was plotted against IGR J17091–3624 BAT 1-day binned light curve (purple) along with AstroSat observation (gray band) which are presented in the right panel of Fig. 2. We used MAXI data for reference as it was closest to AstroSat observation. The upper limit of flux for the normal (Non-flaring) branch of GX 349+2 was estimated using NuSTAR observations. The corresponding flux level in the MAXI light curve was obtained as 2.4 photons cm-2 s-1. We discard those observations where flux level is clearly above this base level as they could be in the flaring branch. Applying this rigid filter, we select four segments from the AstroSat observation that are marked with blue and green vertical lines for the broadband spectral studies. The green lines indicate the segments with detection of single peak QPO and the blue line represent the segment with double peak QPO whereas the width of lines indicate the segment duration.
Although the selected observations could be less contaminated than those closer to the flaring branch of GX 349+2, it is necessary to quantify the contribution from this source to ensure that the contamination is removed. Therefore, we generate simulated spectrum for GX 349+2 using an off-axis response at 40 based on the previous studies of the source considering it to be in the normal branch. The simulated spectrum is generated with a keV flux of ergs cm-2 s-1 (Coughenour et al. 2018) using the off-axis response. Comparison with the source spectrum obtained from LAXPC is shown in the Fig. 3. The model used to generate the simulated spectrum is TBabs(bbodyrad + diskbb + diskline). It can be seen that the contribution from GX 349+2 at an offset of (red) cannot be considered negligible. We therefore, consider this simulated spectrum as an additional background in XSPEC during spectral analysis which gives a spectrum with significant counts up to 30 keV. However, the contribution from GX 349+2 becomes significant beyond 23 keV as seen from Fig. 3. Hence, spectral analysis is performed only up to 23 keV, to rule out modification of spectral parameters due to contribution by GX 349+2 at higher energies (see, Sect. 3.2 & Table 4).


3 Analysis & Modelling
AstroSat provides us the opportunity to study the nature of IGR J17091–3624 in the broadband energy range during its 2016 outburst. However, due to the limitation mentioned in Sect. 2.3, we used the LAXPC data from keV for spectral analysis on selected observations and keV timing from LAXPC is done to emphasize the timing results from SXT. For GRS 1915+105, energy range of 0.7–7 keV for SXT and 3–40 keV for LAXPC respectively were considered for temporal and spectral analysis.
In the following subsections, we summarize the methodologies used to analyse temporal and spectral data for both these instruments.
3.1 Temporal Modelling
SXT light curve is plotted in Fig. 4a. The Hardness-Intensity Diagram (HID) is the variation of intensity with the ratio of flux in the harder to softer band. It is a diagnostic tool with which to classify different states during an outburst (Homan & Belloni 2005; Belloni et al. 2005; Nandi et al. 2012; Nandi et al. 2018; Sreehari et al. 2019). The HID obtained from Swift/XRT is shown in Fig. 4b. The AstroSat observation is marked as a star which lies in the SIMS region (Radhika et al. 2018, see). The light curves in 0.5–7 keV energy band with a time bin of 2.378 s was used to create a power spectrum of the selected segments. The powspec tool of XRONOS version 5.22 was used. A total of 256 bins per interval and 3 intervals in a frame were considered for obtaining the power spectrum in the units of (rms/mean)2/Hz. We also applied a geometric re-binning factor of 1.05. We follow this approach to fit all the PDS with multiple Lorentzian functions to model ‘heartbeat’ QPOs, its harmonics and with a power-law component whenever required. The significance of ‘heartbeat’ QPOs is estimated as the ratio between the normalization and its negative error (see Sreehari et al. 2019, and references therein).
The average power spectra generated for Segments 3 and 4 of SXT are shown in Figs. 5 & 6 (right panels). Initially, the power spectrum of Segment 3 is fitted with a Lorentzian for the fundamental ‘heartbeat’ QPO which results into a . However, with the inclusion of two more Lorentzian features, the fit improved significantly with a . Similarly, we model the power spectrum for Segment 4 with multiple Lorentzian features, considering the fundamental ‘heartbeat’ QPO feature and harmonic. The fitted result yields a . The fit significantly improved after inclusion of an additional Lorentzian for the second ‘heartbeat’ QPO which results into a . Such double peaks were observed in seven of the 19 segments considered at mHz frequencies (see Table 2 and Figs. 5 & 6).
Further, we studied the dynamic PDS using the Interactive Data language (IDL) version 8.5. Using the IDL routine WV_CWT (continuous wavelet transform) for wavelet analysis, dynamic PDS were generated for these burst profiles for Segments 3 and 4. This routine transforms the time series data to power spectrum by using the Morlet wavelet functions consisting of a complex exponential modulated by a Gaussian envelope. For the wavelet analysis, the function parameters were set to Morlet family and order to 6 (width of wavelet). The main purpose of using the dynamic power spectrum was to check if the double peak in some segment is due to variation in QPO frequency during the observation.
Similarly, the temporal analysis of LAXPC data was carried out for the energy range keV. The light curves of all the units were generated with time resolution of 0.01 s and were merged together, however, the PDS was generated for the time resolution of 0.5 s with 1024 intervals. Thus, PDS plot has a frequency range of 2 mHz – 1 Hz which is normalized to obtain the squared fractional rms variability. ‘Heartbeat’ QPOs were also observed in the LAXPC PDS at similar frequencies. Double peak frequencies profile, similar to those observed in SXT PDS were also found in the LAXPC PDS for the same segments which confirms their ‘true’ detection (see Figs. 5 & 6).
SXT PDS was generated for the same frequency range in the ‘heartbeat’ state of GRS 1915+105, whereas PDS of LAXPC data was generated with Nyquist frequency of 10 Hz, using time resolution of 0.05 s with 8192 intervals. It is normalized to obtain the squared fractional rms variability with appropriate dead-time correction applied. Both PDS are fitted with multiple Lorentzians and a power law function.


3.2 Spectral Modelling
The spectral analysis and modelling was carried out using XSPEC v12.10 tool of HEASOFT v6.26 for the SXT data in the energy range 0.7–7 keV. First, we model the IGR J17091–3624 spectrum with an absorbed multi-colour disc model diskbb (Mitsuda et al. 1984; Makishima et al. 1986). Interstellar absorption was accounted for by TBabs model. Acceptable fits were obtained with . As the source was in SIMS, where the disc extends closer to the compact object, we replace diskbb with ezdiskbb (Zimmerman et al. 2005) which considers zero-torque condition at inner disc boundary with marginal improvement in the fit. The model used was TBabs*ezdiskbb (hereafter Model 1). Further, we extended this model with broadband spectral analysis using both SXT and contamination free LAXPC spectral data (by subtracting the simulated GX 349+2 spectrum) in the 0.7–23 keV range by considering the model simpl*ezdiskbb+gaussian to account for the Comptonisation of disc photons by the optically thin corona and to investigate the presence of iron line. However, the inclusion of simpl made gain correction non-executable over SXT data. This led to poor fits with the instrumental edges at 1.8 and 2.4 keV being unaccounted for. Also, significant residuals were seen in the keV range. Thereafter, nthcomp, which is an advanced model, was applied to describe the Comptonisation component in the hard energy band. The input seed photon temperature of nthcomp was tied up with disc temperature of ezdiskbb model. Inclusion of a gaussian line at 6.4 keV resulted in better fits. The final model used was Model 2a: TBabs(ezdiskbb + gaussian + nthComp).
The broadband spectral analysis of GRS 1915+105 was performed using both SXT and LAXPC data in the 0.5–40 keV range. This broadband spectrum required an additional Gaussian line and the nthcomp model along with ezdiskbb to model the higher energy part. Gaussian was replaced by diskline model which considers line emission from a relativistic accretion disc (Fabian et al. 1989). Residuals corresponding to an absorption edge are seen in the keV range (Done et al. 2004; Sreehari et al. 2020, see). This is modelled using the smeared edge model, smedge in XSPEC (Ebisawa et al. 1994), with index for photoelectric cross-section fixed at -2.67. This improved the fit slightly with decreasing from 1.20 (571/474) to 1.18 (560/473). The edge is obtained at 8 keV with the width ranging from keV. The smearing width is therefore frozen at 3 keV for analysis. The final model used was TBabs(ezdiskbb + diskline + nthComp) which will henceforth be referred to as Model 2b.
A systematic error of 1.5% was incorporated for the combined fit for both SXT and LAXPC data. A normalization constant is considered to account for the difference in calibration of both instruments which turns out to be close to 1.
4 Results
We present the results of temporal and spectral data analysis of IGR J17091–3624 during its 2016 outburst. In Sect. 4.1, we outline the evolution of the source during the outburst and categorize the current observation with regards to its spectral state. In Sect. 4.2, 4.3 and 4.4, we present the detailed results of timing and spectral analysis along with simple Phase-Resolved Spectroscopy (PRS) respectively, whereas in Sect. 4.5 we draw parallels with the ‘heartbeat’ state of GRS 1915+105.
4.1 Light curve and Hardness Intensity Diagram (HID) of IGR J17091–3624
SXT light curve of the entire IGR J17091–3624 observation with time bin size of 2.378 s is shown in Fig. 4a. The source intensity is observed to vary between 5–35 c/s in the energy band 0.5–7 keV. The upper left panels of Fig. 5 & 6 show the 500 s zoomed SXT light curve of Segments 3 and 4 in the energy band 0.5–7 keV, whereas the middle panel shows the variation of hardness ratio (HR) with time where HR is defined as ratio between flux in 3–7 keV and 0.5–3 keV. We also plot the LAXPC light curve in the energy band 3–20 keV in the bottom panels and find similar variability as in SXT light curve. A similar type of variability was observed during the ‘heartbeat’ phase of the 2011 and 2016 outbursts (Capitanio et al. 2012; Radhika et al. 2018) as observed with Swift/XRT and NuSTAR. The source is in the soft-intermediate state considering the low hardness ratios as was also stated by Radhika et al. 2018. Lower HR values were also obtained for the LAXPC light curve, however the data are not presented here due to possible contamination by the neutron star GX 349+2 source. The evolution of HID in terms of hardness ratio (flux in 4–10 keV/0.5–4 keV) and total unabsorbed flux in 0.5–10 keV (as observed with Swift/XRT) is shown in Fig. 4b (see Radhika et al. 2018, for details).


4.2 Timing Properties
Evolution of temporal properties in segments, where single peaked and double peaked QPOs are seen is described using successive segments 3 and 4 as a representative case for clarity. SXT light curves of segments 3 and 4 are shown in Fig. 5 and 6 where structured variability is clearly visible. We observe two distinct types of peaks (‘heartbeat’ QPOs) in the power spectra i.e., single and double peaks along with the harmonics. The PDS is fitted with power law and Lorentzian features for single peak frequency () in the range of mHz along with harmonics observed at 54.0–87.2 mHz (). The power spectra also show an additional peak () in some of segments between 34.7–48.4 mHz. A single main frequency was detected in almost all the selected segments. The rms of ‘heartbeat’ QPO () were obtained between 10.3–22.4 %, whereas total rms lies in the range of 16.5–28.6 %. However, rms of the harmonics was found to be in the range of 3.5–14.7 % and the significance of peaks was found to be small (see Table 2). It is also observed that the frequency of ‘heartbeat’ QPO decreased from Segment 11 onwards to a frequency in 25.6–30.3 mHz, as compared to the 33.1–40.7 mHz in the initial Segments (see Table 2). Apart from these, a distinguishable low frequency feature between 5.5–10.0 mHz is also seen along with its harmonic between 10–20 mHz in some cases. The harmonic feature could be discerned in a few other cases where the main peak could not be obtained. Similar features and frequency ranges were also observed with LAXPC PDS as presented in Table 2.
In the following sections, we focus on the temporal analysis considering the single peak and double peak frequency structure in the PDS for Segments 3 & 4 (as representation for two independent cases).
4.2.1 Single Peaked QPO (SPQ)
The single peaked ‘heartbeat’ QPO observed in segment 3 is shown in Fig. 5. The burst oscillation frequency shows up as a feature at 38.5 mHz () for Segment 3. A harmonic was also noticed at 78.6 mHz (). An additional broad feature was seen at 7.2 mHz (see Fig. 5, top–right panel). The total rms of the fitted model over the frequency range considered was 27.1% of which the ‘heartbeat’ QPO contributed 20.2%. The rms of harmonic was obtained at half of this value.
In order to confirm the frequency obtained using the SXT light curve for this segment, the simultaneous LAXPC PDS is also generated as seen in Fig. 5 (right–bottom panel). This also shows the frequency of ‘heartbeat’ QPO around 38.4 mHz () and harmonic at 76.0 mHz () along with the broad feature at 8.5 mHz. However, the total rms values are not quoted due to contamination by the nearby source GX 349+2 as mentioned in Sect 2.3.
This SPQ is observed in 12 of the 19 segments albeit with less power in some of the segments as presented in Table 2.
4.2.2 Double Peaked QPO (DPQ)
As seen in the PDS of Segment 4 of SXT data, along with the features seen in Segment 3, an additional Lorentzian was required at 48.4 Hz () which is shown in Fig. 6 (right–top panel). It is evident that the frequencies and are not harmonically related with a separation of 11.6 mHz between them (see Fig. 6 and Table 2). However, only one harmonic peak is detected at 94.4 mHz (). The total rms of the fitted model was 27.2% with the main frequency () contributing 16.2% and contributing 15.4%. The rms estimated for the harmonic was 9.6%. We also confirmed the presence of DPQ in the LAXPC PDS as well (right–bottom panel). Two distinct peaks were obtained at 37.0 mHz () and 49.1 mHz () close to the frequencies observed in SXT PDS with separation of 12.1 mHz between them. A single harmonic peak was also present at 88.2 mHz (). Model fitted parameter of PDS of DPQ are presented in Table 2.
4.2.3 Evolution from SPQ to DPQ
SPQ and DPQ observed in Segments 3 and 4 respectively are separated by ks. In order to verify that the double peak in some segments is due to variation in QPO frequency during the observation, a dynamical power spectrum using the wavelet analysis was generated using the IDL tool and the results are shown in Fig. 7. The dynamic PDS gives an impression that these bursts are not continuous but rather the source is quiet for some duration in between the bursts. In Segment 3 (left hand side of Fig. 7), the SPQ is clearly observed in the dynamic PDS. They appear nine times almost consistently around 39 mHz () at the same frequency as that in the static PDS, with a wavelet power signal contour having broad width distribution within mHz in the interval of 2.3 ksec. Harmonics () at 78 mHz are also noticed for some duration. A very faint signal is also noticed at 50 mHz near beginning of the segment. A broad wavelet signal around 9 mHz low frequency, which is widely spread over, is detected at the mid-segment with a harmonic signal at 18 mHz which is also seen in the static PDS (Fig. 5.)
As seen in Fig. 7 (right hand side), these burst frequencies show a split by swapping in the frequency space due to shift in their location with time in Segment 4. Initially, we observed three burst signals which are weak in strength resembling a jump in frequency space resulting in a double peak. These DPQs become stronger with time as seen from the Fig. 7. Four broad burst frequencies () at 37 mHz with mHz in comparison to five narrow burst frequencies () at 48 mHz with mHz are seen in the dynamic PDS. A faint signal of harmonic of frequency () around 100 mHz is noticed at a few locations in frequency space. Moreover, a strong broad signal appears around 4 mHz and a couple of weak signals at 6 mHz and 8 mHz along with harmonic signal present around 14 mHz (at the start of segment) are well noticeable.
4.3 Spectral Properties
From the spectral fits of all the data sets, the hydrogen column density () is found to be (0.8–0.9) cm-2. These are similar to the estimates made by Krimm et al. 2011 and Capitanio et al. 2012. The SXT spectrum is well fitted by Model 1 as shown in Fig. 8. The disc temperatures were obtained in the range 1.21–1.31 keV and the estimated flux for 2–10 keV was in the range of 1.10–1.24 ergs cm-2 s-1. Table 3 summarizes results of best fitted parameters of SXT spectra with Model 1. No significant variation is seen in the spectra with time.
The extended broadband spectral analysis was performed on four segments with Model 2a, two of them are SPQ (Seg 03 and 16) and other two DPQ (Seg 07 and 11) segments. The fit parameters are shown in Table 4. The spectrum and unfolded model for segment 7 is shown in Fig. 9. The was kept frozen to the value obtained from Model 1, as it is better estimated from the soft energy spectrum. The disc was considered to be the source of the input seed photons in the nthcomp model. The ezdiskbb model norm was also frozen to the value obtained from Model 1, in order to achieve better estimation of the model parameters, as it was not well constrained. The temperature of the disc was found to be in the range of 0.63–0.84 keV, whereas the electron temperature remains in the range 3.51–4.02 keV. A slight variation in the photon index was seen having the value of 2.13–2.40 along with marginal shift in the iron line energy from 6.62–6.79 keV. The Fe-line is detected only in the LAXPC spectrum. But the feature can be non-reliable due to the possible contribution from the GX 349+2 source. Lack of knowledge on the exact nature of GX 349+2 source during this observation can contribute to the residuals in this energy range. Hence, although the changes in line energy and width in source spectrum obtained post subtraction of the simulated spectrum are significantly small with respect to individual segments, we refrain from a detailed interpretation of the same. Since the spectral parameters in both cases remain similar, we further probe into the differences between the SPQ and DPQ segments using a simple PRS in which phases are classified based on flux relative to the peak in the next section.
| Seg. | Freq. | ‘Heartbeat’ | SXT | ‘Heartbeat’ | LAXPC | ||||||
|---|---|---|---|---|---|---|---|---|---|---|---|
| (No) | QPO (mHz) | Qfact | QPOrms(%) | Sign.() | Totalrms(%) | QPO (mHz) | Qfact | QPOrms(%) | Sign.() | ||
| 01 | 2.9 | 1.7 | 25.0/32 | 2.4 | 1.4 | ||||||
| 02 | 10.7 | 2.1 | 28.9/31 | 7.0 | 1.8 | ||||||
| 5.6 | 1.9 | - | - | 7.8 | 1.7 | ||||||
| 2.8 | 2.7 | - | - | 4.7 | 1.5 | ||||||
| 03 | 3.3 | 1.6 | 29.5/34 | 2.5 | 1.3 | ||||||
| 2.5 | 1.8 | - | - | 2.5 | 2.0 | ||||||
| 04 | 5.5 | 2.5 | 32.5/28 | 6.0 | 1.4 | ||||||
| 4.4 | 2.3 | - | - | 6.3 | 1.8 | ||||||
| 3.0 | 1.6 | - | - | 3.0 | 1.6 | ||||||
| 05 | 3.1 | 1.7 | 21.9/31 | 2.2 | 1.3 | ||||||
| 5.4 | 3.2 | - | - | 4.9 | 1.6 | ||||||
| 06 | 6.7 | 2.0 | 39.3/29 | 7.8 | 2.5 | ||||||
| 17.1 | 2.3 | - | - | 5.1 | 2.8 | ||||||
| 11.8 | 1.1 | - | - | 4.0 | 1.6 | ||||||
| 07 | 5.8 | 3.6 | 29.4/31 | 4.7 | 1.5 | ||||||
| 5.0 | 2.2 | - | - | 5.5 | 1.6 | ||||||
| 5.9 | 4.8 | - | - | 3.3 | 1.3 | ||||||
| 08 | 4.5 | 1.9 | 26.3/22 | 3.9 | 2.0 | ||||||
| 5.9 | 2.9 | - | - | 6.2 | 1.8 | ||||||
| 5.3 | 1.6 | - | - | 1.4 | 1.3 | ||||||
| 09 | 3.8 | 1.9 | 28.3/31 | 4.0 | 1.4 | ||||||
| 5.5 | 1.1 | - | - | 1.6 | 1.5 | ||||||
| 10 | 9.9 | 2.8 | 64.1/34 | 2.3 | 1.6 | ||||||
| 4.7 | 2.2 | - | - | 1.8 | 3.2 | ||||||
| 11 | 3.1 | 1.7 | 12.5/11 | 2.8 | 1.7 | ||||||
| 15.0 | 1.7 | - | - | 12.6 | 5.1 | ||||||
| 2.1 | 1.7 | - | - | 3.3 | 1.4 | ||||||
| 12 | 3.3 | 1.6 | 14.8/18 | 11.5 | 2.2 | ||||||
| 19.8 | 6.7 | - | - | 16.6 | 1.9 | ||||||
| 13 | 6.2 | 1.9 | 29.6/34 | 3.0 | 1.5 | ||||||
| 7.5 | 6.7 | - | - | 11.4 | 2.4 | ||||||
| 14 | 8.1 | 2.5 | 41.8/35 | 6.3 | 2.8 | ||||||
| 17.2 | - | - | - | 11.4 | 2.4 | ||||||
| 15 | 6.1 | 1.6 | 51.8/34 | 7.1 | 2.3 | ||||||
| 4.8 | 4.0 | - | - | 2.3 | 1.8 | ||||||
| 16 | 6.8 | 2.3 | 68.4/37 | 2.4 | 1.6 | ||||||
| 4.6 | 2.6 | - | - | 4.5 | 1.9 | ||||||
| 17 | 4.8 | 1.6 | 15.9/18 | 8.3 | 6.8 | ||||||
| 11.5 | 2.4 | - | - | 5.5 | 2.1 | ||||||
| 5.2 | 1.2 | - | - | 4.5 | 1.9 | ||||||
| 18 | 7.9 | 1.9 | 35.4/26 | 12.2 | 1.4 | ||||||
| 6.4 | 2.3 | - | - | 26.2 | 3.9 | ||||||
| 19 | 6.1 | 2.9 | 46.7/37 | 12.5 | 1.7 | ||||||
| 8.9 | 1.1 | - | - | 4.6 | 1.7 | ||||||

| IGR J17091–3624 | |||||
| Seg. | Tmax | Flux (2-10 keV) | |||
| (No) | atoms/cm2 | (keV) | (/dof) | ergs/cm2/s | |
| 1 | 445/384 | ||||
| 2 | 419/410 | ||||
| 3 | 466/410 | ||||
| 4 | 460/409 | ||||
| 5 | 515/410 | ||||
| 6 | 353/353 | ||||
| 7 | 441/411 | ||||
| 8 | 542/415 | ||||
| 9 | 396/355 | ||||
| 10 | 369/369 | ||||
| 11 | 348/326 | ||||
| 12 | 257/301 | ||||
| 13 | 372/342 | ||||
| 14 | 393/355 | ||||
| 15 | 521/411 | ||||
| 16 | 449/411 | ||||
| 17 | 453/405 | ||||
| 18 | 397/411 | ||||
| 19 | 485/401 | ||||
| GRS 1915+105 | |||||
| 1 | 507/418 | ||||
. IGR J17091–3624 GRS 1915+105 Model 2a: TBabs(ezdiskbb+gaussian+nthcomp) Model 2b: TBabs(ezdiskbb+diskline+nthcomp) Parameters Seg. 3 (SPQ) Seg. 7 (DPQ) Seg. 11 (DPQ) Seg. 16 (SPQ) Orbit No. 8118 (keV) (keV) (/dof) 560/438 501/433 439/356 545/437 560/473 - The values are frozen.
| SXT | ||||||||
| ‘Heartbeat’ QPO | Total | |||||||
| Frequency (mHz) | Qfactor | Significance () | rms (%) | rms (%) | ||||
| 6.7 () | 5.6 | 2.4 | 9.21.5 | 13.11.8 | ||||
| 14.0 () | 2.1 | 1.9 | 6.51.7 | |||||
| LAXPC | ||||||||
| ‘Heartbeat’ QPO | QPO | Total | ||||||
| Frequency (mHz) | Qfactor | Significance () | rms (%) | Frequency (Hz) | Qfactor | Significance () | rms (%) | rms (%) |
| 6.2 () | 7.9 | 6.8 | 13.81.2 | 5.2 | 4.2 | 10.5 | 8.70.7 | 23.4 1.5 |
| 14.0 () | 4.7 | 2.4 | 6.11.6 | |||||
. IGR J17091–3624 GRS 1915+105 SPQ DPQ Parameters Seg. 3 (I) Seg. 3 (II) Seg. 7 (I) Seg. 7 (II) (Pa) (Pb) (Pc) (keV) (keV) 224/233 501/395 266/244 107/99 424/394 93/106 - The values are frozen.
4.4 Phase-Resolved Spectroscopy
In this section, we present the phase-resolved spectroscopic properties of IGR J17091–3624 (Rao & Vadawale 2012, see) with those of single peak QPO and double peak QPO in the ‘heartbeat’ State.
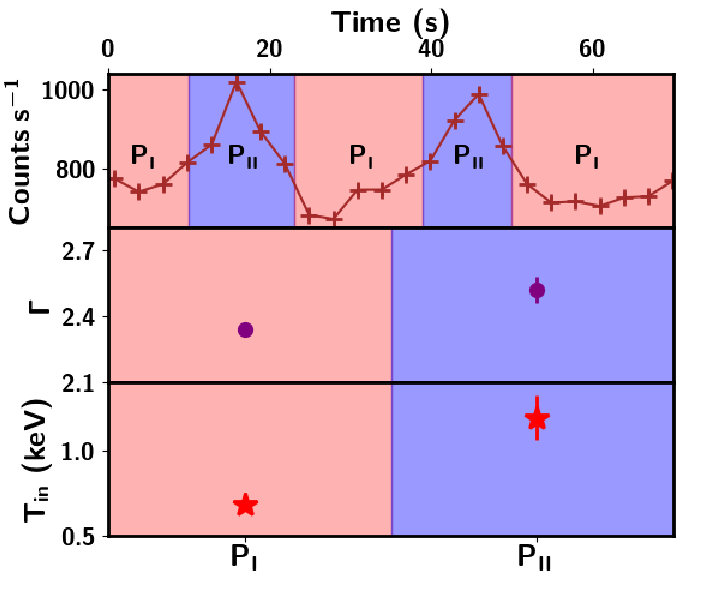
Phase-resolved spectroscopy (PRS) for IGR J17091-3624 light curve was carried out for the segments 3 and 7 into two phases: Plateau region (Phase I) and Peak region (Phase II), as the intermediate region was not observed due to short and random nature of the pulse profile. Considering a 1 s binned LAXPC light curve, these two regions were bifurcated based on the count rate threshold as shown in the upper panel of the Fig. 10. Phase I light curve events, with the threshold count rate less than 750 counts s-1, are marked with the pink band, whereas the Phase II events, having the threshold count rate greater than 800 counts s-1 are marked with the violet band. A small region between burst and plateau phase was filtered out to ignore small stray peaks in between. To produce these phase resolved light curves, we generated individual GTI’s using a FORTRAN code. These GTI’s are then given as input to the LAXPC pipeline to regenerate the Level 2 spectrum as described in Sect. 2.
We model the PRS using Model 2a applied to the time averaged spectrum. The phases and the variation of parameters of segment 3 are shown in Fig. 10. We find very little variation in parameters across the two phases. There is a slight increase in photon index and electron plasma temperature for Phase II along with almost double rise in the disc temperature in both single and double peak QPO’s, indicates that the spectrum becomes softer in Phase II. The phase parameter variations of segments 3 and 7 of broadband results are presented in Table 6. The estimated flux for 2–10 keV was in the range of 3.33–4.67 ergs cm-2 s-1. A decrease in the energy of gaussian line is observed during the Phase II in both single and double peak QPO segments.



4.5 Comparison with GRS 1915+105
In this section, we compare the timing, spectral and PRS properties of IGR J17091–3624 with those of GRS 1915+105 in the ‘heartbeat’ State.
4.5.1 Timing Properties of GRS 1915+105
Till date, only one observation with AstroSat of GRS 1915+105 is reported to be in the ‘heartbeat’ state (Rawat et al. 2019). The SXT light curve in the 0.5–7 keV band is shown in top panel of Fig. 11. Hardness ratio as defined in Sect. 4.1 is shown in next panel. ‘Heartbeat’ variability is also seen in the SXT light curve (top panel of Fig. 11), which is more clear and prominent in the LAXPC light curve (third panel of Fig. 11). The hardness ratio clearly shows an anti-correlation with the flux as is clear from the two lower panels of Fig. 11. The PDS of SXT light curve is generated with a time resolution of 2.378 s in the frequency range 3 mHz to 0.25 Hz. The PDS for LAXPC is obtained in the 3–20 keV band for a time resolution of 50 ms in the 2 mHz to 10 Hz frequency range. The model fitted PDS are shown in Fig. 12 and the fitted parameters along with estimated rms are summarized in Table 5.
SXT PDS of GRS 1915+105 is shown in the top panel of Fig. 12 which shows a ‘heartbeat’ QPO at mHz along with an associated harmonic at mHz. The ‘heartbeat’ QPO is prominent in the SXT PDS with an rms of 9.2% along with a harmonic contributing to 6% of the total rms of 13%. These features are also seen in the LAXPC PDS. The QPO at Hz is seen in the LAXPC PDS along with its sub-harmonic at Hz while these features are either absent or not discernible in the PDS of IGR J17091–3624 due to the LAXPC PDS being noise dominated beyond 1 Hz. The heartbeat QPO at mHz contributes to 13.8% of the total rms of 23.4% in the 2 mHz to 10 Hz frequency range. Light curves of the two sources IGR J17091–3624 and GRS 1915+105, differ in periodicity and structure of the burst profile as seen in Figs. 5, 6 and 11. The double peak feature observed in IGR J17091–3624 is not seen in GRS 1915+105.
4.5.2 Spectral Properties of GRS 1915+105
Following the fitting procedure to the spectra of IGR J17091-3624, we first fit the SXT spectrum of GRS 1915+105 independently from 0.7–7 keV. This could be modelled using Model 1 with a disc temperature of 1.28 keV and norm as (see Table 3). Although the disc temperatures are similar, the norm for GRS 1915+105 is obtained as 40, which is 6 times larger than the one for IGR J17091–3624, implying a larger inner disc radius. The simultaneous SXT and LAXPC broadband spectrum was modelled in the energy range of 0.7–40 keV with the Model 2a that gave a . Replacing the gaussian with diskline and adding a smedge resulted in slightly better fit with . The centroid energy was obtained at keV. However, better constraints on other parameters could not be obtained and were frozen to default values. The fitted parameters are given in Table 4. Assuming the disc to be the source of the input seed photons, the parameter of nthcomp model was tied to the disc temperature of ezdiskbb which was obtained close to keV. Although the photon indices for both sources are comparable (2.1–2.4 for IGR J17091–3624 and 2.1 for GRS 1915+105), the disc temperature of IGR J17091-3624 is between 66% and 88% of that of GRS 1915+105 and the electron plasma temperature is an order of magnitude lower (see Table 4).
4.5.3 Phase-Resolved Spectroscopy of GRS 1915+105
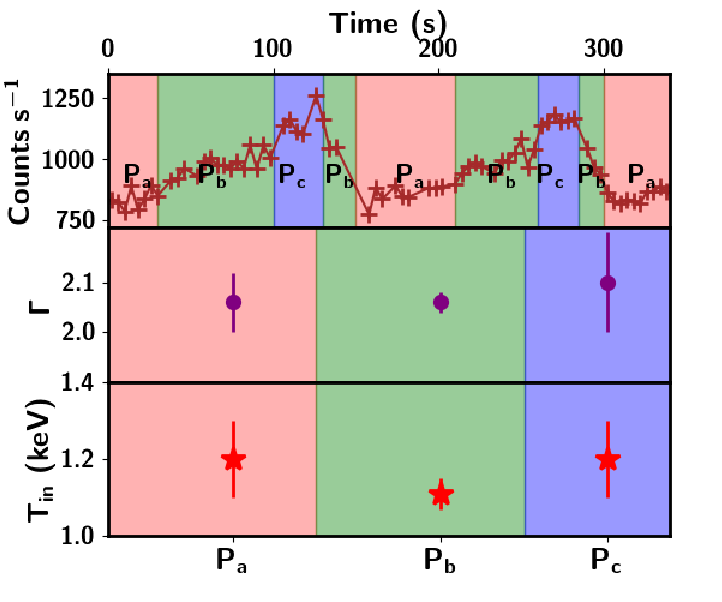
PRS of GRS 1915+105 was made for comparison with IGR J17091-3624. Light curve of GRS 1915+105 is relatively more structured compared to the one from IGR J17091-3624 as seen from Fig. 5, 6 and 10. Hence, the light curve could be divided into three phases instead of the two considered for IGR J17091-3624. Flux thresholds are defined based on the structure of the light curve wherein the events with count rate less than 900 counts s-1 belong to Phase Pa, those lying above 1100 counts s-1 lie in Phase Pc while the intermediate events belong to Phase Pb.
We model the PRS using Model 2b applied to the time averaged spectrum. The phases and the variation of parameters are shown in Fig. 10 (bottom-right panel). We find very little variation in parameters across the three phases. There is a slight increase in photon index in Phase Pc, suggesting that the spectrum becomes softer in this phase, although the disc temperature remains relatively constant. The change in parameters is shown in Table 6. The electron plasma temperature remains unconstrained for Phase Pa and is hence frozen to the value obtained from the time-averaged spectrum. A decrease in is then observed from Phase Pb to Phase Pc. A decrease in the equivalent width of the emission line from 220 to 187 eV is also seen.
5 Discussions and Conclusion
In this paper, we carried out extensive temporal and spectral analysis of the black hole source IGR J17091–3624 during its 2016 outburst observed with SXT and LAXPC onboard AstroSat. IGR J17091–3624 was the first BHB to exhibit some of the variabilities which were earlier unique only to GRS 1915+105 prompting extensive publications on comparisons of this source with GRS 1915+105 and describing the accretion process based on phenomenological and theoretical models (Nandi et al. 2001; Belloni et al. 2005; Dunn et al. 2010; Altamirano et al. 2011; Capitanio et al. 2012; Nandi et al. 2012; Zhang et al. 2014; Radhika & Nandi 2014; Pahari et al. 2014) including a two component advective flow model (Iyer et al. 2015; Radhika et al. 2018). During the AstroSat observation, we found IGR J17091–3624 to be in the ‘heartbeat’ class similar to the one found in GRS 1915+105. Therefore, we made a comparative study of such variability with GRS 1915+105 observation from the AstroSat data in March 2017 (Rawat et al. 2019).
IGR J17091–3624 was in steady soft-intermediate state during the AstroSat observation, as seen from the Fig. 4 (see Radhika et al. 2018, for details). The source has shown repetitive and high variability with hardness ratio varying from 0.2 to 0.7 (except in a few cases, where HR ) and with count rate varying from to 35 c/s as shown in Figs. 4, 5 and 6 similar to the variability seen in GRS 1915+105 (see Fig. 11). However, the variability timescales in IGR J17091–3624 lies within 20–40 s, which is faster than the timescale ( s) of GRS 1915+105. The hardness ratio for both sources shows a strong anti-correlation with the flux during the ‘heartbeat’ class as was previously observed by Pahari et al. 2014. Also, the average values of hardness ratio observed in SXT is higher in GRS 1915+105 than that in IGR J17091–3621 signalling a higher contribution in the latter source from the Keplerian disc.
For the first time, we find two different types of ‘heartbeat’ QPOs in the PDS for the source IGR J17091–3624 — single and double peak spanning in the frequency range between 25–48 mHz (as seen in right panels of Figs. 5 & 6 and Table 2). The evolution of the single peak to double peak QPO was also seen in the dynamic PDS (Fig. 7) with frequency difference mHz between the two peaks. The static PDS is mostly dominated with flat-top noise at lower frequencies or the powerlaw nature in some of the observation segments.
A few of the ‘heartbeat’ QPOs have a and amplitude unlike the typical values found in other BH sources (Casella et al. 2004). These could be because the variability observed does not strictly conform to the -class observed in previous outbursts. Given time, the light curve could evolve to regular, structured variability. However, due to lack of continuous observation of the source, further conclusions cannot be drawn. Besides these, we are also able to detect very low frequencies and harmonics in the range of 5–10 mHz and 1.25–2 mHz in some of the segments. Previous reports of such ‘heartbeat’ QPOs exist, along with the detection of an QPO at 5 Hz (Altamirano et al. 2011; Pahari et al. 2014).
However, the LAXPC PDS is too noise dominated beyond 1 Hz along with presence of some signature of GX 349+2 make it difficult to detect any such feature in contrast with GRS 1915+105 where a QPO at Hz is observed along with a sub-harmonic at Hz. Also, there is no conclusive evidence for double peaks in ‘heartbeat’ QPO observed in the PDS of GRS 1915+105. Pahari et al. 2014 and Iyer et al. 2015 observed that the timescale of variability decreased as the source evolved into a ‘’-class variability. This was also observed for the subsequent observations of GRS 1915+105 where timescale decreased from s to s (Rawat et al. 2019). However, we observed that the variability timescales in IGR J17091–3624 seem to increase with time for segments where single peak QPOs are observed (see Table 2). In segments where double peak QPOs are observed, the two different timescales do not seem to follow any individual pattern. However, an overall increase in timescales is seen in these segments too. Chakrabarti & Manickam 2000 state that the low frequency QPOs (1–10 mHz) are due to transitions between the burst and quiescent states. These low frequency QPOs observed in black hole binary systems provide the information of physical oscillations in the system. The observed change in the frequency might be associated with the change in the angular momentum of the incoming matter due to the interaction with the slowly inward propagating matter in the Keplerian disc or change of viscosity (Das et al. 2014; Mondal et al. 2015), periodic orbital motion of companion or release of the matter at different conditions. It is also believed that a lower angular momentum accretion flow could be released from the magnetic trap inside the Roche lobe of the black hole binary systems (Suková et al. 2017).
Due to the possible contamination of LAXPC data from the nearby source GX 349+2, broadband spectral analysis of IGR J17091–3624 was limited to the energy range of 0.7–23 keV. The spectra of both IGR J17091–3624 and GRS 1915+105 in the energy range 0.7–7 keV is dominated by a thermal disc with similar temperatures. However, the norm for both sources differs significantly while fitting with Model 1, with IGR J17091–3624 having a much smaller norm ( compared to from GRS 1915+105). This implies a disc which could extend closer to the compact object. This is interesting as the estimated mass of the two sources lie in a similar range 10–14 . The IGR J17091–3624 broadband spectrum analysis revealed that there is a minimal change in an average disc temperature with range of 0.63–0.84 keV with similar variation in electron plasma temperature having range of 3.5–4.0 keV. The photon index varying in the range of 2.13–2.40 are consistent with the source being in softer state. Slight variations in the spectral parameters is possible, since the exact spectral nature of GX 349+2 at the time of observation is unknown.
The centroid frequency of the ‘Heartbeat’ QPO exhibits an overall decreasing trend. Decrease in rms from 29 to 17% is seen with time (Table 2) accompanied by a corresponding decrease in from 2.4 to 2.1. Variation in the input seed photon temperature is also seen from 0.7–0.4 keV from segment 3 to segment 16. The time averaged spectral and temporal properties of IGR J17091-3624 are broadly consistent with the disc-truncation theory where the disc recedes from the compact object as it moves from SIMS to a harder state. However, significant differences in spectral properties in segments exhibiting SPQ and DPQ in PDS are absent (see Table 4). PRS was then performed to probe for further differences in these two segments. The broadband PRS of IGR J17091–3624 shows a clear difference in the disc temperature, electron plasma temperature and photon index in both phases I & II as mention in the Table 6 with respect to an average value mentioned in the Table 4. It was found that the parameters during the phase II in PRS were higher and in phase I well below the average value. Although differentiation of the spectral properties in the SPQ and DPQ segments was not possible due to marginal variation in the parameters. In GRS 1915+105, photon index () increases from to signaling a transition from harder to softer state. However, the increase in the disc temperature is not as high as seen in IGR J17091-3624. A significant variation in electron plasma temperature (13–32 keV) is also seen in the case of GRS 1915+105 compared to the near constant values observed in IGR J17091-3624. Although, accumulation of a larger data set for analysis is recommended before a physical interpretation can be attempted. The dominance of the disc component implies that the variability observed in both sources is basically thermal in nature during the ‘heartbeat’ class. Further studies could present interesting constraints on the geometry and disc size of these sources.
The X-ray flux of IGR J17091–3624 was found to be ergs cm-2 s-1 in the energy range of 0.1–100 keV while that of GRS 1915+105 was obtained as ergs cm-2 s-1. The absorption column density is (0.8–1.1) cm-2 and cm-2 for IGR J17091–3624 and GRS 1915+105 respectively, which is similar to the those reported by Pahari et al. 2014. Considering IGR J17091–3624 to be at an average distance of kpc, the luminosity is found to be erg s-1, while for GRS 1915+105 at a distance of kpc, the luminosity is obtained as erg s-1. IGR J17091–3624 seems to be emitting at 4–11% of while GRS 1915+105 emits at 6–20% of considering uncertainties in flux, distance and mass. The -class variabilities are generally attributed to the fast removal and refilling of matter in the inner accretion disc (Belloni et al. 1997), which is driven by radiation pressure instability in a standard Shakura-Sunyaev accretion disc (Shakura & Sunyaev 1973) which requires the source to be emitting at close to to trigger the limit cycle instability (Done et al. 2004). However the luminosity obtained for both sources is much lower than the 70–80% of as obtained for -class by Neilsen et al. 2011; Neilsen et al. 2012. Rawat et al. 2019 suggest that the HS class in GRS 1915+105 could be a precursor to the -class, which in some time may evolve to the -class as defined by Belloni et al. 2001. Nevertheless, it is clear that ‘heartbeat’ variability is observed in both sources although both of them emit at sub-Eddington luminosities. Earlier studies propose multiple reasons including spectral deformation due to higher inclination angle (Pahari et al. 2014), low or retrograde spin in IGR J17091–3624 (Rao & Vadawale 2012), presence of a very small BH () or alternatively the source being at a larger distance ( kpc) (Altamirano et al. 2011), or a difference in mass accretion rate, for the detection of GRS 1915+105 like variabilities in IGR J17091–3624 which has always been observed at lower flux than for GRS 1915+105.
We make use of the parameters obtained with the ezdiskbb model to estimate the mass accretion rate (Frank et al. 2002) as,
| (1) |
where is Boltzmann constant and is the mass of the black hole and is obtained as,
| (2) |
where is the norm of the ezdiskbb model, is the distance to the source in units of 10 kpc, is the inclination angle and is the colour correction factor which we assume to be 1.7 for both sources (Shimura & Takahara 1995). The disc radius is then obtained in the range 21–34 km and 13–24 km respectively for GRS 1915+105 and IGR J17091-3624 respectively.
We also obtain the ratio of mass accretion rate for IGR J17091–3624 and GRS 1915+105 for a distance range of 11–17 kpc and 6.9–10.5 kpc respectively. Considering the mass of IGR J17091–3624 and GRS 1915+105 as and , we obtain a maximum for an inclination angle of which is much lower than the value obtained by Pahari et al. 2014 at 48.3. This is expected as GRS 1915+105 is brighter than IGR J17091–3624 by only a factor close to 2. Also better estimates of mass and distance for these two sources are now available. Therefore, the condition that the source needs to emit at Eddington luminosities to exhibit ‘heartbeat’ class variability does not seem like a sufficient condition given the low luminosities obtained for both sources ( of which is required for the observed variabilities based on simulations by Nayakshin et al. 2000). Based on this, Court et al. 2017 suggested that the size of the disc and the magnetic field required to stabilize such a disc in a radiation dominated field could contribute to the GRS 1915+105 like variabilities observed. Sub-Eddington accretion rates were observed for IGR J17091–3624 by Iyer et al. 2015, where they suggest that the complex interplay between Keplerian and sub-Keplerian flows in the presence of outflows/winds could give rise to this variability (Mandal & Chakrabarti 2010; Radhika et al. 2018). Massaro et al. 2014, using a non-linear differential equations to reproduce the light curve and the energy lags in a -state observed with BeppoSAX, suggested that the level and stability of the accretion rate could be the parameter responsible for the onset of the ‘heartbeat’ oscillations. Further studies aiming at a consistent model which explains the origin of these variabilities need to be done to get a comprehensive picture.
Acknowledgments
We thank the anonymous reviewer for the suggestions to improve the quality of the manuscript. We acknowledge all the support from the Indian Space Research Organization (ISRO) for AstroSat mission, in particular, for providing the necessary software tools and for releasing the data through ISSDC data archive centre. We also acknowledge the support received from the LAXPC and SXT Payload Operation Centres (POC), TIFR, Mumbai for release of verified data, calibration data products and pipeline processing tools. We thank Radhika and co-authors for providing us with their analysis results, which was used to comment on the spectral state of the source. BEB, VKA and AN thank GH, SAG; DD, PDMSA and Director, URSC for encouragement and continuous support to carry out this research. TK, HMA and KM acknowledge support of the Department of Atomic Energy, Government of India, under project no. 12 R&D-TFR-5.02-0200.
DATA AVAILABILITY STATEMENT
Data underlying this article are available at AstroSat-ISSDC website (http://astrobrowse.issdc.gov.in/astro_archive/archive), MAXI website (http://maxi.riken.jp/mxondem) and Swift/BAT website (https://swift.gsfc.nasa.gov/results/transients/).
References
- Agrawal et al. (2018) Agrawal V. K., Nandi A., Girish V., Ramadevi M. C., 2018, MNRAS, 477, 5437
- Altamirano & Belloni (2012) Altamirano D., Belloni T., 2012, ApJ, 747, L4
- Altamirano et al. (2011) Altamirano D., et al., 2011, ApJ, 742, L17
- Antia et al. (2017) Antia H. M., et al., 2017, ApJS, 231, 10
- Baby et al. (2020) Baby B. E., Agrawal V. K., Ramadevi M. C., Katoch T., Antia H. M., Mandal S., Nand i A., 2020, MNRAS, 497, 1197
- Belloni et al. (1997) Belloni T., Méndez M., King A. R., van der Klis M., van Paradijs J., 1997, ApJ, 488, L109
- Belloni et al. (2000) Belloni T., Klein-Wolt M., Méndez M., van der Klis M., van Paradijs J., 2000, A&A, 355, 271
- Belloni et al. (2001) Belloni T., Méndez M., Sánchez-Fernández C., 2001, A&A, 372, 551
- Belloni et al. (2005) Belloni T., Homan J., Casella P., van der Klis M., Nespoli E., Lewin W. H. G., Miller J. M., Méndez M., 2005, A&A, 440, 207
- Belloni et al. (2011) Belloni T. M., Motta S. E., Muñoz-Darias T., 2011, Bulletin of the Astronomical Society of India, 39, 409
- Capitanio et al. (2009) Capitanio F., et al., 2009, ApJ, 690, 1621
- Capitanio et al. (2012) Capitanio F., Del Santo M., Bozzo E., Ferrigno C., De Cesare G., Paizis A., 2012, MNRAS, 422, 3130
- Casella et al. (2004) Casella P., Belloni T., Homan J., Stella L., 2004, A&A, 426, 587
- Castro-Tirado et al. (1992) Castro-Tirado A. J., Brandt S., Lund N., 1992, IAU Circ., 5590, 2
- Chakrabarti & Manickam (2000) Chakrabarti S. K., Manickam S. G., 2000, The Astrophysical Journal, 531, L41
- Chakrabarti & Titarchuk (1995) Chakrabarti S., Titarchuk L. G., 1995, ApJ, 455, 623
- Coughenour et al. (2018) Coughenour B. M., Cackett E. M., Miller J. M., Ludlam R. M., 2018, The Astrophysical Journal, 867, 64
- Court et al. (2017) Court J. M. C., Altamirano D., Pereyra M., Boon C. M., Yamaoka K., Belloni T., Wijnands R., Pahari M., 2017, MNRAS, 468, 4748
- Das et al. (2014) Das S., Chattopadhyay I., Nandi A., Molteni D., 2014, MNRAS, 442, 251
- Done et al. (2004) Done C., Wardziński G., Gierliński M., 2004, MNRAS, 349, 393
- Dunn et al. (2010) Dunn R. J. H., Fender R. P., Körding E. G., Belloni T., Cabanac C., 2010, MNRAS, 403, 61
- Ebisawa et al. (1994) Ebisawa K., et al., 1994, PASJ, 46, 375
- Fabian et al. (1989) Fabian A. C., Rees M. J., Stella L., White N. E., 1989, MNRAS, 238, 729
- Frank et al. (2002) Frank J., King A., Raine D. J., 2002, Accretion Power in Astrophysics: Third Edition
- Hannikainen et al. (2005) Hannikainen D. C., et al., 2005, A&A, 435, 995
- Homan & Belloni (2005) Homan J., Belloni T., 2005, Ap&SS, 300, 107
- Ingram & Motta (2020) Ingram A., Motta S., 2020, arXiv e-prints, p. arXiv:2001.08758
- Iyer et al. (2015) Iyer N., Nandi A., Mandal S., 2015, ApJ, 807, 108
- King et al. (2012) King A. L., et al., 2012, ApJ, 746, L20
- Klein-Wolt et al. (2002) Klein-Wolt M., Fender R. P., Pooley G. G., Belloni T., Migliari S., Morgan E. H., van der Klis M., 2002, MNRAS, 331, 745
- Krimm et al. (2011) Krimm H. A., et al., 2011, The Astronomer’s Telegram, 3144, 1
- Kuulkers et al. (2003) Kuulkers E., Lutovinov A., Parmar A., Capitanio F., Mowlavi N., Hermsen W., 2003, The Astronomer’s Telegram, 149, 1
- Makishima et al. (1986) Makishima K., Maejima Y., Mitsuda K., Bradt H. V., Remillard R. A., Tuohy I. R., Hoshi R., Nakagawa M., 1986, ApJ, 308, 635
- Mandal & Chakrabarti (2010) Mandal S., Chakrabarti S. K., 2010, The Astrophysical Journal, 710, L147
- Massaro et al. (2014) Massaro E., Ardito A., Ricciardi P., Massa F., Mineo T., D’Aì A., 2014, Ap&SS, 352, 699
- McClintock & Remillard (2006) McClintock J. E., Remillard R. A., 2006, Black hole binaries. pp 157–213
- Méndez et al. (2001) Méndez M., van der Klis M., Ford E. C., 2001, ApJ, 561, 1016
- Miller et al. (2016) Miller J. M., Reynolds M., Kennea J., King A. L., Tomsick J., 2016, The Astronomer’s Telegram, 8742, 1
- Mineo et al. (2012) Mineo T., et al., 2012, A&A, 537, A18
- Mitsuda et al. (1984) Mitsuda K., et al., 1984, PASJ, 36, 741
- Miyamoto et al. (1992) Miyamoto S., Kitamoto S., Iga S., Negoro H., Terada K., 1992, ApJ, 391, L21
- Mondal et al. (2015) Mondal S., Chakrabarti S. K., Debnath D., 2015, ApJ, 798, 57
- Morgan et al. (1997) Morgan E. H., Remillard R. A., Greiner J., 1997, ApJ, 482, 993
- Nandi et al. (2001) Nandi A., Manickam S. G., Rao A. R., Chakrabarti S. K., 2001, MNRAS, 324, 267
- Nandi et al. (2012) Nandi A., Debnath D., Mandal S., Chakrabarti S. K., 2012, A&A, 542, A56
- Nandi et al. (2018) Nandi A., et al., 2018, Ap&SS, 363, 90
- Nayakshin et al. (2000) Nayakshin S., Rappaport S., Melia F., 2000, ApJ, 535, 798
- Neilsen et al. (2011) Neilsen J., Remillard R. A., Lee J. C., 2011, ApJ, 737, 69
- Neilsen et al. (2012) Neilsen J., Remillard R. A., Lee J. C., 2012, ApJ, 750, 71
- Pahari et al. (2014) Pahari M., Yadav J. S., Bhattacharyya S., 2014, ApJ, 783, 141
- Pasham et al. (2013) Pasham D. R., Strohmayer T. E., Mushotzky R. F., 2013, ApJ, 771, L44
- Psaltis et al. (1999) Psaltis D., Belloni T., van der Klis M., 1999, ApJ, 520, 262
- Radhika & Nandi (2014) Radhika D., Nandi A., 2014, Advances in Space Research, 54, 1678
- Radhika et al. (2018) Radhika D., Sreehari H., Nandi A., Iyer N., Mand al S., 2018, Ap&SS, 363, 189
- Rao & Vadawale (2012) Rao A., Vadawale S. V., 2012, ApJ, 757, L12
- Rawat et al. (2019) Rawat D., et al., 2019, ApJ, 870, 4
- Reid et al. (2014) Reid M. J., McClintock J. E., Steiner J. F., Steeghs D., Remillard R. A., Dhawan V., Narayan R., 2014, ApJ, 796, 2
- Rodriguez et al. (2011) Rodriguez J., Corbel S., Caballero I., Tomsick J. A., Tzioumis T., Paizis A., Cadolle Bel M., Kuulkers E., 2011, A&A, 533, L4
- Shakura & Sunyaev (1973) Shakura N. I., Sunyaev R. A., 1973, A&A, 500, 33
- Shimura & Takahara (1995) Shimura T., Takahara F., 1995, ApJ, 445, 780
- Singh et al. (2017) Singh K. P., et al., 2017, Journal of Astrophysics and Astronomy, 38, 29
- Sreehari et al. (2018) Sreehari H., Nandi A., Radhika D., Iyer N., Mandal S., 2018, Journal of Astrophysics and Astronomy, 39, 5
- Sreehari et al. (2019) Sreehari H., Ravishankar B. T., Iyer N., Agrawal V. K., Katoch T. B., Mandal S., Nandi A., 2019, MNRAS, 487, 928
- Sreehari et al. (2020) Sreehari H., Nandi A., Das S., Agrawal V. K., Mandal S., Ramadevi M. C., Katoch T., 2020, MNRAS, 499, 5891
- Suková et al. (2017) Suková P., Charzyński S., Janiuk A., 2017, MNRAS, 472, 4327
- Tanaka & Lewin (1995) Tanaka Y., Lewin W. H. G., 1995, in X-ray Binaries. pp 126–174
- Vadawale et al. (2016) Vadawale S. V., et al., 2016, In-orbit performance AstroSat CZTI. p. 99051G, doi:10.1117/12.2235373
- Zhang et al. (2014) Zhang Z., Qu J. L., Gao H. Q., Zhang S., Bu Q. C., Ge M. Y., Chen L., Li Z. B., 2014, A&A, 569, A33
- Zimmerman et al. (2005) Zimmerman E. R., Narayan R., McClintock J. E., Miller J. M., 2005, ApJ, 618, 832