Space-based Global Maritime Surveillance. Part II: Artificial Intelligence and Data Fusion Techniques
Abstract
Maritime surveillance (MS) is of paramount importance for search and rescue operations, fishery monitoring, pollution control, law enforcement, migration monitoring, and national security policies. Since ground-based radars and automatic identification system (AIS) do not always provide a comprehensive and seamless coverage of the entire maritime domain, the use of space-based sensors is crucial to complement them. We reviewed space-based technologies for MS in the first part of this work, titled “Space-based Global Maritime Surveillance. Part I: Satellite Technologies” [1]. However, future MS systems combining multiple terrestrial and space-based sensors with additional information sources will require dedicated artificial intelligence and data fusion techniques for the processing of raw satellite images and fuse heterogeneous information. The second part of our work focuses on the most promising artificial intelligence and data fusion techniques for MS using space-based sensors.
I Introduction
Maritime surveillance (MS) aims at providing seamless wide-area operational pictures in coastal areas and the oceans in real time. Multiple heterogeneous sensors and information sources are nowadays available for MS, all with their advantages and limitations, and significant research and engineering effort has been made for their combination. Besides the most common terrestrial sensors for MS, e.g., the automatic identification system (AIS), X-band radars, and over-the-horizon (OTH) radars, space-based sensor technologies enable persistent monitoring of the maritime domain and ship traffic on a global scale even in remote areas of the Earth. Space-based remote sensing technologies, reviewed in the first part of this work [1], include satellite-based AIS (Sat-AIS), synthetic aperture radar (SAR), multi-spectral (MSP) and hyper-spectral (HSP) optical sensors and global navigation satellite systems reflectometry (GNSS-R). Space-based sensors for Earth observation installed on satellites allow collecting images of very large areas in remote regions of the globe with relatively short latency, and hence are strongly relevant to MS.
As a consequence of the deployment and spread of space-based sensor technologies, advanced data processing paradigms, e.g., big data analysis, machine learning, artificial intelligence (AI) and data fusion, are now extremely needed to fully exploit the wide availability of large data sets of satellite images. In particular, the development of future MS systems combining multiple sensors requires dedicated algorithms to process raw satellite images, detect and classify ships and fuse information from heterogeneous sensors. These algorithms support MS by processing and organizing the increasing amount of heterogeneous information. The extracted data and readily-understandable information digested therefrom will help end-users, such as governmental and military authorities, coast guards, and police, to detect anomalies, threats such as oil spills, piracy, and human trafficking, and act in time to prevent accidents and wrongdoing. In this second part of our work, we describe the main AI and imaging techniques for image segmentation, target detection and classification, and provide possible use cases with real images acquired by satellite sensors. Then, we describe recent Bayesian and statistical fusion techniques to extract knowledge from the troves of historical Sat-AIS data, such as most common maritime routes, and to track multiple targets by fusing information collected by multiple heterogeneous sensors. Among these, multitarget tracking (MTT) algorithms based on the sum-product algorithm (SPA) are gaining popularity thanks to their ability to fuse information from heterogeneous sources, to their scalability, i.e., low computational complexity in terms of the number of information sources, targets and measurements, and to their capability to include contextual information, e.g., maritime routes and ships class information extracted from satellite images. We also provide a use case that confirms the strength of SPA-based MTT algorithms when combined with information acquired by satellite sensors is also provided.
II Advanced AI Techniques for Satellite Sensor Data

The proliferation of space-based sensors collecting images of the Earth has called for the development of advanced AI and imaging techniques to extract ship features and identities to improve the surveillance capability. In particular, and analogous to many other scientific fields, deep neural network (DNN) techniques for detection and segmentation of specific targets from satellite images have recently received increasing interest. Advanced AI and DNN techniques allow, for example, the production of a “digital report” for any satellite image by performing vessel detection, segmentation, classification, and identification: by estimating ships dimensions and headings, and by providing geographic coordinates and timestamp. Fig. 1 shows some examples of satellite images augmented by a digital report for each detected ship.
In this section, we provide a review of the main AI and statistical techniques for target detection, segmentation and classification in images acquired by satellite sensors.
II-A DNN Architectures for Satellite Image Segmentation and Target Classification
Complex DNNs with multiple hidden layers and neurons can be used for satellite image segmentation and target classification. The training of these requires large labeled datasets, and this is naturally demanding both of storage and of computational power. Graphical processing units (GPUs) are the key to address the computational demand. Data augmentation techniques, such as cropping, padding and flipping, enable practitioners to significantly increase the diversity of data images available to train large DNN models, without actually collecting new images [2, Ch. 7]. For image segmentation and target classification, convolutional neural network (CNN) architectures are the most common [2, Ch. 9], since they allow for an efficient analysis of image textures, i.e., the contextual signal from the neighbouring pixels of a pixel under test. During the training phase of a CNN, features automatically extracted from a set of training images are assessed to understand (learn) which of them are the most suitable and relevant to perform segmentation and/or classification. Nowadays, the most used CNN architectures are the SegNet [3], the U-Net [4, 5, 6], and the Mask R-CNN [7]. The first two are fully-connected CNNs and they are mostly used for pixel-wise classification; the Mask R-CNN, instead, is a regional CNN mostly used to perform image segmentation by providing as output bounding boxes around the identified targets. Fig. 2 depicts a general workflow example of a satellite image segmentation task based on the U-Net architecture.

II-B Use Cases: AI Techniques for Satellite Image Segmentation and Classification
The first use case that we present is to detect ships and extract important features, e.g, position, width, length, heading and other relevant information, from very high resolution (VHR) optical satellite images by means of CNNs. The training dataset consists of about 200000 VHR images, with spatial resolution of approximately 1.5 m and dimension 768 by 768 pixels, acquired by the GeoEye, SPOT, Pleiades and Black Sky satellites. The inference, i.e., the testing of the CNN, is performed on new images acquired by the same sensors. A Mask R-CNN architecture is used, and Fig. 3-(a) shows an example result of the segmentation task: detected ships are surrounded by bounding boxes and highlighted with different colors.

The second use case is the segmentation of high resolution (HR) images, with spatial resolution of about 10 m. A real dataset of HR images for training and testing is not available. However, a synthetic dataset is obtained by degrading 10000 VHR images acquired by SPOT satellite, by means of appropriate computer vision techniques, such as the pyramid representation [8], in which an image is subject to repeated smoothing and subsampling. The type of architecture employed in this case is the U-Net, and Fig. 3-(b) represents an example result of the segmentation task ran over a validation dataset of HR images. In particular, the left-hand side images of Fig. 3-(b) represent the ground-truth, i.e., ships are manually extracted, while the right-hand side images represents the output of the segmentation task.

The third use case is related to the classification between ship stern and bow by means of a ResNet34 [9] architecture. The training dataset is composed of satellite images acquired by Sentinel-2 (S-2), from which detected ships are clipped, manually divided into stern and bow, and labelled. Fig. 4 represents the results of the classification.
In order to have a more complete view of the maritime situational picture, DNNs can be also conceived to discriminate among different types of vessels, by exploiting the heterogeneous information contained in historical Sat-AIS messages. In particular, the information provided by historical Sat-AIS data, e.g., ship width, length, and type, can be used to train neural networks to classify vessels into 14 categories derived by the AIS ship type, i.e., anti pollution-law, medical-non-conflict, cargo, dredging-military-sailboat, fishing, high speed craft, other-unknown-reserved, passenger, pilot boat, pleasure, search and rescue, tanker, tug-towing, wing in ground-effect. The neural network architecture used to perform this classification task consists of 2 hidden layers, the first with 200 neurons and the second with 100 neurons, and of an output layer of 14 neurons, with each neuron providing the probability of belonging to the respective category. During the inference phase, the neural network utilizes the information, e.g., length, width and area, provided by a segmentation task on VHR or HR satellite images, to categorize each of the detected vessels into one of the 14 classes.
III Extracting Knowledge from Sat-AIS Data
Sat-AIS is a revolutionary technology to obtain a comprehensive and global picture of maritime traffic, including that of areas far from ports and shore. AIS messages can be collected by low Earth orbit satellite systems and provide a global capability for maritime traffic monitoring using constellations of satellites and a network of globally distributed ground-based stations. This offers several benefits, including enhanced monitoring of fine-scale vessel behavior and traffic patterns, improved ability to identify potential threats, and more cost-effective use of assets. The global coverage enabled by space-based technology is a key feature that led Sat-AIS to become the major source, by volume and coverage, of maritime traffic information for global-scale monitoring. Nowadays, AIS data has been of increasing value, not only for ships themselves, but especially for coast guards, naval forces, and other marine operational authorities that can exploit such data to improve MS.
The availability of global datasets provided by Sat-AIS technology opens up new ways to extract valuable knowledge for MS. However, with the increase of the available Sat-AIS data to massive scales, computational strategies must cope with challenges typically faced when collecting, storing, querying, and processing globally distributed datasets of considerable size. Vast amounts of data tend to overwhelm human operators and call for approaches with a high degree of automation. Furthermore, standard algorithms are proving to be unable to deal with the non-idealities (e.g., erroneous, incomplete, intermittent, or counterfeit information) of such datasets. As an example, in contrast with traditional positional measurements, Sat-AIS messages are irregularly-sampled, with an update interval usually dependent on the specific vessel’s kinematic behaviour. Moreover, ships can enter and exit the receivers’ network coverage; or, worse, intentionally disable Sat-AIS transmitters. All this can lead to surveillance gaps that range from several minutes to many hours. From this perspective, the success of future surveillance systems using maritime data will increasingly require to combine statistical, big data analytics, and AI techniques in order to handle all the aforementioned challenges introduced by AIS datasets.
III-A AIS-based Maritime Traffic Knowledge Discovery


One of the biggest challenges to improve MS is capitalising on the increasingly available stream of AIS data by turning this information into actionable knowledge of the maritime situational picture at global scale. In recent years, a significant body of research has been dedicated to the development of new methodologies in support of MS that aim at learning, from historical AIS data, motion patterns of ships, i.e., recurrent sea routes and statistical analytics about the dynamics, density and types of vessels that, if well-characterised, can be beneficial for different MS applications such as anomaly detection, knowledge-based tracking, classification, and long-term prediction of vessels.
Knowledge discovery of maritime traffic patterns from AIS data can be broadly classified [10, 11] into statistics-grid-, and vector-based methods. In addition, machine learning tools have been recently explored to encode AIS historical (training) data for vessel trajectory prediction [12, 13, 14]. Common statistics-based techniques [15, 16] focus on analysing the available data in order to provide a visual representation and quantitative modelling of the fundamental statistical analytics. Grid-based methods [17, 18, 19] divide the area of interest into a spatial grid of indexed cells, each dealing with the static and dynamic properties of those vessels that passed through the specific element of the grid. This presents the benefit of reducing the overall scale of the information extraction process, as well as the storage for fast query/search operations. On the other hand, vector-based methods use a vectorial representation of maritime traffic, as sea routes are considered as a set of links connecting waypoints. This allows for high compactness of the waypoints and traffic routes representation at a global scale. A vector-based approach based on point clustering is the traffic route extraction for anomaly detection (TREAD) algorithm developed in [20]. TREAD generates a set of historical patterns of life represented by waypoint and route features, where waypoints are defined as stationary objects like ports and offshore platforms or entry/exit points.
Successful advancements on vector-based knowledge discovery [21, 22] have recently led to the development of an unsupervised graph-based methodology to identify the spatiotemporal dynamics of ship routes, and efficiently extract a compact representation of global maritime patterns from large volumes of historical AIS data, in the form of a maritime traffic graph (MTG). This method builds on recent advances in long-term vessel motion modeling [23, 24] whereby the dynamics of ships can be effectively described by a piecewise Ornstein-Uhlenbeck (OU) mean-reverting stochastic process. This approach, extensively validated against real-world datasets [25, 23], relies on model parameters that change only at waypoints (places where ships regularly stop or change their velocity). The OU model makes it possible to statistically represent with increased accuracy the dynamics of maritime traffic, associate sparse (in space and time) measurements to tracks, and hence synthesize historical ship trajectories into a sequence of waypoints connected together by a network of navigational legs (with non-maneuvering motion between waypoints). The MTG method works in an unsupervised way, is computationally efficient, and can deal with big data processing models and paradigms. The effectiveness of the proposed methodology has been successfully demonstrated on real-world extensive AIS datasets collected in the Iberian Coast and English Channel areas [21], as well as during the validation phase in four operational trials of the EU-H2020 project for maritime integrated surveillance awareness (MARISA) [22]. Starting from raw AIS streams, the MTG model can be automatically extracted based on the following key data processing steps as also shown in Fig. 6:

III-A1 Detection of navigational waypoints
Based on the OU dynamic model for accurate long-term ship prediction, statistical procedures for change detection [26, 21] can be applied to identify specific geospatial waypoints where the mean long-term velocity parameter of the underlying OU process tends to change. The detected waypoints represent: i) ports, where a ship’s speed is null either before (leaving the port) or after the change (entering the port); ii) navigational waypoints, where the direction of the ship changes (while the speed is possibly constant); iii) entry, exit, and entry/exit points, i.e. virtual boundary regions of the area of interest that summarise the entering and exiting traffic. In Fig. 6-(top-right map) a total of 162662 waypoints are identified during this step.
III-A2 Clustering of navigational waypoints
Based on the assumption that most maritime traffic is inherently regular, change points are expected to be concentrated around specific geospatial regions. To find these significant waypoint areas, standard density-based clustering techniques (such as density-based spatial clustering of applications with noise (DBSCAN) [27]) can be used in order to group together multiple change points into a lower number of distinct waypoint clusters. Intuitively, a clustering algorithm will look for regions where navigational change points are very close in the feature space and will identify outliers as points lying in low-density regions. In Fig. 6-(bottom-right map) a total of 2286 clusters are found during this step (each cluster is identified by a color).
III-A3 Merging and pruning procedures
When clustering algorithms are applied to large-scale real-world datasets involving a huge number of data points, the output generated by such unsupervised classification will usually need some post-processing. To this end, pruning and merging techniques can be used to progressively improve and simplify the overall MTG by reducing the number of graph entities (i.e., nodes and edges), and thus implicitly encode knowledge about ships’ patterns using a lower-dimensional representation. The number of graph edges can be reduced by eliminating those links characterized by low weights, these being least likely to represent recurrent patterns; and by merging closely-spaced edges (connecting waypoints in a cluster with waypoints in a different cluster) into one, as these are more efficiently represented by a single route. Fig. 6-(bottom-left image) represents the resulting MTG which consists of 99 nodes and 401 edges.
As a result, the structure of maritime traffic in the area of interest during a reference time interval can be represented, using graph formalism, by a directed graph where is the set of nodes, and is the set of edges. In particular, it is supposed that belongs to if and only if there are ship tracks with two consecutive waypoints and , where node is the predecessor of node . In this way, the adjacency matrix of the graph can be directly constructed from the raw ship tracks data (i.e., time-ordered lists of AIS messages) by simply identifying the transitions (and associated direction) of ships from a generic pair of nodes. We naturally assume that for any , so that diagonal elements of are set to zero, i.e. is a directed simple graph with no self-loops. A graph of order (i.e., number of nodes) and size (i.e., number of edges) is denoted as . In conclusion, the extracted waypoints – nodes and edges of the MTG – can be represented as vector features with different attributes directly extrapolated from the available AIS messages or computed during the graph extraction phase. The attributes of each graph entity will include aggregate georeferenced data and statistical analytics about the identified maritime patterns. The resulting geospatial information layer, that can be directly used for efficient mapping, query and search operations, serves as a baseline reference of maritime traffic for different MS applications.
III-B Maritime Anomaly Detection
Contextual information about historical maritime traffic extracted through knowledge discovery methods discussed in Section III-A can be highly beneficial as prior information on the nominal dynamic behaviour of vessels to determine when anomalous activities are happening. Common threats in the maritime domain include drug smuggling, piracy and terrorism, illegal immigration, marine pollution, prohibited imports/exports, or illegal, unreported and unregulated (IUU) fishing. Recently, anomaly detection strategies have been explored and applied in maritime traffic monitoring [18, 28, 29, 30, 31, 32] in order to detect unexpected ship stops or unexpected changes in course, i.e. any vessel’s anomalous deviation from the standard route that might be related to an activity that requires closer attention. Most research on maritime anomaly detection [18, 28, 29, 30] relies on two steps: i) knowledge discovery of maritime traffic patterns from historical data, and ii) anomaly detection via unsupervised learning.
More recently, an innovative statistical framework [31, 32] that combines the available context data with a parametric model of the vessel’s kinematic behaviour has received special attention. Unlike other works [18, 28, 29, 30], here the formulation of maritime anomaly detection is based on the OU dynamic model [23]. While it is useful that the OU model represents targets’ motion in terms of speed and direction, its key strength is its greatly reduced prediction uncertainties: deviations from prediction are less easily explained as random noise than they would be if other models were used. This line of research has focused on the development of anomaly detection strategies that provide the ability to reveal vessel deviations from standard navigational routes as well as dark deviations in the presence of possibly intentional surveillance gaps (due to AIS disablements or limited sensor coverage). Using the OU model to represent the vessel dynamics and contextual information to define the nominal behaviour at sea, the anomaly detector in [31, 32] runs a hypothesis testing procedure – the generalized likelihood ratio test – to make decisions on the existence of anomalous deviations within a given time window relying upon the available measurements (e.g. AIS, radar, SAR). This method, successfully applied to a real-world rendezvous detection scenario in [32], can integrate measurements from multiple sources and handle different levels of data unavailability. The use of multiple heterogeneous measurements associated with the vessel under track, e.g., AIS messages combined with non-cooperative contacts from coastal surveillance radar networks or satellite networks, can lead to a significant improvement of detection performance. From the end-user perspective, this method enables operators to establish the detection false alarm rate, which is a well-known issue for maritime command and control systems. Moreover, such an automatic detector enables quick reaction of human operators to anomalies at sea with much improved chances of a productive operation for surveillance and intercept units.
Further advances led to the design of a probabilistic joint anomaly detection and tracking methodology [33, 34] for sequential detection of maritime anomalous deviations and simultaneous vessel tracking where new contacts are periodically available based on surveillance coverage and reporting frequencies. This is motivated by the fact that maritime anomaly detection would ideally be performed in real-time, as new observations become available. This method allows for a mathematical definition of nominal vessel behaviour based on the combination of the OU dynamic model and context information extracted from historical data. The key idea behind this approach is to represent any anomalous deviation as a switching unknown control input that goes into action by modifying the nominal object dynamics, i.e., the OU mean velocity parameter. As a result, anomaly detection and target tracking can be recast as a special Bayesian state estimation problem for which recent advances on hybrid Bernoulli filtering [35] can be used. This Bayesian framework has been extended in [34] where an adaptive version, based on the multiple-model approach [36], of the single-model joint anomaly detection and tracking filter has been derived to handle unknown parameters in the underlying vessel dynamics.
IV Bayesian Information Fusion and MTT for MS
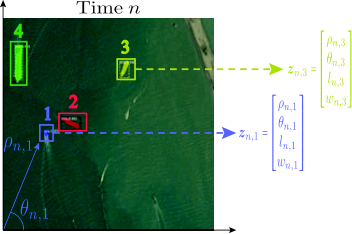
The main purpose of a multisensor MTT algorithm is to sequentially determine the number of ships in the MS area and estimate their states, e.g., position, velocity, course, and heading, by exploiting measurements from multiple heterogeneous sensors. The measurements are noisy observations of the kinematics, dimensions, shapes, or other features of the targets that can also be output of a classifier. The MTT problem thus consists of a detection step and an estimation step; mathematically, these can be formalized as follows. We denote with the unknown states of targets at time , with the measurements generated by sensor at time and with all the measurements from all sensors up to time . Fig. 7 represents examples of measurements that could be extracted from a MSP image acquired by a S-2 optical sensor by means of a segmentation and classification technique, as described in Section II-A. Based on the measurements , the likelihood functions and the probability density functions (pdfs) , e.g., the OU dynamic model, we wish to
- 1.
(Detection step) estimate the number of targets ;
- 2.
(Estimation step) estimate the target states .
In a Bayesian formulation, the estimation step essentially amounts to calculating at each time , the posterior pdfs of the states given all the measurements up to current time . MTT methods have to cope with various challenges, for example, the heterogeneity of the different information sources [37, 38, 39], and the measurement-origin uncertainty (MOU), i.e., the fact that it is unknown which target (if any) generated which measurement.
Existing MTT algorithms can be broadly classified as “vector-type” algorithms, such as the joint probabilistic data association (JPDA) filter [36] and the multiple hypothesis tracker (MHT) [40, 41], and “set-type” algorithms, such as the (cardinalized) probability hypothesis density filter [42, 43, 44, 45] and multi-Bernoulli filters [42, 46]. Vector-type algorithms represent the multitarget states and measurements by random vectors, whereas set-type algorithms represent them by random finite sets. Algorithms of both types have been developed and evaluated [47, 48]. Several limitations have been noted. First, the fusion of heterogeneous information sources is not straightforward. Second, they do not adapt to time-varying model parameters. And third, their complexity usually does not scale well in relevant system parameters, e.g., the number of sensors.
IV-A SPA-based Multisensor MTT Algorithm
An emerging approach to MTT and information fusion – one with flexibility, low complexity and useful scalability – is based on a factor graph and the sum-product algorithm (SPA) [38, 39, 49]. First, a factor graph representing the statistical model of the MTT problem is derived; then, the SPA is used to obtain a principled and intuitive approximation of the Bayesian inference needed for targets detection and estimation. A major advantage of the SPA is its ability to exploit conditional independence properties of random variables for a drastic reduction of complexity; thereby, SPA-based MTT algorithms can achieve an attractive performance-complexity compromise (see [39] and references therein), making them suitable for large-scale tracking scenarios involving a large number of targets, sensors, and measurements, and allowing their use on resource-limited devices. The SPA’s versatility and intuitiveness has enabled the establishment of a suite of Bayesian multisensor MTT tracking and information fusion algorithms where, similar to a construction kit system, algorithm parts can be combined, extended, or adapted to achieve desired functionalities and properties. SPA-based MTT algorithms can be extended to fuse heterogeneous data, e.g., terrestrial radars, SAR, optical sensors, and AIS. They can incorporate different dynamic models such as nearly constant velocity (NCV) or OU. They can also be designed to infer time-varying model parameters, such as detection probabilities of radar sensors; and to select an index from a menu of multiple target motion models. The use of SPA-based MTT algorithm is promising due to the highly efficient solution of the MOU problem combined with sequential Monte Carlo techniques, and is potentially suitable for arbitrary non-linear and non-Gaussian problems. The SPA-based MTT algorithm estimates the number of targets and their state at each time by efficiently solving the MOU problem and calculating the beliefs , which approximates the marginal posterior pdfs , by employing an iterative version of the SPA on a suitably devised factor graph [38, 39].

The SPA approach is illustrated in Fig. 8 via a simple 2-target example with two measurements and a single sensor. It is structured into four sections that refer to various beliefs and/or operations within the SPA-based MTT algorithm. The previous belief for target approximates the marginal posterior pdf of the previous state , i.e., , which is represented by the factor node “” in Fig. 8, and where denotes all the measurements up to time . In the prediction step, the previous belief is converted into the predicted belief, which approximates the pdf . The prediction is performed by utilizing an appropriate dynamic model , which is represented by the factor node “”. When the time interval between two consecutive time steps is large, e.g., in the order of hours, as for the case of two consecutive SAR images, the OU dynamic model can be used to reduce the prediction uncertainty. In the measurement update and data association step, the measurements and are used to evaluate the likelihoods and solve the MOU problem as described in [39]. This results in the current belief, which approximates the current marginal posterior pdf at time step . The current belief is centered around the current measurement and it is used for target detection and for state estimation at the current time step . In addition to the factor graph, Fig. 8 also visualizes the previous, predicted, and current beliefs for the first and second target in the upper and lower three-dimensional plots, respectively. The arrows in the lefthand plots represent the trajectories of the targets. Because of the uncertainty of target-measurement association and the proximity of the two targets, the current beliefs are bimodal. The smaller of the two modes is centered roughly at the position of the respective other target.
IV-A1 Multiple Dynamic Models and Integration of Contextual Information
Many tracking scenarios, such as those involving maneuvering targets, require the use of different dynamic models in different time periods in order to better describe targets that maneuver, such as alternating between NCV and constant turn-rate motion models. Therefore, following an interacting multiple model approach [50, Ch. 11], the evolution of the state of a target can be modelled by means of a set of possible dynamic models. A dynamic model (DM) index is introduced for each target to select the most appropriate DM at time [51, 52]. The DM indices are modeled as discrete random variables that are independent across targets and evolve in time according to a Markov chain. Bayesian inference on the DM indices and the target states can be still be performed by running the SPA algorithm on a suitable devised factor graph.
Similarly, the multiple DM formalism can be used to improve the performance of an MTT algorithm by integrating geographic information about standard maritime routes, e.g., MTGs obtained by historical Sat-AIS data, as explained in Section III-A. In particular, each navigational leg of an MTG, i.e., an edge connecting waypoint to waypoint , can be associated to a specific dynamic model characterized by a dominant direction, that is, from waypoint to waypoint . Still, a discrete random variable can be introduced to select the DM, that is the maritime route, that the target is following at time [53]. The evolution of is again model ed by a Markov chain. This results in a multisensor MTT algorithm that automatically takes into account the knowledge of standard maritime routes.
IV-A2 Fusion of Sat-AIS information
The SPA-based MTT algorithm can also be extended to fuse information coming from a Sat-AIS system [54, 53]. The fusion of this information is often difficult due to the asynchronicity and sparsity of the Sat-AIS messages, and the non-trivial association between messages and targets. Indeed, although each Sat-AIS message usually includes a unique maritime mobile service identity (MMSI), this may be absent, or mistaken for a different MMSI, or observed for the first time, in which case no prior information is available on the target-message association. The SPA-based MTT method can be efficiently extended to fuse Sat-AIS messages and measurements obtained from SAR, optical images, or other sensors, and to identify (or label) each detected ship by means of the MMSI. The label associated to each target is modelled as a discrete random variable: marginal posterior pdfs of the targets states and of the labels can still be efficiently obtained by running the SPA algorithm on a factor graph derived by the underlying statistical formulation of the problem.
IV-A3 Classification-Aided SPA-based Multitarget Tracking
As explained in Section II-A, modern deep learning segmentation and classification techniques are able to provide, in addition to kinematic data, class information for detected ships in satellite images. This information assigns each ship to one category among a predefined finite set of categories, e.g., cargo, dredging-military-sailboat, fishing, high speed craft, other-unknown-reserved, passenger or pilot boat. The SPA-based MTT approach can be efficiently extended for the exploitation of imperfect class information. This class information allows, for instance, the use of class-dependent DMs or measurement models. As a consequence, the inclusion of class information greatly improves the performance of the SPA-based MTT algorithm [55, 56].
IV-B Use case scenario: SPA-based MTT to Fuse AIS Data and SAR Measurements

The use-case scenario described in the current section aims at demonstrating how SPA-based MTT methods can be efficiently used to fuse measurements (ship detections) extracted from SAR images, which do not provide any information regarding ship identities, and the information contained in the AIS messages, i.e., ship’s position and the MMSI identifier [54, 53]. The AIS messages and SAR measurements were collected from an area of the Mediterranean Sea, off the shore of Malta, in the period from 8 September 2018 at 16:30 till 12 September 2018 at 16:47. The SAR measurements are extracted from a sequence of SAR images acquired by the COSMO-SkyMed constellation, by means of AI segmentation techniques as described in Section II-A, and consist of estimated GPS coordinates of the detected targets, i.e., latitude and longitude. The time interval between two consecutive AIS messages is at least of 5 hours. Fig. 9 shows two examples of subsampled quicklook SAR images (left column) acquired by the COSMO-SkyMed constellation and two examples of full resolution SAR images (right column) showing detected ships. Due to the MOU problem, it is not known in advance whether a SAR measurement is originated from a target or is a false alarm, and, in the case it has been originated by a target, it is not known by which target.
The main purpose of this use case is therefore to fuse SAR measurements with AIS messages in order to track potential targets and also identify them by exploiting the MMSI identifiers. The SAR measurements and AIS messages used by the SPA-based MTT method are represented in Fig. 10-(a) by the red crosses and green triangles, respectively. The red dashed rectangle delimits a geographical area of little interest from a tracking point of view with a large number of docked ships. Therefore, the SAR measurements and AIS messages from ships within this red dashed rectangle are discarded. The dynamic model used to describe ship motion in the SPA-based MTT algorithm is the OU model. Estimated positions of detected targets are calculated each time a SAR measurement is obtained, using all AIS messages gathered in the time interval between the current and the previous SAR measurements. Besides estimating the number of targets and their positions, the algorithm associates, when possible, an MMSI identifier to each of them. These MMSI identifiers are selected from a set consisting of all the MMSI identifiers so far observed. Fig. 10-(b) shows the output of the SPA-based MTT algorithm. One can observe that in the considered time period and area only a single target, identified by the algorithm as the vehicles carrier GAIA LEADER, is present. In particular, the red and blue lines show the real (derived by AIS messages) and estimated trajectories of the vehicles carrier GAIA LEADER. The SPA-based MTT algorithm is therefore able to provide fused trajectories of the targets using both SAR measurements and AIS messages and allows the identification of each estimated trajectory by associating it to the most likely MMSI identifier.
V Conclusions
The increasing availability of multiple space-based sensors providing detailed images of the ships at sea calls for the development of advanced image analysis techniques for target detection, segmentation and classification. In a companion paper [1], we introduced and discussed several satellite technologies for Maritime Surveillance (MS). In this paper, we reported the most recent deep-learning techniques and described their effectiveness in several use cases exploiting SAR, high-resolution (HR) and very high-resolution (VHR) images. We have presented Bayesian and allied statistical techniques to extract information (for example, common sea-lanes) from repositories of historical Sat-AIS data, and have shown how to track multiple targets using heterogeneous space-based and terrestrial sensors. Multitarget tracking (MTT) approaches based on the sum-product algorithm (SPA) have gained strong popularity thanks to their flexibility and scalability. A use case scenario that demonstrates the fusion of measurements extracted from SAR images acquired near the shores of Malta island with AIS messages highlights the effectiveness of the SPA-based MTT methods in the context of MS using space-based sensors.
References
- [1] G. Soldi, D. Gaglione, N. Forti, A. D. Simone, F. C. Daffinà, G. Bottini, D. Quattrociocchi, L. M. Millefiori, P. Braca, S. Carniel, P. Willett, A. Iodice, D. Riccio, and A. Farina, “Space-based global maritime surveillance. Part I: Satellite technologies,” IEEE Aerosp. Electron. Syst. Mag. (Submitted), 2020.
- [2] I. Goodfellow, Y. Bengio, and A. Courville, “Deep learning,” 2016, book in preparation for MIT Press. [Online]. Available: http://www.deeplearningbook.org
- [3] A. Kendall, V. Badrinarayanan, , and R. Cipolla, “Bayesian segnet: Model uncertainty in deep convolutional encoder-decoder architectures for scene understanding,” arXiv preprint arXiv:1511.02680, 2015.
- [4] O. Ronneberger, P. Fischer, and T. Brox, “U-Net: Convolutional networks for biomedical image segmentation,” in Medical Image Computing and Computer-Assisted Intervention (MICCAI), ser. LNCS, vol. 9351. Springer, 2015, pp. 234–241.
- [5] S. Capobianco, L. Scommegna, and S. Marinai, “Historical handwritten document segmentation by using a weighted loss,” in Proc. ANNPR, 2018, pp. 395–406.
- [6] M. Gargiulo, D. A. G. Dell’Aglio, A. Iodice, D. Riccio, and G. Ruello, “Semantic segmentation using deep learning: A case of study in Albufera Park, Valencia,” in Proc. IEEE MetroAgriFor, 2019, pp. 134–138.
- [7] K. He, G. Gkioxari, P. Dollár, and R. Girshick, “Mask R-CNN,” in 2017 IEEE International Conference on Computer Vision (ICCV), 2017, pp. 2980–2988.
- [8] E. H. Adelson, C. H. Anderson, J. R. Bergen, P. J. Burt, and J. M. Ogden, “Pyramid methods in image processing,” RCA Engineer, vol. 29, no. 6, pp. 33–41, 1984.
- [9] K. He, X. Zhang, S. Ren, and J. Sun, “Deep residual learning for image recognition,” in 2016 IEEE Conference on Computer Vision and Pattern Recognition (CVPR), 2016, pp. 770–778.
- [10] Z. Xiao, X. Fu, L. Zhang, and R. S. M. Goh, “Traffic pattern mining and forecasting technologies in maritime traffic service networks: A comprehensive survey,” IEEE Trans. Intell. Transp. Syst., pp. 1–30, 2019.
- [11] D. Zissis, K. Chatzikokolakis, G. Spiliopoulos, and M. Vodas, “A distributed spatial method for modeling maritime routes,” IEEE Access, vol. 8, pp. 47 556–47 568, 2020.
- [12] A. Valsamis, K. Tserpes, D. Zissis, D. Anagnostopoulos, and T. Varvarigou, “Employing traditional machine learning algorithms for big data streams analysis: The case of object trajectory prediction,” Journal of Systems and Software, vol. 127, pp. 249–257, 2017.
- [13] D. Nguyen, R. Vadaine, G. Hajduch, R. Garello, and R. Fablet, “A multi-task deep learning architecture for maritime surveillance using AIS data streams,” IEEE International Conference on Data Science and Advanced Analytics, pp. 331–340, 2018.
- [14] N. Forti, L. M. Millefiori, P. Braca, and P. Willett, “Prediction of vessel trajectories from AIS data via sequence-to-sequence recurrent neural networks,” in IEEE International Conference on Acoustics, Speech and Signal Processing, 2020.
- [15] L. Cazzanti, A. Davoli, and L. M. Millefiori, “Automated port traffic statistics: From raw data to visualisation,” in IEEE International Conference on Big Data, 2016, pp. 1569–1573.
- [16] Y. Li, R. W. Liu, J. Liu, Y. Huang, B. Hu, and K. Wang, “Trajectory compression-guided visualization of spatio-temporal AIS vessel density,” in 8th International Conference on Wireless Communications & Signal Processing, 2016.
- [17] N. A. Bomberger, B. J. Rhodes, M. Seibert, and A. M. Waxman, “Associative learning of vessel motion patterns for maritime situation awareness,” in 9th International Conference on Information Fusion, 2006.
- [18] B. Ristic, B. La Scala, M. Morelande, and N. Gordon, “Statistical analysis of motion patterns in AIS data: Anomaly detection and motion prediction,” in International Conference on Information Fusion, 2008.
- [19] Z. Xiao, L. Ponnambalam, X. Fu, and W. Zhang, “Maritime traffic probabilistic forecasting based on vessels’ waterway patterns and motion behaviors,” IEEE Trans. Intell. Transp. Syst., vol. 18, no. 11, pp. 3122–3134, 2017.
- [20] G. Pallotta, M. Vespe, and K. Bryan, “Vessel pattern knowledge discovery from ais data: A framework for anomaly detection and route prediction,” Entropy, vol. 15, no. 6, pp. 2218–2245, 2013.
- [21] P. Coscia, P. Braca, L. M. Millefiori, F. A. N. Palmieri, and P. Willett, “Multiple Ornstein-Uhlenbeck processes for maritime traffic graph representation,” IEEE Trans. Aerosp. Electron. Syst., vol. 54, no. 5, pp. 2158–2170, 2018.
- [22] N. Forti, L. Millefiori, and P. Braca, “Unsupervised extraction of maritime patterns of life from Automatic Identification System data,” in MTS/IEEE OCEANS, 2019.
- [23] L. M. Millefiori, P. Braca, K. Bryan, and P. Willett, “Modeling vessel kinematics using a stochastic mean-reverting process for long-term prediction,” IEEE Trans. Aerosp. Electron. Syst., vol. 52, no. 5, pp. 2313–2330, 2016.
- [24] L. M. Millefiori, P. Braca, and P. Willett, “Consistent estimation of randomly sampled Ornstein-Uhlenbeck process long-run mean for long-term target state prediction,” IEEE Signal Process. Lett., vol. 23, no. 11, pp. 1562–1566, 2016.
- [25] L. M. Millefiori, G. Pallotta, P. Braca, S. Horn, and K. Bryan, “Validation of the Ornstein-Uhlenbeck route propagation model in the Mediterranean Sea,” in MTS/IEEE OCEANS, 2015.
- [26] L. M. Millefiori, P. Braca, and G. Arcieri, “Scalable distributed change detection and its application to maritime traffic,” in IEEE International Conference on Big Data, 2017, pp. 1650–1657.
- [27] M. Ester, H.-P. Kriegel, J. Sander, and X. Xu, “A density-based algorithm for discovering clusters in large spatial databases with noise,” in Intenational Conference on Data Mining and Knowledge Discovery, vol. 4, 1996, pp. 226–231.
- [28] R. O. Lane, D. A. Nevell, S. D. Hayward, and T. W. Beaney, “Maritime anomaly detection and threat assessment,” in 13th International Conference on Information Fusion, 2010, pp. 1–8.
- [29] K. Kowalska and L. Peel, “Maritime anomaly detection using gaussian process active learning,” in 15th International Conference on Information Fusion, 2012, pp. 1164–1171.
- [30] M. Vespe, I. Visentini, K. Bryan, and P. Braca, “Unsupervised learning of maritime traffic patterns for anomaly detection,” in 9th IET Data Fusion Target Tracking Conference, 2012, pp. 1–5.
- [31] E. d’Afflisio, P. Braca, L. M. Millefiori, and P. Willett, “Detecting anomalous deviations from standard maritime routes using the Ornstein-Uhlenbeck process,” IEEE Trans. Signal Process., vol. 66, no. 24, pp. 6474–6487, 2018.
- [32] E. d’Afflisio, P. Braca, L. M. Millefiori, and P. Willett, “Maritime anomaly detection based on mean-reverting stochastic processes applied to a real-world scenario,” in 21st International Conference on Information Fusion, 2018, pp. 1171–1177.
- [33] N. Forti, L. M. Millefiori, and P. Braca, “Hybrid Bernoulli filtering for detection and tracking of anomalous path deviations,” in 21st International Conference on Information Fusion, 2018, pp. 1178–1184.
- [34] N. Forti, L. M. Millefiori, P. Braca, and P. Willett, “Anomaly detection and tracking based on mean–reverting processes with unknown parameters,” in IEEE International Conference on Acoustics, Speech and Signal Processing, 2019, pp. 8449–8453.
- [35] N. Forti, G. Battistelli, L. Chisci, and B. Sinopoli, “Joint attack detection and secure state estimation of cyber-physical systems,” International Journal of Robust and Nonlinear Control, 2019.
- [36] Y. Bar-Shalom, P. K. Willett, and X. Tian, Tracking and Data Fusion: A Handbook of Algorithms. Storrs, CT,: Yaakov Bar-Shalom, 2011.
- [37] G. Vivone, P. Braca, and J. Horstmann, “Knowledge-based multitarget ship tracking for HF surface wave radar systems,” IEEE Trans. Geosci. Remote Sens., vol. 53, no. 7, pp. 3931–3949, Jul. 2015.
- [38] F. Meyer, P. Braca, P. Willett, and F. Hlawatsch, “A scalable algorithm for tracking an unknown number of targets using multiple sensors,” IEEE Trans. Signal Process., vol. 65, no. 13, pp. 3478–3493, Jul. 2017.
- [39] F. Meyer, T. Kropfreiter, J. L. Williams, R. A. Lau, F. Hlawatsch, P. Braca, and M. Z. Win, “Message passing algorithms for scalable multitarget tracking,” Proc. IEEE, vol. 106, no. 2, pp. 221–259, Feb. 2018.
- [40] D. B. Reid, “An algorithm for tracking multiple targets,” IEEE Trans. Autom. Control, vol. 24, no. 6, pp. 843–854, Dec. 1979.
- [41] C. Chong, S. Mori, and D. B. Reid, “Forty years of multiple hypothesis tracking - A review of key developments,” in Proc. FUSION-18, 2018, pp. 452–459.
- [42] R. Mahler, Statistical Multisource-Multitarget Information Fusion. Norwood, MA: Artech House, 2007.
- [43] R. P. S. Mahler, “Multitarget Bayes filtering via first-order multitarget moments,” IEEE Trans. Aerosp. Electron. Syst., vol. 39, no. 4, pp. 1152–1178, Oct. 2003.
- [44] R. Mahler, “PHD filters of higher order in target number,” IEEE Trans. Aerosp. Electron. Syst., vol. 43, no. 4, pp. 1523–1543, Oct. 2007.
- [45] B.-T. Vo, B.-N. Vo, and A. Cantoni, “Analytic implementations of the cardinalized probability hypothesis density filter,” IEEE Trans. Signal Process., vol. 55, no. 7, pp. 3553–3567, Jul. 2007.
- [46] ——, “The cardinality balanced multi-target multi-Bernoulli filter and its implementations,” IEEE Trans. Signal Process., vol. 57, no. 2, pp. 409–423, Feb. 2009.
- [47] A. Ponsford and J. Wang, “A review of high frequency surface wave radar for detection and tracking of ships,” Turk. J. Elec. Eng. & Comp. Sci., vol. 18, pp. 409–428, May 2010.
- [48] S. Maresca, P. Braca, J. Horstmann, and R. Grasso, “Maritime surveillance using multiple high-frequency surface-wave radars,” IEEE Trans. Geosci. Remote Sens., vol. 52, no. 8, pp. 5056–5071, Aug. 2014.
- [49] D. Gaglione, G. Soldi, F. Meyer, F. Hlawatsch, P. Braca, A. Farina, and M. Z. Win, “Bayesian information fusion and multitarget tracking for maritime situational awareness,” IET Radar Sonar Navi. (in press), 2020.
- [50] Y. Bar-Shalom, X. R. Li, and T. Kirubarajan, Estimation with Applications to Tracking and Navigation. New York, NY: Wiley, 2001.
- [51] G. Soldi and P. Braca, “Online estimation of unknown parameters in multisensor-multitarget tracking: a belief propagation approach,” in Proc. FUSION-18, Cambridge, U.K., Jul. 2018, pp. 2151–2157.
- [52] G. Soldi, F. Meyer, P. Braca, and F. Hlawatsch, “Self-tuning algorithms for multisensor-multitarget tracking using belief propagation,” IEEE Trans. Signal Process., vol. 67, no. 15, pp. 3922–3937, Aug. 2019.
- [53] G. Soldi, D. Gaglione, F. Meyer, F. Hlawatsch, P. Braca, A. Farina, and M. Z. Win, “Heterogeneous information fusion for multitarget tracking using the sum-product algorithm,” in Proc. IEEE ICASSP-19, Brighton, U.K., May 2019, pp. 5471–5475.
- [54] D. Gaglione, P. Braca, and G. Soldi, “Belief propagation based AIS/radar data fusion for multi-target tracking,” in Proc. FUSION-18, Cambridge, U.K., Jul. 2018, pp. 2143–2150.
- [55] D. Gaglione, G. Soldi, P. Braca, G. De Magistris, F. Meyer, and F. Hlawatsch, “Classification-aided multitarget tracking using the sum-product algorithm,” IEEE Signal Process. Lett., vol. 27, pp. 1710–1714, 2020.
- [56] G. Soldi, D. Gaglione, G. De Magistris, P. Braca, P. Stinco, G. Ferri, A. Tesei, and K. Le Page, “Underwater tracking based on the sum-product algorithm enhanced by a neural network detections classifier,” in Proc. IEEE ICASSP-20, May 2019, pp. 5460–5464.