Interaction of void spacing and material size effect on inter-void flow localisation
Abstract
The ductile fracture process in porous metals due to growth and coalescence of micron scale voids is not only affected by the imposed stress state but also by the distribution of the voids and the material size effect. The objective of this work is to understand the interaction of the inter-void spacing (or ligaments) and the resultant gradient induced material size effect on void coalescence for a range of imposed stress states. To this end, three dimensional finite element calculations of unit cell models with a discrete void embedded in a strain gradient enhanced material matrix are performed. The calculations are carried out for a range of initial inter-void ligament sizes and imposed stress states characterised by fixed values of the stress triaxiality and the Lode parameter. Our results show that in the absence of strain gradient effects on the material response, decreasing the inter-void ligament size results in an increase in the propensity for void coalescence. However, in a strain gradient enhanced material matrix, the strain gradients harden the material in the inter-void ligament and decrease the effect of inter-void ligament size on the propensity for void coalescence.
1 Introduction
In porous metals, void coalescence often drives the onset of the macroscopic flow localisation that marks the end of uniform deformation and acts as a precursor to failure, as well as the initiation and propagation of ductile cracks [1, 2, 3]. Previous studies suggest that for conventional plasticity theory, where no material length scale enters the constitutive law (absence of stress/strain gradient induced size effect), a decrease in the inter-void spacing promotes void coalescence [4, 5] and results in the collapse of the yield surface [6, 7]. While for a fixed inter-void spacing, it is well established that the imposed stress state has a pronounced effect on the onset of void coalescence in conventional plasticity theory. For example, it has been shown that an increase in the imposed stress triaxiality (a ratio of the first to second stress invariant) promotes void growth and early onset of void coalescence [8, 9, 10, 11]. Void coalescence is simply the event where the plastic flow localises within the inter-void ligaments and successively links the neighboring voids [9]. The plastic flow localisation within the inter-void ligament, however, will induce plastic strain gradients that in turn may affect the strengthening and hardening of the material. This raises a fundamental question: how does the interaction of inter-void spacing (or ligament size) and the gradient induced material size effect, affect the localisation of plastic flow causing void coalescence for a given stress state?
The gradient induced size effect resulting in strengthening and hardening in metals has been confirmed in many material tests involving non-uniform deformation including indentation [12, 13], torsion [14], and bending [15]. The size dependent material response on the micron scale in metal plasticity implies that the growth of micron sized voids also exhibits significant size effects [16, 17]. In general, it has been shown that the gradient induced size effect leads to slower growth rates for smaller voids [18, 19, 20, 21, 22]. An accurate representation of void coalescence due to plastic flow localisation within micron sized inter-void ligaments, therefore, also requires material models that represent stresses over the relevant length scales. Phenomenological theories describing the strengthening and hardening due to plastic strain gradients express the plastic work in terms of both plastic strain and plastic strain gradient, thereby introducing a length scale into the material model. Herein, the strain gradient plasticity theory proposed by Gudmundson [23] is used, which includes both dissipative (non-recoverable) and energetic (recoverable) gradient contributions within a small strain formulation based on visco-plasticity. The mathematical formulation and associated variational structure originate from Fleck and Willis [24], and the material model is implemented into the commercial finite element software ABAQUS using a user element (UEL) subroutine [25].
The objective of this work is to understand the interaction of the inter-void spacing (or ligament size) and the resultant gradient induced material size effect on void coalescence for a range of imposed stress states. To achieve this, three dimensional finite element unit cell calculations for a periodic array of initially spherical voids embedded in a strain gradient enhanced material matrix are carried out. Several unit cell geometries have been analyzed to investigate the effect of inter-void ligament size under multiple loading conditions. The imposed stress states are characterised by fixed values of the stress triaxiality and the Lode parameter (a measure of the third stress invariant). The value of the Lode parameter is shown to affect the evolution of voids in computations involving conventional plasticity theory [26, 27, 28, 29, 5] and in experiments [30, 31, 32] only at relatively low stress triaxiality levels. However, it is likely that in an anisotropic material matrix [33] with anisotropy introduced by the void distribution [5], as for the present investigation, the effect of the Lode parameter can be important even at high stress triaxialities.
Our results show that for a conventional material matrix, increasing the inter-void ligament size results in an increase in the critical stress to void coalescence, up to a threshold value of inter-void ligament size. The sensitivity of the critical stress to the inter-void ligament size is found to increase with increasing stress triaxiality. The quantitative effect of the Lode parameter is found to be small for the stress triaxiality values varying from to . However, for inter-void ligament sizes below the threshold value, the critical stress is smallest for a Lode parameter value of , whereas above the threshold value the critical stress is smallest for a Lode parameter value of . For a void in a strain gradient enhanced material matrix, the value of the critical stress for void coalescence increases with increasing length parameter i.e. increasing gradient effect. This effect of the length parameter on the critical stress magnitude is found to increase with increasing imposed stress triaxiality and decreasing inter-void ligament size. This is because at higher stress triaxiality values and for smaller inter-void ligament sizes, there is an increase in the propensity for plastic flow localisation that introduces strong plastic strain gradients and in turn hardens the ligament. This mechanism leads to a decrease in the dependence of critical stress on the inter-void ligament size with increasing length parameter. The gradient induced strengthening also tends to homogenize the deformation in the unit cell thus decreasing the effect of the Lode parameter.
The structure of the manuscript is as follows. Section 2 frames the study and presents the numerical method. The unit cell geometries considered, the method utilized to impose proportional loading throughout the deformation history, and the strain gradient plasticity material model are also presented in Section 2. The numerical results are presented and discussed in Section 3. Finally, the key results and conclusions of this work are summarized in Section 4.
2 Problem formulation and modelling approach
This work considers a limit load-type analysis to determine the critical stress level at which a given microstructure configuration loses load carrying capacity. Hence, an elastic-perfectly plastic material model is employed. The configuration of the unit cell and the simulation setup is described in Section 2.1, while the approach to prescribe a constant value of stress triaxiality and Lode parameter is outlined in Section 2.2.
2.1 Unit cell geometry and FE mesh
Three dimensional finite element calculations are carried out to model the response of an array of spherical voids with initial radius , Fig. 1. The unit cell has edge lengths along the three coordinate axes, (), and inter-void spacings thereby equal . Symmetry about three planes perpendicular to the coordinate axes implies that only of the unit cell needs to be modelled.

For all unit cells considered, the initial void volume fraction is , where . The initial void radius, , is kept constant, while the cell dimensions are varied to achieve various initial inter-void spacings as in ref. [5]. The geometric parameters for the different cell dimensions are given in Table 1. For all unit cells, . Finite element meshes for four unit cell configurations are shown in Fig. 2. The modelling setup does not account for softening due to void evolution since a small strain formulation is used. It is assumed that the unit cell represents the material condition immediately before failure, neglecting the deformation history leading to this state. Hence, model predictions for the loss of load carrying capacity signal the onset of localisation. The critical equivalent stress at the onset of localisation is recorded and reported in the results section.
2.2 Numerical method
The unit cells are subject to prescribed displacements and the boundary conditions applied to the faces of the cell are
| (1) |
The applied symmetry boundary conditions are
| (2) |
In Eq. (2.2), is prescribed and the time history of the displacements and are determined such that a prescribed stress state is maintained. The loading direction is fixed in stress space by enforcing constant ratios between the normal stress components throughout the deformation history such that
| (3) |
where and are constants. The overall stress components are found by volume averaging over all elements, such that: , where is the unit cell volume.
The overall effective stress, , and the overall hydrostatic stress, , are given by
which in terms of the relative stress ratios become
| (4) | |||
| (5) |
The stress triaxiality, , and the Lode parameter, , are given by
| (6) |
and
| (7) |
The overall effective strain, , is given by
| (8) |
where the strain components, , are found in a way analogous to the stress components.
2.2.1 Multiple point constraints
The macroscopic normal stress components vary throughout the deformation, but the stress ratios are maintained in each increment of the simulation according to Eq. (3). This is achieved by creating multi point constraints through the user subroutine MPC in ABAQUS, which enables enforcing relationships between degrees of freedom in one or more nodes.
Additional degrees of freedom are added to impose boundary conditions on all sides of the model while prescribing the stress ratios. Three dummy nodes, , are created outside of the mesh and connected to one connector node, , in the mesh as shown in Fig. 3. This connection is made through spring elements (SPRING2 elements from the ABAQUS element library). The displacement in the -direction is then prescribed at the -dummy node, while the displacements (in the - and -directions) corresponding to the desired stress triaxiality and Lode parameter are calculated and applied to the - and -dummy nodes. The displacement of the connector node, , is coupled to the displacement of the nodes located at , and in the direction of the respective face normals. In this way, the displacement of the dummy nodes, , is linked to the unit cell.
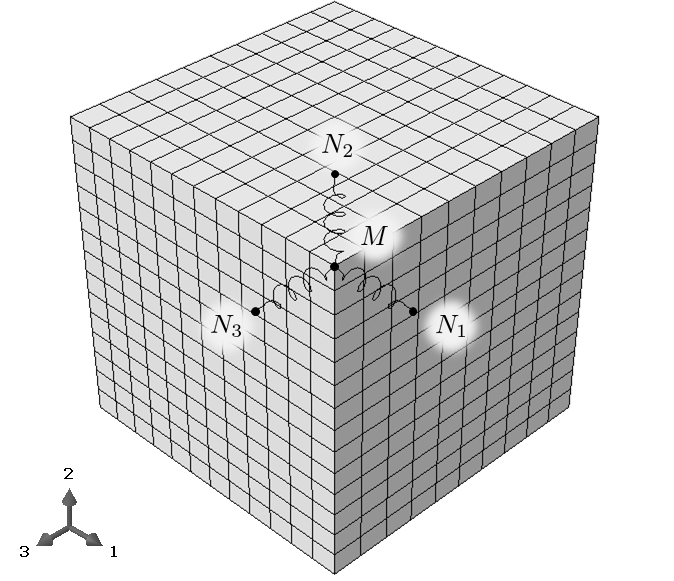
The displacement of the dummy nodes, , is related to the forces, , at the faces of the unit cell through
| (9) |
and being the spring element constants given by , where the factor of is introduced to stabilise the numerical solution, following Ref. [34]. The forces, , are the resultant of all traction across the corresponding surface and relates to the macroscopic stresses through
| (10) |
where is the area over which the forces act. Combining Eqs. (3), (9), and (10), gives the dummy node displacements
| (11) |
where and are input values for the stress ratio, is the displacement of dummy node in the direction of , is the displacement in -direction of the connector node , are areas from Eq. (10), and are the spring element constants. Another relevant procedure for imposing multiple point constraints without spring elements can be found in [35].
The calculations are carried out for three values of Lode parameter, , and . The Lode parameter values () and () correspond to overall axisymmetric stress states, while () correspond to an overall state of shear plus hydrostatic stress. For each value of Lode parameter, three triaxialities are considered, , and . The values for and to achieve these stress states are given in Table 2.
| L | T | ||
|---|---|---|---|
| -1 | |||
| 1 | 0.4 | 0.4 | |
| 2 | 0.625 | 0.625 | |
| 3 | 0.727273 | 0.727273 | |
| 0 | |||
| 1 | 0.634 | 0.268 | |
| 2 | 0.776 | 0.552 | |
| 3 | 0.8386 | 0.6772 | |
| 1 | 1 | ||
| 1 | 1 | 0.25 | |
| 2 | 1 | 0.57 | |
| 3 | 1 | 0.70 |
The calculations were carried out using the commercial finite element code ABAQUS with the gradient theory applied to the matrix material through a UEL subroutine. The reader is referred to Ref. [25] for further details on the implementation. The calculations use 20-node user defined elements. The number of elements in the finite element meshes is varied from a minimum of 1896 to a maximum of 2512 elements, Fig. 2.
2.3 Material model: Strain gradient plasticity
The gradient enhanced constitutive model employed is based on the visco-plastic strain gradient plasticity theory proposed by Gudmundson [23] in the context of the mathematical formulation in terms of minimum principles proposed by Fleck and Willis [24]. For the dissipative version considered, the theory accounts for internal elastic energy storage due to elastic strain and dissipation due to the plastic strain rate, , and its spatial gradient, . Contributions from plastic strain gradients to free energy is ignored. The Principle of Virtual Work (PVW) in Cartesian components is expressed by
| (12) |
where and are the Cauchy stress tensor and the stress deviator, respectively. The micro-stress, , is work conjugate to the plastic strain rate, , and is a higher order stress, work conjugate to the plastic strain rate gradient, . The right hand side of the PVW includes the conventional traction, work conjugate to the boundary displacement rate, , and the higher order traction, , work conjugate to the plastic strain rate, . Here, the outward unit normal to the surface is . Balance laws for the stress quantities are given by
| (13) |
where, the first set of equations is the conventional equilibrium equations in the absence of body forces, and the second set is the higher order equilibrium equations. The higher order boundary conditions are imposed such that the void surface is higher order traction free, while symmetry conditions are imposed at the exterior of the cell through .
2.4 Constitutive equations
The rate-dependent visco-plastic formulation employs a potential to account for plastic dissipation as follows
| (14) |
Here, is the gradient enhanced effective stress, related to the current matrix flow stress through , with denoting the reference strain rate, and denoting the rate-sensitivity exponent. The material in this work does not undergo strain hardening, making independent of and equal to the material yield stress . The viscoplastic law is implemented following the algorithm presented in Ref. [36] to efficiently approach the rate-independent limit. A gradient enhanced effective plastic strain rate is given by
| (15) |
and the associated work conjugate gradient enhanced effective stress by
| (16) |
Here, is a dissipative constitutive length parameter that enters for dimensional consistency. The superscript refers to dissipative quantities, and the dissipative stress quantities are given by
| (17) |
The dissipative length parameter controls the strengthening size effect with an increase in the dissipative length parameter giving an increase in the apparent yield stress in the presence of strain gradients, see [37, 38]. This work is a limit load analysis, which, by definition, is done to determine the overall yield criterion for a given, specific configuration. Limit load analyses normally idealise materials as perfectly plastic. To avoid strain hardening from the energetic gradient contributions, the energetic length parameter, , has been set to zero in this work, and, consequently, the corresponding energetic quantities are omitted.
3 Numerical results and discussion
Throughout, the following material parameters are used; , and , where is the yield stress, is Young’s modulus, is the Poisson ratio, and is the strain rate sensitivity exponent. The value of is considered sufficiently small for the results to approximate a rate-independent material response. The influence of the Lode parameter, , the stress triaxiality, , and the normalised length parameter, , is studied. The effect of the inter-void ligament size is discussed in combination with the other parameters, , , and .
3.1 Critical equivalent stress at localisation
Figure 4 presents the equivalent stress-strain curves for two distinct Lode parameters, and , but for a fixed stress triaxiality, , and a fixed inter-void ligament size of . The equivalent stress-strain curves are depicted for three length parameters, being, , and as well as for the conventional limit where .
The material response shows a clear effect of plastic strain gradients, such that the larger the length parameter, the higher the equivalent stress level. This means that an increase in the stress level is obtained when down-scaling the microstructure and, thus, yielding of the material is delayed due to increasing strain gradient strengthening. The critical equivalent stress, , signaling localisation (and coalescence) is taken to be at the plateau of the equivalent stress-strain curve. Several ways exists to establish a coalescence criteria based on either critical stress or strain. The method employed in this work is inspired by the work of [39]. The critical stresses have been extracted from the end of the equivalent stress-strain curves (as shown in Figures 4a and b). Taking the example of Fig. 4a, the conventional material (), the difference between the equivalent stress at and is less than .
3.2 Conventional material: Effect of the inter-void ligament size
The conventional limit, , is considered to set the scene for the study of material size effects. The focus here is the effect of inter-void ligament size on the critical stress at localisation under various loading conditions.
First, three values of the Lode parameter are considered, , and , for a fixed stress triaxiality, . Figure 5 shows the critical equivalent stress as a function of the inter-void ligament size. For the six smallest inter-void ligaments, the critical equivalent stress is seen to increase when the inter-void ligament becomes bigger irrespective of the value of the Lode parameter. The increase in the critical stress ties to localisation occurring more easily in small inter-void ligaments lowering the load carrying capacity of the unit cell. As the inter-void ligament size increases, the -ligament can sustain a higher stress level before localisation, leading to an increase in critical equivalent stress. Also, for the six smallest inter-void ligaments, an increase in the critical stress is found with increasing Lode parameter values. Thus, the lowest critical equivalent stress is found for . The dependence on the Lode parameter can be rationalised by considering the imposed stress state. In comparison to the other cases, the relative stress component, , is the largest when (see Tab. 2), and localisation is therefore expected in the -ligament at a lower overall deformation. In contrast, the takes the lowest value for , resulting in delayed localisation and the highest critical equivalent stress obtained. In Ref. [5], void coalescence was found to occur along the ligament with the smallest applied stress for . For all Lode parameters, the relative stress component in the -ligament will be smallest as is always the lowest stress ratio. For , coalescence occurs in the direction of the smallest inter-void ligament size. This corresponds to the -ligament for all geometries except when as this is a perfect cube, Table 1.

There is, however, a shift in the localisation pattern when the -ligament becomes sufficiently wide, for example, a drop in the coalescence stress is found for for . The load carrying capacity of the material increases when the distribution of voids diverge from a regular array, i.e. when . However, the load carrying capacity will decrease if the arrangement of the voids is such that the inter-void ligament size, in any direction, is too small (e.g. ). At the configuration with , there is no bias towards the -ligament since the unit cell takes a cubic shape. The shift in the localisation is especially prominent for (a state of combined hydrostatic tension and shear) where plastic flow localises at across the cubic unit cell leading to an early loss of load carrying capacity. The shift in the localisation is demonstrated by depicting the contours of the effective plastic strain for two distinct unit cells ( and ) subjected to and in Figs. 6 and 7. The material response remains conventional such that , and the loading conditions are described by and . For the conventional material, the second term of Eq. (15) is zero () and the term gradient enhanced effective plastic strain refers to the time integration of only the first term of Eq. (15). For the elongated unit cell (), localisation is seen to occur in the smallest ligament, , whereas localisation is seen to occur along two corners of the cubic unit cell (), indicating that the deformation is localised along i.e. across the diagonal. Figure 6 shows the contour of equivalent plastic strain across the faces of the cell, while Fig. 7(a) and (b) show the contour of the effective plastic strain in the diagonal cross-section of both unit cells at an overall effective strain of . By comparing the two contours it is seen that plastic flow is observed across the entire cross-section indicating localisation at for the cubic model, . In contrast, the plastic flow is constricted for shown top right in Fig. 7.
Next, the effect of stress triaxiality is considered. In Fig. 8, the critical stress for a conventional material, , is shown as a function of the inter-void ligament size for and for a fixed value of the Lode parameter, . In the conventional limit, a high level of stress triaxiality yields low critical stress for all ligament sizes considered. The reason being that a high stress triaxiality corresponds to higher relative stress components, and . Figure 8 shows little effect of ligament size on the critical equivalent stress for the low value of triaxiality. For , the relative stress transverse to the main loading direction is insufficient to invoke localisation in the inter-void ligament and the effect of the ligament size will be limited. The cell instead undergoes macroscopic localisation and, consequently, does not exhibit a profound dependence on the inter-void ligament size. This is in line with results presented in Ref. [1], where has been found to be the limit below which the onset of macroscopic localisation is essentially simultaneous with void coalescence. The results for and in Fig. 8 show that the critical equivalent stress is dependent on inter-void ligament size.
A small drop in the critical equivalent stress is seen to occur for the largest ligament for all values of triaxiality in Fig. 8. The effect is most prominent for the highest triaxiality, . Figure 9 shows the contour gradient enhanced effective plastic strain of the cubic cell () at an effective stress of . At a sufficiently large strain, plasticity is seen to initiate at the corner opposite to the void. Due to the symmetry of both the loading condition ( for ) and the unit cell, bands of plastic deformation are observed to stretch across the and faces, ultimately lowering the coalescence stress giving the drop as seen in Fig. 8.


3.3 Gradient enriched material: Effect of the inter-void ligament size
The effect of gradient strengthening in the matrix material is introduced through the length parameter (see Section 2.3). One can imagine down-scaling the microstructure when increasing the value of . Three values of the length parameter, , and , are considered in the following for all combinations of the Lode parameter, , and stress triaxiality, . Figure 10 shows the critical effective stress, , as a function of the inter-void ligament size, , for all combinations. The results obtained for a conventional material, are presented as a reference (see Section 3.2).
The general observation is that the critical stress at localisation increases with the magnitude of the length parameter (down-scaling the microstructure). However, the critical stress has a natural upper bound where the gradient strengthening is so severe that the entire matrix material yields. At such large values of the length parameter, the effect of the Lode parameter, stress triaxiality, and inter-void ligament size vanish and the critical equivalent stress is identical for all combinations of geometry and loading condition. The threshold value is evident from Figs. 10(a)-(i).
Figure 11(a)-(c) show how the length parameter affects the plastic flow in the unit cells by comparing contours of the gradient enhanced plastic equivalent strain, , (see Eq. (15)) for a ligament size of subject to and . The contours are extracted at an overall equivalent strain of . Figure 11(a) displays the conventional material response where localisation occurs in the -ligament. At the same level of the overall deformation, a significantly lower effective plastic strain is observed in Fig. 11(b) and (c) when increasing the length parameter. For , Fig. 11(b), some plasticity is seen to develop in the -ligament, but far less than in the conventional case, while the plasticity has barely initiated at this level of the deformation for Fig. 11(c). The corresponding equivalent stress is shown in Figs. 11(d)-(f). It is seen that the level of stress in the unit cell increases with increasing length parameter. The critical equivalent stress is seen to increase with increased length parameter in Fig. 10 and the material can therefore withstand higher stresses.
Figure 12 shows the change in the deformation mechanism that occurs with increased gradient strengthening. The contour of the normalised rate of equivalent plastic strain, , is shown for the unit cell with the smallest inter-void ligament, under loading conditions giving and for the conventional material with and the material with the greatest gradient strengthening contribution, . Figure 12(a) shows that plastic deformation has developed and localised in the -ligament, as expected for a conventional material at this loading condition. For the matrix surrounding the -ligament, plasticity is reduced in favour of localisation in the -ligament. However, for the gradient strengthened material, plasticity is not only less developed, in line with the gradient strengthening, but also smeared out across the unit cell, see Fig. 12(b). Localisation is to a little extent observed in the -ligament, but overall the entire cell experiences plasticity. This is indicative of a change in deformation mechanism along the lines of the one observed in Ref. [1] for a stress triaxiality of 1. However, here it is seen with an increasing length parameter. As increases, the cell is more likely to undergo simultaneous macroscopic localisation and void coalescence in contrast to a conventional material where the cell predominantly undergoes void coalescence for the same loading conditions.
The combined effect of the stress triaxiality (for a fixed Lode parameter) and the length parameter is visualised by the rows in Fig. 10, while the combined effect of the Lode parameter (for a fixed stress triaxiality) and length parameter is visualised by the columns in Fig. 10. Qualitatively, for a fixed stress triaxiality value, the length parameter has a nearly identical impact for all values of the Lode parameter; the critical stress increases with increasing length parameter. It is, however, interesting that the drop in coalescence stress the cubic unit cell () subject to diminishes with increasing length parameter for all values of stress triaxiality, Figs. 10(d)-(f). This is because increased gradient strengthening delays the intensification of the plastic flow and homogenizes the plastic strain field.
For the lowest stress triaxiality value, , the effect of the length parameter is small. Nonetheless, the plastic strain gradients that build up around the void give rise to the small increase in gradient strengthening. For the loading conditions giving , the onset of localisation is significantly delayed, thus allowing the material to withstand higher critical stress with a smaller dependence on the inter-void ligament size. The deformation mechanism prevailing at this low value of triaxiality, where macroscopic localisation and void coalescence occur simultaneously [1], implies that the gradients surrounding the void will not influence the critical equivalent stress to a great extent, as the deformation takes place in the entire unit cell.
For a higher value of stress triaxiality, , the effect of the length parameter is more prominent as seen in Fig. 10, and the smaller the inter-void ligament size, the greater the effect of the length parameter is. This is because, at higher stress triaxiality values, the plastic flow tends to localise in the inter-void ligaments as the ligaments diminish in size. The localisation induces large plastic strain gradients that in turn contribute to strengthening. The gradient induced strengthening in the inter-void ligament then inhibits further plastic flow localisation and delays void coalescence. Although not shown here, for and , the gradient strengthening is sufficiently large that increasing the value of from to , has a negligible effect. For the intermediate length parameter, , the effects of triaxiality and inter-void ligament size are still visible but greatly reduced due to the smaller degree of gradient strengthening. For the smallest value of the length parameter, , the critical equivalent stress values follow those of the conventional material, just at a higher relative level for all inter-void ligament size considered. For and , for , the same effect is seen. The most pronounced effect of the length parameter is seen for , and as this configuration has the lowest critical effective stress for the conventional material, but shows the same critical stress for as in the remaining results.
4 Summary and conclusions
The interaction of the inter-void ligament size and the gradient induced material size effect on void coalescence is investigated for a range of imposed stress states, here characterised by fixed values of the stress triaxiality and the Lode parameter. To this end, three dimensional finite element unit cell calculations for a single initially spherical void embedded in strain gradient enhanced material matrix are carried out. A conventional material matrix (absence of gradient induced strengthening effects) is considered as reference. Increasing the length parameter, and thereby the gradient effect, is equivalent to down-scaling the microstructure. All microstructures considered in this work contain voids that are below a critical flaw size [40]. Thus, plasticity theory will reign the material response as the voids are considered too small to be treated as cracks.
The results for the conventional material show that the critical coalescence stress increases when increasing the inter-void ligament size. The effect of the inter-void ligament size is, however, dependent on the imposed stress triaxiality, such that the effect of the inter-void ligament size increases with increasing stress triaxiality. However, above a certain threshold for the inter-void ligament size, the results show a slight decrease in the critical stress. This drop has to do with a transition from plastic flow localisation within the smallest inter-void ligament to plastic flow localization at to the main loading axis. The transition in the plastic flow localisation pattern is found to be particularly pronounced for a Lode parameter of . However, irrespective of the Lode parameter value, the transition occurs as the unit cells approach a cubic geometry.
For a void embedded in a strain gradient enhanced material matrix, the value of the critical coalescence stress increases with increasing length parameter i.e. increasing the gradient strengthening effect. The effect of the length parameter is found to intensify with increasing imposed stress triaxiality and decreasing inter-void ligament size. This is due to a propensity for plastic flow localisation in the inter-void ligament when the ligament is small and the stress triaxiality high. Plastic flow localisation introduces large plastic strain gradients which in turn strengthens the ligament and delays further localisation of plastic flow. The strengthening from plastic strain gradients also leads to a weakened dependency in the critical coalescence stress on the inter-void ligament size. Finally, the results show that there exists a natural upper bound where the gradient strengthening is so severe that the entire matrix material yields. For very large values of the length parameter, the effect of the imposed stress state and the inter-void ligament size vanish, and the critical equivalent stress is identical for all combinations of the unit cell geometry and the loading conditions considered.
This research was financially supported by the Danish Council for Independent Research through the research project “Advanced Damage Models with InTrinsic Size Effects” (Grant no: DFF-7017-00121). The computing resources provided by the high performance research computing center at Texas A&M University are gratefully acknowledged.
References
- [1] Tekoğlu, C., Hutchinson, J., and Pardoen, T., 2015. “On localization and void coalescence as a precursor to ductile fracture”. Philosophical Transactions of the Royal Society A: Mathematical, Physical and Engineering Sciences, 373(2038), p. 20140121.
- [2] Guo, T., and Wong, W., 2018. “Void-sheet analysis on macroscopic strain localization and void coalescence”. Journal of the Mechanics and Physics of Solids, 118, pp. 172–203.
- [3] Liu, Y., Zheng, X., Osovski, S., and Srivastava, A., 2019. “On the micromechanism of inclusion driven ductile fracture and its implications on fracture toughness”. Journal of the Mechanics and Physics of Solids, 130, pp. 21–34.
- [4] Pardoen, T., and Hutchinson, J., 2000. “An extended model for void growth and coalescence”. Journal of the Mechanics and Physics of Solids, 48(12), pp. 2467–2512.
- [5] Srivastava, A., and Needleman, A., 2013. “Void growth versus void collapse in a creeping single crystal”. Journal of the Mechanics and Physics of Solids, 61(5), pp. 1169–1184.
- [6] Torki, M., Benzerga, A., and Leblond, J.-B., 2015. “On void coalescence under combined tension and shear”. Journal of Applied Mechanics, 82(7).
- [7] Torki, M., Tekoglu, C., Leblond, J.-B., and Benzerga, A., 2017. “Theoretical and numerical analysis of void coalescence in porous ductile solids under arbitrary loadings”. International Journal of Plasticity, 91, pp. 160–181.
- [8] Budiansky, B., Hutchinson, J., and Slutsky, S., 1982. “Void growth and collapse in viscous solids”. In Mechanics of solids. Elsevier, pp. 13–45.
- [9] Koplik, J., and Needleman, A., 1988. “Void growth and coalescence in porous plastic solids”. International Journal of Solids and Structures, 24(8), pp. 835–853.
- [10] Needleman, A., Tvergaard, V., and Hutchinson, J., 1992. “Void growth in plastic solids”. In Topics in fracture and fatigue. Springer, pp. 145–178.
- [11] Benzerga, A. A., and Leblond, J.-B., 2010. “Ductile fracture by void growth to coalescence”. In Advances in applied mechanics, Vol. 44. Elsevier, pp. 169–305.
- [12] Stelmashenko, N., Walls, M., Brown, L., and Milman, Y., 1993. “Microindentations on W and Mo oriented single crystals: an STM study”. Acta Metallurgica et Materialia, 41(10), pp. 2855–2865.
- [13] Ma, Q., and Clarke, D., 1995. “Size dependent hardness of silver single crystals”. Journal of Materials Research, 10(4), pp. 853–863.
- [14] Fleck, N., Muller, G., Ashby, M., and Hutchinson, J., 1994. “Strain gradient plasticity: theory and experiment”. Acta Metallurgica et Materialia, 42(2), pp. 475–487.
- [15] Stölken, J., and Evans, A., 1998. “A microbend test method for measuring the plasticity length scale”. Acta Materialia, 46(14), pp. 5109–5115.
- [16] Tvergaard, V., and Niordson, C., 2007. “Size-effects in porous metals”. Modelling and Simulation in Materials Science and Engineering, 15, pp. 51–60.
- [17] Niordson, C., 2008. “Void growth to coalescence in a non-local material”. European Journal of Mechanics A - Solids, 27, pp. 222–233.
- [18] Tvergaard, V., and Niordson, C., 2004. “Nonlocal plasticity effects on interaction of different size voids”. International Journal of Plasticity, 20(1), pp. 107–120.
- [19] Li, Z., and Steinmann, P., 2006. “Rve-based studies on the coupled effects of void size and void shape on yield behavior and void growth at micron scales”. International Journal of Plasticity, 22(7), pp. 1195–1216.
- [20] Monchiet, V., and Bonnet, G., 2013. “A gurson-type model accounting for void size effects”. International Journal of Solids and Structures, 50(2), pp. 320–327.
- [21] Nielsen, K., 2017. “Size effects in void coalscence”. In: Contributions to the Foundations of Multidisciplinary Research in Mechanics(The 24th International Congress of Theoretical and Applied Mechanics; August 22-26, 2016; Montreal, Canada).
- [22] Holte, I., Niordson, C. F., Nielsen, K. L., and Tvergaard, V., 2019. “Investigation of a gradient enriched gurson-tvergaard model for porous strain hardening materials”. International Journal of Mechanics A-solids, 75, pp. 472–484.
- [23] Gudmundson, P., 2004. “A unified treatment of strain gradient plasticity”. Journal of the Mechanics and Physics of Solids, 52(6), pp. 1379–1406.
- [24] Fleck, N., and Willis, J., 2009. “A mathematical basis for strain-gradient plasticity theory: Part II: tensorial plastic multiplier”. Journal of the Mechanics and Physics of Solids, 57(7), pp. 1045–1057.
- [25] Martínez-Pañeda, E.and Deshpande, V., Niordson, C., and Fleck, N., 2019. “The role of plastic strain gradients in the crack growth resistance of metals”. Journal of the Mechanics and Physics of Solids, 126, pp. 136–150.
- [26] Zhang, K., Bai, J., and Francois, D., 2001. “Numerical analysis of the influence of the lode parameter on void growth”. International Journal of Solids and Structures, 38(32-33), pp. 5847–5856.
- [27] Kim, J., Gao, X., and Srivatsan, T., 2004. “Modeling of void growth in ductile solids: effects of stress triaxiality and initial porosity”. Engineering fracture mechanics, 71(3), pp. 379–400.
- [28] Gao, X., and Kim, J., 2006. “Modeling of ductile fracture: significance of void coalescence”. International Journal of Solids and Structures, 43(20), pp. 6277–6293.
- [29] Barsoum, I., and Faleskog, J., 2007. “Rupture mechanisms in combined tension and shear—micromechanics”. International Journal of Solids and Structures, 44(17), pp. 5481–5498.
- [30] Bao, Y., and Wierzbicki, T., 2004. “On fracture locus in the equivalent strain and stress triaxiality space”. International Journal of Mechanical Sciences, 46(1), pp. 81–98.
- [31] Barsoum, I., and Faleskog, J., 2007. “Rupture mechanisms in combined tension and shear—experiments”. International journal of solids and structures, 44(6), pp. 1768–1786.
- [32] Srivastava, A., Gopagoni, S., Needleman, A., Seetharaman, V., Staroselsky, A., and Banerjee, R., 2012. “Effect of specimen thickness on the creep response of a ni-based single-crystal superalloy”. Acta Materialia, 60(16), pp. 5697–5711.
- [33] Srivastava, A., and Needleman, A., 2015. “Effect of crystal orientation on porosity evolution in a creeping single crystal”. Mechanics of Materials, 90, pp. 10–29.
- [34] Tekoglu, C., 2014. “Representative volume element calculations under constant stress triaxiality, lode parameter, and shear ratio”. International Journal of Solids and Structures, 51(25-26), pp. 4544–4553.
- [35] Liu, Z., Wong, W., and Guo, T., 2016. “Void behaviors from low to high triaxialities: Transition from void collapse to void coalescence”. International Journal of Plasticity, 84, pp. 183–202.
- [36] Fuentes-Alonso, S., and Martínez-Pañeda, E., 2020. “Fracture in distortion gradient plasticity”. International Journal of Engineering Science, 156, p. 103369.
- [37] Martínez-Pañeda, E., Niordson, C. F., and Bardella, L., 2016. “A finite element framework for distortion gradient plasticity with applications to bending of thin foils”. International Journal of Solids and Structures, 96, pp. 288–299.
- [38] Voyiadjis, G. Z., and Faghihi, D., 2012. “Thermo-mechanical strain gradient plasticity with energetic and dissipative length scales”. International Journal of Plasticity, 30, pp. 218–247.
- [39] Tekoglu, C., Leblond, J.-B., and Pardoen, T., 2012. “A criterion for the onset of void coalescence under combined tension and shear”. Journal of the Mechanics and Physics of Solids, 60(7), pp. 1363–1381.
- [40] Martínez-Pañeda, E., Deshpande, V. S., Niordson, C. F., and Fleck, N. A., 2019. “The role of plastic strain gradients in the crack growth resistance of metals”. Journal of the Mechanics and Physics of Solids, 126, pp. 136–150.