The Rapid Build-up of Massive Early-type Galaxies.
Supersolar Metallicity, High Velocity Dispersion and Young Age for an ETG at z=3.35.
Abstract
How massive early-type galaxies assembled their mass, on which timescales the star formation quenched, when their supersolar metallicity has been established, are still open and debated issues. Thanks to very deep spectroscopic observations carried out at the Large Binocular Telescope, we measured simultaneously stellar age, metallicity and velocity dispersion for C1-23152, an ETG at redshift =3.352, corresponding to an epoch when the Universe was 1.8 Gyr old. The analysis of its spectrum shows that this galaxy, hosting an AGN, formed and assembled 21011 M⊙ shaping its morphology within the 600 Myr preceding the observations, since 4.6. The stellar population has a mean mass-weighted age of 400 Myr and it is formed between 600 Myr and 150 Myr before the observed epoch, this latter being the time since quenching. Its high stellar velocity dispersion, =40960 km s-1, confirms the high mass (Mdyn=1011 M⊙) and the high mass density (= M⊙ kpc-2), suggesting a fast dissipative process at its origin. The analysis points toward a supersolar metallicity, [Z/H]=0.25, in agreement with the above picture, suggesting a star formation efficiency much higher than the replenishment time. However, sub-solar metallicity values cannot be firmly ruled out by our analysis. Quenching must have been extremely efficient to reduce the star formation to SFR6.5 M⊙ yr-1 in less than 150 Myr. This could be explained by the presence of the AGN, even if a causal relation cannot be established from the data. C1-23152 has the same stellar and physical properties of the densest ETGs in the local Universe of comparable mass, suggesting that they are C1-23152-like galaxies which evolved to unperturbed.
Keywords:
Galaxy formation (595), Galaxy evolution (594), High-redshift galaxies (734), Elliptical galaxies (456), Galaxy stellar content (621)I Introduction
In the classical paradigm of hierarchical galaxy formation, high-mass early-type galaxies (ETGs) grow their stellar mass mainly ex-situ through subsequent mergers of smaller pre-existing galaxies over timescales comparable to the Hubble time (De Lucia et al. 2006, e.g.,). In seeming contrast, studies of local ETGs show that they follow tight scaling relations between stellar population properties (age and metallicity) and physical properties (stellar velocity dispersion, mass and size), whose tightness is not consistent with a predominant merging process (Nipoti et al. 2012) but requires a short star formation event (Renzini 2006, e.g.,). These studies also suggest that the larger the mass of a galaxy the higher the redshift at which most of its stars formed and the shorter the duration of star formation (Thomas et al. 2010). Some simulations suggest that an early intense burst of star formation followed by a rapid quenching is required to reproduce the structural properties of ETGs and to match the tight scaling relations (Ciotti et al. 2007; Naab et al. 2007; Oser et al. 2012; Brooks & Christensen 2016, e.g.)
Local studies also show that the larger the mass of a galaxy, the higher the stellar metallicity and the older the stars (Gallazzi et al. 2006, e.g.,). This is rather counter intuitive since older stellar populations are expected with lower metallicity than younger ones. However, these properties result from the integrated effect of galaxy evolution across the whole Hubble time, making it difficult to disentangle evolutionary from formation processes. Since stellar metallicity is most sensitive to the efficiency of gas replenishment during star formation and to the quenching mechanism (Peng et al. 2015; Maiolino & Mannucci 2019, e.g.), the measurement of stellar metallicity in massive ETGs at high redshift would provide important information on these two fundamental processes of galaxy formation.
In the last decade, deep and wide photometric surveys have discovered massive (M∗1011 M⊙) quiescent galaxies at z2-3, i.e. formed during the first 2-3 Gyr of cosmic time (Marchesini et al. 2010; Cassata et al. 2013; Straatman et al. 2014, e.g.). Spectroscopic observations have confirmed the high redshift nature for some of them, establishing the presence of passive galaxies at 23 with ages comparable to the age of the Universe at that redshift (Cimatti et al. 2008; Kriek et al. 2009; Gobat et al. 2012; van de Sande et al. 2013; Belli et al. 2014; Belli et al. 2017, e.g.,)
More recently, spectroscopic observations have confirmed the presence of massive passive galaxies at 3 (Marsan et al. 2015; Glazebrook et al. 2017; Schreiber et al. 2018; Tanaka et al. 2019; Tanaka et al. 2020; Forrest et al. 2020a; Forrest et al. 2020b; Valentino et al. 2020; D’Eugenio et al. 2020). The importance of pushing in the search for passive massive galaxies to higher redshift is due to the constraints on models of galaxy formation coming from the short cosmic time at the disposal of galaxies to assemble their stellar mass. Indeed, the latest generation of galaxy formation models, e.g. Illustris (Wellons et al. 2015) and TNG300 (Springel et al. 2018), has difficulty in reproducing these galaxies since, at , there is little time (2 Gyr) for smaller progenitors to build-up their stellar mass, halt star formation and completely merge (Forrest et al. 2020a).
For some of these massive passive galaxies, the age of their stellar populations has been constrained through a parametric fitting of their spectra and broad-band photometry, showing a large range in their ages (Glazebrook et al. 2017; Schreiber et al. 2018; Tanaka et al. 2019; Forrest et al. 2020a; Forrest et al. 2020b; Valentino et al. 2020). So far, it has been possible to measure the stellar velocity dispersion for only one of these objects, dynamically confirming the high-mass of the system (Tanaka et al. 2019).
While these massive passive galaxies at high redshift seem to have already completed their assembly, nothing is known about their stellar metallicity. The unknown stellar metallicity does not allow for constraining either the timescale of the star formation or the possible quenching mechanisms, both affecting stellar metallicity differently (Peng et al. 2015, e.g.). Additionally, the uncertainty in measured stellar ages for some of them does not allow for precise estimates of their assembly time and the duration of the quenching process. How ETGs have accreted their stellar mass, whether in-situ through a main star formation event in 1 Gyr (Thomas et al. 2010, e.g.,), or rather ex-situ through mergers in 2-3 Gyr (Boylan-Kolchin et al. 2008, e.g.,), or even through both processes at different times in a two-phase formation scenario (Oser et al. 2010; Hill et al. 2017; Newman et al. 2018), are still open and debated issues.
We have simultaneously measured stellar age, metallicity and velocity dispersion for C1-23152, a galaxy at (Marsan et al. 2015), when the Universe was less than 2 Gyr old, with very deep (17 hours of integration) spectroscopic observations carried out at the Large Binocular Telescope (LBT). In this paper we present the analysis and results. The paper is organized as follows. In § 2 we summarize the properties of C1-23152 and describe the comparison data for ETGs at redshift 0. In § 3 we describe the observations and the data reduction. In § 4 we present the spectrum and analyse its properties. In § 5 we derive the stellar age and metallicity, and constrain the star formation history; we derive the stellar mass and we measure stellar velocity dispersion. In § 6 we discuss the results and present our conclusions.
Throughtout, we use the cosmological parameters H0=70 km s-1 Mpc-1, =0.7 and =0.3. Magnitudes are given in the AB photometric system. All the radii presented in the paper are circularized. A Chabrier 2003 initial mass function (IMF) is assumed throughout this paper.
II Data and Models
II.1 Galaxy C1-23152 at
Galaxy C1-23152 (R.A. = 10h00m27s.81, decl. = +02d33m 49s.3; J2000) was first presented in Marchesini et al. 2010 in a photometric study of a stellar-mass complete sample of galaxies at 3z4 using the NEWFIRM Medium-Band Survey. C1-23152 was then spectroscopically confirmed by Marsan et al. 2015 to be at =3.352 using a combination of Keck-NIRSPEC, VLT-Xshooter, and GTC-Osiris spectra. The SED modeling on the combined spectra and broad-/medium-band photometry resulted in an ongoing star formation rate 7 Msun/yr, and negligible dust extinction (Marsan et al. 2015). From the analysis of the emission lines and the infrared SED, C1-23152 was found to harbor a powerful type-2 quasar (QSO), with bolometric luminosity of 1046 erg s-1, only mildly contaminating the stellar emission, with a lower limit to the stellar mass of 1.91011 M⊙ (as taken from Marsan et al. 2015 after scaling to Chabrier IMF). Structural properties were derived from the analysis of HST ACS F814W and WFC F160W images, resulting in an effective radius R1 kpc and a Sersic index n4.4 in F160W (Marsan et al. 2015).
II.2 Local comparison samples
As comparison samples of local ETGs the following data have been considered: a sample of ETGs selected from SPIDER (La Barbera et al. 2010) with 150 km s-1 to represent the whole population irrespective of their mass and size; the sample of ETGs with 350 km s-1 studied by Bernardi et al. 2006 representing the most massive ETGs in the local Universe; the sample of compact ETGs with high velocity dispersion studied by Saulder et al. 2015, representing ETGs with high mass density and extreme structural and dynamical properties; the sample of compact galaxies identified by Damjanov et al. 2015, representing the population of small, compact and dense galaxies missed by the current ground-based surveys.
II.3 Stellar population models
In this analysis, we adopted the EMILES simple stellar population (SSP) models (Vazdekis et al. 2015), based on BaSTI isochrones (Pietrinferni et al. 2004) and Galaxy abundance ratios ([Fe/H]=[Z/H]) as a reference library, assuming a Chabrier 2003 stellar initial mass function (IMF), with ages spanning [0.06; 2.0] Gyr, and 11 metallicity [Z/H] in the range [-2.32; 0.26] (a total of 162 SSPs). Notice that models with [Z/H]=0.4, although available, were not used in the analysis as they have lower quality than the other models (see Vazdekis et al. 2015, for details). We also considered a set of MILES -enhanced models (Vazdekis et al. 2015) for which [/Fe]=0.4, spanning the same ranges of ages and metallicity of the reference set. In the optical spectral range, these models have a FWHM spectral resolution of 2.5 Å (Beifiori et al. 2011), higher than the rest-frame resolution (3 Å) of the LBT-LUCI spectrum of C1-23152.
The dependence of the stellar population properties on the adopted models was tested by considering also BC03 SSPs (Bruzual & Charlot 2003) with a Chabrier IMF, 20 ages in the range [0.06; 2.0] Gyr and 5 metallicities in the range [-1.7; 0.4], and Maraston & Strömbäck 2011 MILES-based models (M11) with Chabrier IMF, including 20 ages in the range [0.06; 2.0] Gyr and 5 metallicities in the range [-2.3; 0.3] (see § V).
III Spectroscopic observations and data reduction
Long slit spectroscopy of galaxy C1-23152 was obtained at the Large Binocular Telescope (LBT) with the two LBT Utility Cameras in the Infrared (Ageorges et al. 2010, LUCI1 and LUCI2;) in twin (binocular) configuration, for a total effective integration time of 17.3 hours. Observations were carried out on January 2018 and January 2019, with a seeing FWHM=0.8-1.0 arcsec (in the visual), with filter HK coupled with the grism G200 sampling the wavelength range 15000-23500 Å covering the rest-frame range 3450 Å5300 Å at the redshift of the galaxy, at 4.35 Å/pix. We adopted a slit width of 0.75 arcsec resulting in a spectral resolution R1267(1650) in H(K) (13 Å for both the bands). Observations consisted of a sequence of exposures of 300 s each taken at dithered (ABBA) positions offset by 5 arcsec, summing up to 203 images. A bright pivot star (U0900.06569623; RA=0:00:32.39, Dec=+02:34:07.08; KVega=13.14 mag, spectral type M) 71 arcsec away from the target galaxy was included in the slit to ensure accurate slit centering and alignment of dithered sequences, as well as to check the flux calibration and the correction for telluric absorption lines in the data reduction phase.
The 2D spectra were processed at the Italian LBT Spectroscopic Reduction Center with a reduction pipeline optimized for LBT data (Scodeggio et al. 2005; Magrini et al. 2012). For each one of the two observing runs (January 2018 and January 2019), calibration frames were created both for LUCI1 and LUCI2. A bad pixel map was generated from flats and darks, while a “master” dark and a “master” flat were created averaging a set of darks and spectroscopic flats, respectively. Each spectral image was independently corrected for cosmic rays and bad pixels, and then dark and flat-field corrections were applied.
For the wavelength calibration, an inverse solution of the dispersion was created for each observing day, and for each spectrograph. The mean accuracy reached at the center of the H and K bands is 0.5 Å (rms). For each frame, the slit was extracted and wavelength calibrated, removing any curvature due to the optical distortions.
Subtraction of emission from sky was performed following the method developed by Davies 2007 on the 2D-extracted and wavelength-calibrated spectra. Further sky residuals along the spatial direction were removed by fitting and subtracting the signal for each column of the spectrum.
Particular attention was paid to the relative flux calibration since it can affect the shape of the spectrum. For each observing day, a sensitivity function, as well as telluric absorption correction, was obtained for LUCI1 and LUCI2 using a telluric star observed close in time and air-mass to the scientific target. The wavelength/flux-calibrated and sky-subtracted spectra obtained in the different nights were finally stacked together. Offsets between different frames were estimated using the pivot stars in the science exposures.
In Fig. 1, the final LBT-LUCI 1D spectrum of the pivot star U0900.06569623 (gray curve) is compared with the spectrum of the main sequence M1 spectroscopic standard star HD42581 (green curve)11 1 The spectrum has been taken from the NASA Infrared Telescope Facility (IRTF) spectral library http://irtfweb.ifa.hawaii.edu/ spex/IRTF_Spectral_Library/. The reliability of the continuum shape is a fundamental issue in the analysis of a galaxy spectrum since its shape depends on the age and metallicity of the underlying stellar population, and on the dust extinction. This comparison shows a very good agreement, demonstrating the excellent recovery of the true shape of the continuum and, therefore, the excellent quality of the relative flux calibration for C1-23152 spectrum.

In order to extract the 1D spectrum of the galaxy, we first removed the residual background component due to the bright star observed in the scientific exposures. This component was accurately removed by running the IRAF task background on the two-dimensional stacked spectrum. The center of the 2D galaxy spectrum was accurately modeled by fitting the profile along the spatial direction with a double Gaussian function, in wavelength bins, excluding pixels contaminated by sky residuals/telluric absorption, in each bin. The one-dimensional (1D) spectrum of the galaxy was extracted within a region of 3 pixels (0.75 arcsec) around the photometric center of the galaxy. We adopted an extraction radius of 3 pixels, as this turned out to maximize the S/N ratio of the extracted spectrum.
IV The spectrum of C1-23152
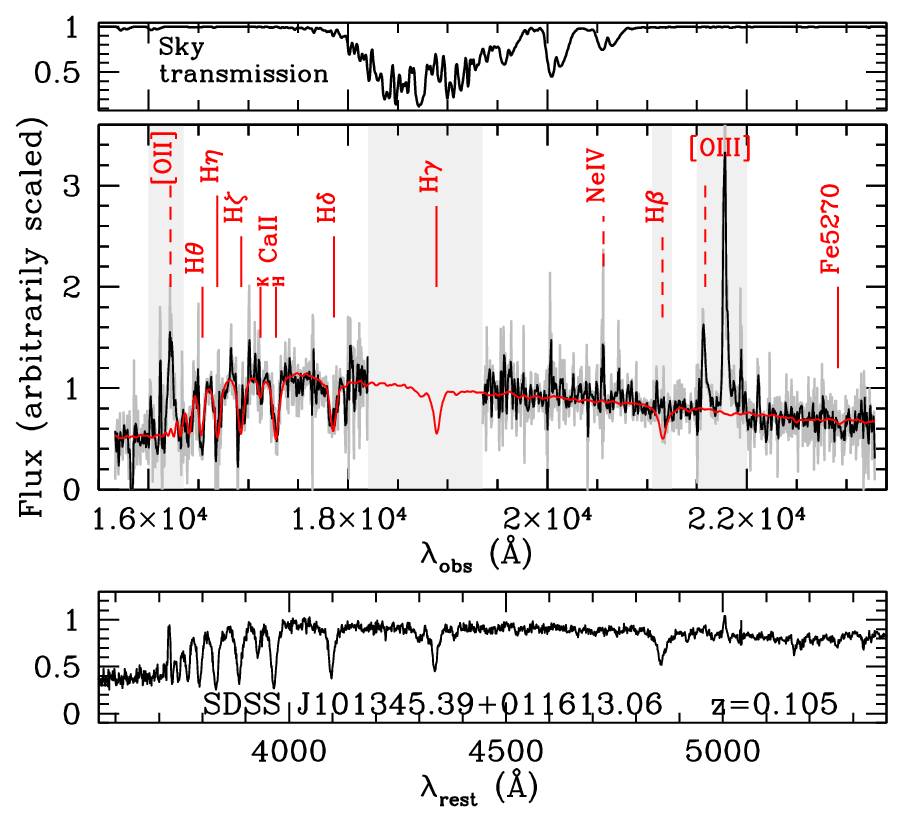
The 1D LBT-LUCI spectrum of C1-23152 is shown in Figure 2, middle panel. The upper panel shows the atmospheric transmission in the wavelength range of observations. The bottom panel shows, for comparison, the spectrum of a post-starburst galaxy in the local Universe selected from the Sloan Digital Sky Survey (SDSS). The spectrum of C1-23152 has a S/N Å-1 around 4000 Å and it is characterized by prominent emission lines and absorption features.
IV.1 Emission lines: Active Galactic Nucleus and star formation
The spectrum shows strong [OII](3727) and [OIII](4958;5007) doublet emission lines and weak H emission. The measured fluxes associated with these lines are FOII=4.0(0.5)10-17 erg cm-2 s-1, FOIII=1.30.3)10-16 erg cm-2 s-1 and FHβ=4.3(2)10-18 erg cm-2 s-1, respectively22 2 Fluxes were estimated by fitting a gaussian function to the line after having removed the underlying continuum evaluated through a polynomial fitting of the regions adjacent to the line.. The high luminosity of [OIII](5007) line, LOIII=1.3(0.3)1043 erg s-1 derived from the measured flux, cannot be produced by star formation and suggests the presence of an Active Galactic Nucleus (Francis et al. 1991, AGN;). This is also confirmed by the high value of the ratios [OIII]/H30 and [OIII]/[OII], with both of them in the AGN regime (Baldwin et al. 1981) and by the detailed study of the infrared Spectral Energy Distribution (SED) presented by Marsan et al. 2015.
The presence of an AGN makes it difficult to estimate the possible ongoing star formation from the detected emission lines.33 3 Using the [OII] emission, considering the relation [OII]/[OIII]=0.21 (Silverman et al. 2009), we obtained an average AGN contribution L=2.71042 erg s-1. Therefore, the contribution of the SF to [OII] emission is L=1.31042 erg s-1 that, using the relation (scaled to Chabrier IMF) SFR=8.210-42LOII (Kennicutt 1998b), provides SFR10 M⊙ yr-1. To circumvent this problem, we derived an upper limit to the current residual star formation rate (SFR) assuming that all the H emission is due to star formation. To this end, we corrected the measured flux for the expected H absorption (Fabs=6.710-19 erg cm-2 s-1) according to the best-fitting composite model (see § V.1), assuming no dust extinction. We obtained FHβ,corr=5.0(2.0)10-18 erg cm-2 s-1. Using the relation LHα=2.86LHβ for case-B recombination (Moustakas et al. 2005), we obtained LHα=1.41042 erg s-1. The corresponding upper limit to the star formation rate is SFR6.6(3.0) M⊙ yr-1, where we used the relation (scaled to Chabrier IMF) SFR=4.6510-42LHα (Kennicutt 1998b). This upper limit agrees well with the one derived from the fitting to the whole SED by Marsan et al. 2015 (see above).
IV.2 Absorption lines: age sensitive features

The spectrum clearly shows the hydrogen Balmer absorption lines H, H, H, H along with CaII[H&K], extremely weak Mgb and Fe(5270). Table 1 summarizes the measured spectral indices (first row) and their errors at 1 (second row).
| CN3883a | Hb | Hb | Hb | Hb | CaII[HK]c | D4000d | Dne | Hf | Hf | Mgbf | Fe5270f |
|---|---|---|---|---|---|---|---|---|---|---|---|
| -0.07 | 5.8 | 7.8 | 9.9 | 8.4 | 7.0 | 1.40 | 1.09 | 7.7 | 5.5 | 0.5 | 5.6 |
| (0.04) | (1.0) | (1.3) | (1.1) | (0.9) | (1.6) | (0.05) | (0.06) | (0.8) | (0.9) | (0.8) | (2.3) |
Note. — Indices are corrected for galaxy velocity dispersion. The correction was derived by comparing the indices measured on the best-fitting model smoothed to the of the galaxy, and those of the same model at the nominal resolution of the spectral library. aAs defined in Davidge & Clark 1994; bdefined ad-hoc in this work to avoid as much as possible sky residuals in the pseudo-continuum regions; cas defined by Serven et al. 2005; das defined by Bruzual 1983; eas defined by Balogh et al. 1999; fas defined by Worthey & Ottaviani 1997 and Trager et al. 1998. Note that the coincidence with a strong sky emission line makes the measured strength of Fe5270 rather unreliable. For this reason, this feature was not considered in the absorption line fitting.
The Balmer lines are typical of the post-starburst phase since they are associated with hot, high-mass (1.5-2 M⊙) rapidly evolving stars whose main sequence lifetimes are less than 800 million years (Myr) (Poggianti & Barbaro 1997, e.g.). Their strengths are related to the elapsed time since the end of the last burst of star formation, i.e. the time since quenching. Figure 3 (left panel) shows the expected H index for a simple stellar population (SSP, EMILES models) seen at different ages for three different values of stellar metallicity (colored curves). The figure shows that the strength measured for galaxy C1-23152, H Å (black solid line), defines two possible quenching epochs, at 200 Myr and at 600-800 Myr, for solar or supersolar metallicity.
The right panel of Fig. 3 shows, instead, the expected amplitude of the D4000 index (Bruzual 1983). This discontinuity is produced by the opacity of the stellar atmospheres that, in turn, depends on the ionized metals hence, on the stellar temperature. Hot stars, responsible for H, do not contribute to the amplitude of D4000 since their elements are multiply ionized and their opacity is low. Therefore, D4000 index, contrary to H, is dominated by low mass stars and, hence, its amplitude is strictly related to the age of the bulk of the stellar population. The measured D4000=1.400.05 (black solid line, right panel of Figure 3) suggests a mean age for the stellar population in the range 250-450 Myr. This mean age rules out the solution for quenching to be 600-800 Myr before observations (which would require D40001.6, black dashed line, 3 in excess of the measured value), and constrains the bulk of the star formation to occur within the past 700 Myr. Combined with the H measurement, the time since quenching is restricted to 200 Myr. We verify these conclusions following a more careful and detailed analysis in § V.
IV.3 Absorption lines: metallicity sensitive features


Three main metal lines fall in the LUCI spectrum of C1-23152: CN3883, Mgb(5175) and Fe(5270), all of them having low S/N (see Tab. 1). The coincidence of Fe(5270) feature with a strong sky emission line makes the measured strength of this feature rather uncertain.
Figure 4 shows the line-strength of Mgb(5175) (left) and Fe(5270) (right) for EMILES SSPs with three different metallicities (see colored curves) as a function of age. The horizontal black lines are the line-strengths as measured for C1-23152. These indices are widely used to derive stellar metallicity and abundances. Models show that the two features are extremely weak and, as expected, weakly dependent on metallicity at young ages (500 Myr). Namely, for metallicity in the range [0.45-1.4]Z⊙, the maximum variation of Mgb is less than 10% for ages younger than 500 Myr and 30% at 700 Myr. A similar behavior is seen for Fe(5270), with the difference that for ages older than 500 Myr the maximum variation is nearly constant, by about 25%. The weak sensitivity of these indices to variations in metallicity at young ages is model independent, as we verified considering BC03 (Bruzual & Charlot 2003) and Maraston & Strömbäck 2011 (M11) models. Therefore, given the young mean age of the stellar population these indices are not expected to provide significant constraints on stellar metallicity.
Figure 5 shows the spectra of three SSPs of different metallicity at fixed age, 400 Myr, in the wavelength range 3500-5200 Å. These models show that, absorption features at shorter wavelengths and the continuum shape around D4000 are more dependent on metallicity, contrary to the features at longer wavelengths. Therefore, at young ages, Balmer lines, D4000, and continuum shape can constrain stellar metallicity more than metal lines. We will take advantage of this in the next section, being certain of the reliability of the continuum shape of our spectra (see § 3 and Fig. 1).
V Analysis
In this section we describe the analysis performed to estimate the stellar age, metallicity and velocity dispersion of C1-23152. The aim is to constrain the formation timescale of this ETG, i.e. the time needed to fully assemble and shape this galaxy as seen at z=3.35, and the mechanism of mass growth, i.e. whether the stellar mass of this galaxy was assembled in-situ through star formation or ex-situ through accretion.
V.1 Age and metallicity estimates
Stellar age and metallicity were derived through two different methods: absorption lines fitting (ALF) and full spectral fitting (FSF).
ALF
We performed absorption line fitting (La Barbera et al. 2013; Saracco et al. 2019) by comparing the measured line-strengths with those predicted by SSP models of varying age and metallicity. The fitting was performed by minimizing the expression
| (1) |
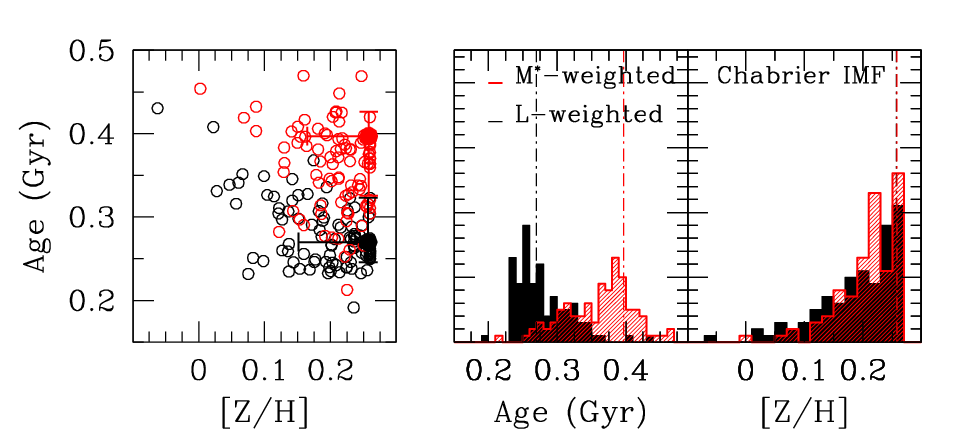
where the index runs over the selected set of spectral indices in the rest-frame range 3500-5200 Å. The main spectral indices considered in the fitting, with the exception of Fe5270, are summarized in Table 1. and are observed and model index values, where the latters depend on age and [Z/H], while the ’s are the uncertainties on the observed indices. Some mild extrapolation of indices, to up [Z/H]=0.3, has been performed following the same approach as in La Barbera et al. 2013. The resulting best-fitting light-weighted SSP equivalent age and metallicity values are ageL=0.24 Gyr and [Z/H]L=0.27, respectively. The quoted errors were obtained by running the fitting procedure on a set of 100 simulated spectra (see Appendix B).
In Figure 6 the Balmer line indices measured on the spectrum of C1-23152 are compared to those expected from models at different ages and metallicity values. H, H, H and H all favour high metallicity values, consistent with D4000. H has a very large error bar, while H and H tend to favour sub-solar metallicity. The net effect is that high-metallicity values are favored from the fitting of line-strengths, consistent with results from STARLIGHT (see below). Also, one should bear in mind that H and H may be affected by some emission contamination, as expected from the residual star formation (in particular H), reinforcing the conclusion above. The horizontal gray arrow in the H panel of Figure 6 shows the value of the index corrected by 15%. This is the median correction for emission filling to H absorption derived empirically by Goto et al. 2003 from a sample of 3300 local post-starburst galaxies.44 4 Other empirical methods, as the one based on the D4000, EW(H)=-5.5D4000+11.5, provide larger corrections (Miller & Owen 2002, 30%-40%, e.g.,) It is reasonable to expect for H a correction not larger than the one for H.

| AgeL | [Z/H]L | AgeM∗ | [Z/H]M∗ | AV | IMF | Method |
|---|---|---|---|---|---|---|
| (Gyr) | (Gyr) | (mag) | ||||
| 0.24 | 0.27 | … | … | … | Cha | ALF |
| 0.27 | 0.25 | 0.40 | 0.25 | 0.05 | Cha | FSF |
| 0.28 | [0.0]a | 0.41 | [0.0]a | 0.09 | Cha | FLFa |
| 0.27 | 0.25 | 0.42 | 0.25 | 0.05 | Sal | FSF |
| 0.23 | 0.12 | 0.30 | 0.13 | 0.19 | Cha | FSF+-enhanced |
Note. — aThis fitting has been obtained at fixed solar metallicity. Errors are assumed as those obtained with free metallicity.
FSF
In the full spectral fitting approach, stellar population models are matched to the observed spectrum in wavelength (rather than spectral index) space. To perform FSF, we have adopted the software STARLIGHT (Cid Fernandes et al. 2007; Mateus et al. 2007), that fits a linear combination of SSP models (the “base”), with different ages and metallicities, to derive the best-fitting composite model to the observed spectrum. The main advantage of this approach is that it is non-parametric, i.e. no a-priori assumption on the functional form of the galaxy star formation history (SFH) is done. In this way, one can detect, in principle, multiple stellar components if present, and constrain their metallicity. On the contrary, assuming a given functional form for the SFH, would necessarily imply a trade off between age, duration of star-formation, and metallicity. Of course, any non-parametric approach requires the robustness of the detected stellar population components to be assessed (i.e. whether they are real, or just result from some fluctuations in the observed spectrum), as we extensively test here using Monte-Carlo simulations.
STARLIGHT derives the best-fitting linear combination of SSPs using a Markov Chain Monte Carlo (MCMC) algorithm. The model spectrum is the superposition of SSPs, with age Agei and metallicity Zi, each one contributing with a different fraction () to the light and a different fraction () of stellar mass, taken from a pre-defined set of base spectra (162 EMILES SSPs in our case). There is no restriction to the number of spectral component (SSPs) that enters in the composite model. Light-weighted () and mass-weighted () age AgeL,M and metallicity [Z/H]L,M can be defined according to the relations (Asari et al. 2007, e.g.,)
| (2) |
and
| (3) |
Internal reddening in the range 0-2 mag was allowed in the fitting by considering both the Cardelli (CCM) (Cardelli et al. 1989) and the Calzetti (HZ5) (Calzetti et al. 2000) extinction laws, with no difference in the results. The spectral regions affected by bad sky transmission and by the presence of emission lines were masked in the fitting. The best fitting composite model, sum of 5 SSPs (see § 5.2 for details), is shown in Figure 2 as red curve. The corresponding mean mass-weighted stellar age (eq. 2) is AgeM=400 Myr (similar to that derived in § IV.2), and metallicity (eq. 3) is [Z/H]M=0.25 (second row of Tab. 2)55 5 To quantify the maximum possible influence of the AGN on age and metallicity estimation, we subtracted the composite quasar spectrum by Francis et al. 1991 to the spectrum of C1-23152 and we run Starlight. The QSO specrum was normalized to the rest-frame UV flux of the galaxy at 1400 Å (filters IA624, IA679) assuming that all the observed flux was due to QSO. We obtained AgeM=32050 Myr and [Z/H]=0.200.06, respectively., while the luminosity-weighted age and metallicity are AgeL=270 Myr and [Z/H]L=0.25, respectively. Notice the excellent agreement between the light-weighted age and metallicity values obtained with two independent methods, ALF and FSF. Errors (68% confidence level) and stability of best fitting results were assessed by running STARLIGHT on a set of simulated spectra (see Appendix B).
We checked the minimum solution found by STARLIGHT by repeating the fitting with penalized PiXel-Fitting method, pPXF (Cappellari & Emsellem 2004; Cappellari 2017), that allows for regularization (see Cappellari 2017, for a comprehensive discussion of regularization in full spectral fitting). The resulting best-fitting light-weighted age and metallicity values obtained for four different degrees of regularization (parameter REGUL=1, 2, 3, 4) are AgeL(Myr)=[254, 243, 213, 200] and [M/H]L=[0.20, 0.20, 0.21, 0.20], in agreement with the results obtained with other methods (see Tab.2)
The degeneracy between age, metallicity and dust has been probed by repeating the fitting with STARLIGHT at fixed metallicity for the 11 different metallicities of the EMILES library. We made use of the F-test to compare the of the 11 fits with the best-fitting composite model. We found that, fits down to metallicity [Z/H]=-0.60 are still within one sigma from the best-fitting one. For this metallicity, [Z/H]=-0.60, the corresponding light- and mass-weighted ages are AgeL=420 Myr and AgeM=480 Myr with an extinction AV=0.01 mag. In Table 2, the values obtained at fixed solar metallicity are reported for reference purposes.
To test the effect of varying the IMF on age and metallicity estimates66 6 The effect of a time-dependent IMF and of metallicity on age and star formation timescale is discussed in Jeřábková et al. 2018 and Yan et al. 2019., we considered also a base of SSPs with Salpeter (Salpeter 1955) IMF. This IMF provides slightly (not significantly) older age than Chabrier IMF, as reported in Table 2.
In the case of -enhanced MILES SSPs (see § 2), the best fitting composite model provided a mass-weighted stellar age AgeM=30050 Myr and metallicity [Z/H]M=0.13, while the luminosity-weighted values are AgeL=23050 Myr and [Z/H]M=0.12.
Finally, Table 3 lists the best fitting age and metallicity values obtained with BC03 (Bruzual & Charlot 2003) and M11 (Maraston & Strömbäck 2011) models. The results are consistent with the reference EMILES library, with the exception of the light-weighted age obtained with M11 library, older than the others.
It is worth noting that metallicity, even if affected by larger uncertainty than age, is found to be always higher than solar ([Z/H]) independent of the models and the methods (see Tab. 2 and 3). Moreover, the best-fitting metallicity values obtained for the 100 simulated spectra are all higher than solar (see Fig. 12), i.e. lower metallicity values never provide better fit, regardless the age and the extinction. This suggests that, actually, age, metallicity and dust extinction are not completely degenerate with respect to absorption features and continuum shape.
Even if acceptable fit can be obtained for sub-solar metallicity values, all the results point toward a supersolar metallicity for C1-23152, regardless of the method, the models and the IMF.
| AgeL | [Z/H]L | AgeM∗ | [Z/H]M∗ | Model |
|---|---|---|---|---|
| (Gyr) | (Gyr) | |||
| 0.27 | 0.06 | 0.30 | 0.10 | BC03 |
| 0.80 | 0.21 | … | … | M11 |
V.2 Stellar populations and SFH


Figure 7 shows the contribution to the stellar mass of the different SSPs that compose the best-fitting composite model. STARLIGHT fitting detects two main stellar components (out of the five) contributing for more than 95% of the stellar mass: an older one peaked about 600 Myr prior to the epoch of observation, setting the initial formation redshift to , and a younger one peaked 150 Myr prior to observation, constraining the redshift of quenching at . The presence of two main stellar components is also suggested by the distribution of the best-fitting components obtained on the 100 simulated spectra shown in the middle panel of Figure 7. The fitting at fixed metallicity described in § 5.1 does not significantly affect the SFH in the sense that, the star formation is always constrained within an interval 450-500 Myr with an older main component and one or more younger components. As example, in the right panel of Figure 7, it is shown the SFH at solar metallicity.
We probed the possible degeneracy in the solutions, by repeating the full spectral fitting with pPXF (see § 5.1). Fig. 8 shows the weighted age-metallicity map for the SSPs contributing to the best-fitting model obtained for each of the four regularization values (REGUL=1, 2, 3, 4). In all the cases, the SFH is constrained within the interval 0.1-0.6 Gyr, with an increasing smoothness for increasing values of regularization.
These results demonstrate that the stellar population is not coeval as resulting from a SFH extended over an interval 450-500 Myr, possibly characterized either by two main massive episods or even by a more continuous distribution.
It is interesting to note, that the spectra of quiescent galaxies at 3 reported to date appear in a post-starburst phase (D’Eugenio et al. 2020, see e.g.,), as C1-23152. As such, the spectra are sensitive to the time since quenching, being dominated by the youngest stellar population (i.e. the stars formed around quenching) which outshine older stars. This effect could make it difficult to detect stellar populations formed before quenching, i.e. to infer the actual time over which galaxies formed stars and the age of the bulk of the galaxy stellar population.
We tested the ability of spectral fitting in detecting stellar populations older than the outshining youngest one, by running STARLIGHT with the same setup used for the spectrum of C1-23152, on a synthetic spectrum composed of a SSP 200 Myr old accounting for 35% (75%) of stellar mass (flux at 4000 Å), and a SSP 1.0 Gyr old accounting for the remaining 65% (25%)77 7 See Cid Fernandes et al. 2005 for the robustness of Starlight in recovering different SFHs.. The simulated spectrum and the resulting SFH are shown in Figure 9. Even if with different fractions of mass, the two components have been detected, constraining the time since quenching (youngest) and the time since the first important episode of star formation (oldest). Therefore, we are confident that the SFH found for C1-23152 is not affected by the major contribution in light from the youngest population.
The analysis shows that the build-up of C1-23152 has taken place in about 600 Myr as constrained by the oldest stellar component, i.e. in the range 3.354.6. The youngest stellar component constrains the time since quenching at 150 Myr, in agreement with the upper limit to the current star formation rate, SFR6.5 M⊙ yr-1 and with the constraints derived in § IV.2. It follows that the stellar mass (21011 M⊙, see below) has been formed in an interval 450-500 Myr, corresponding to an average 400 M⊙ yr-1. If the SFH was characterized by the two main episodes of star formation (Fig. 7), their SFR would be 1200 M⊙ yr-1.88 8 We used eq. (5) in Asari et al. 2007 and we derived the SFR as the ratio between the fraction of mass in the burst by the age bin size, considering that the age resolution of the models is 100 Myr for age500 Myr and 50 Myr at younger ages. Therefore, this SFR is a lower limit driven by the age resolution of the models.


We also adopted an independent approach by using FAST++ (Kriek et al. 2018; Schreiber et al. 2018)99 9 https://github.com/cschreib/fastpp to perform a simultaneous parametric fitting of the spectrum and the multi-wavelength UltraVISTA photometry. The fitting is described in detail in appendix A. According to the adopted SFHs (a delayed exponentially declining SFH and a double exponentially increasing/decresing SFH), the build-up of the galaxy would be realized in less than 250 Myr prior to observations (mass assembly 3.353.8), a time significantly shorter than the one obtained through FSF. The resulting mean stellar age is younger than the ages obtained through ALF and STARLIGHT. This approach deals principally with broad/narrow-band photometry, i.e. with the stars producing the dominant light. Therefore, in this case, the youngest stellar population could affect the results (Maraston et al. 2010; Greggio & Renzini 2011, see e.g.,).
V.3 Stellar mass estimate
To estimate the stellar mass of C1-23152, we adopted different approaches: (i) we relied on the STARLIGHT FSF results, using the relation M∗=mini4d/M⊙ (Cid Fernandes et al. 2007), where mini is the normalization factor of the EMILES composite model to obtain the observed flux and dL is the luminosity distance. This approach provides M∗=1.5()1011 M⊙ after having normalized the spectrum to the observed K-band flux (KAB=20.31) of C1-23152; (ii) we used the result of ALF (see above). We normalized the EMILES SSP model corresponding to ageL=0.24 Gyr and ZL=0.27 to match the V-band restframe flux of C1-23152 from Marsan et al. 2015. This provides a stellar mass estimate of M∗1.01011 M⊙; (iii) we used the outputs of FAST++ (see Appendix A) based on BC03 models, which provides values in the range M∗=2.6-3.11011 M⊙ (consistent with the estimate by Marsan et al. 2015, M∗=2.81011, based on SED fitting, scaled to Chabrier IMF). Combining all these values, we obtain a final estimate of M∗=2.0(0.7)1011 M⊙1010 10 For a Salpeter IMF, given the ages as measured in Tab. 2 , the stellar mass is a factor 1.3 larger than for a Chabrier IMF (as derived from EMILES models), i.e. M∗=2.6(0.7)1011 M⊙., consistent with the constraint imposed by the dynamical mass (see below). The uncertainty accounts for the different estimates of M∗, based on different methods, software and models. The resulting stellar mass density within Re is = M⊙ kpc-2 where =0.5/(R), i.e. we assumed that the stellar mass profile follows the luminosity profile of the galaxy.
Parameter Value Comment Redshift, 3.3520.002 From Marsan et al. 2015 Effective Radius, Re 1.00.1 kpc in F160 band from Marsan et al. 2015 Sersic index, 4.4 in F160 band from Marsan et al. 2015 Stellar velocity dispersion, 40960 km s-1 Scaled to the effective radius Age 400 Myr Age of the bulk of stellar mass Metallicity [Z/H] 0.25 Expressed as log(Z/Z⊙) Extinction, AV 0.05 mag Dynamical mass, 2.2 M⊙ From eq. (4) Stellar mass, M∗ 2.0(0.7)1011 M⊙ Mean of different estimates Current SFR M⊙ yr-1 Hβ emission line limit Build-up timescale, 600100 Myr 3.354.6 assembly of galaxy Time since quenching, 15050 Myr Time since last burst Stellar mass formation, 450110 Myr Interval of star formation Average SFR within 440110 M⊙ yr-1 SFR required to form M∗ in
V.4 Stellar velocity dispersion measurement and dynamical mass estimate
A velocity dispersion measurement was performed by fitting the observed spectrum using pPXF (Cappellari & Emsellem 2004; Cappellari 2017). The fitting was performed by masking out the regions with emission lines ([OII], H, [OIII]) and the region of low atmospheric transmission (18000-19000 Å) between H and K bands (see Fig. 2). In the fitting, a Legendre polynomial with degree=4 is added to correct the template continuum shape during the fit. We verified that the result does not depend on the polynomial degree by varying it in the range 1-4. The stability of the measurement with respect to the wavelength range considered was tested by shifting and varying the width of the masked regions by about 200 Å, and by fitting the H-band data only. In all the cases considered, we obtained values within 5% of our nominal estimate. The dependence of the velocity dispersion measurements of the library of templates used, was tested by repeating the fitting to the observed spectrum with different libraries of SSP models, EMILES-Padova (Vazdekis et al. 2015), BC03 and M11. These additional sets of templates provided values within 6% from the reference value.1111 11 Velocity dispersion measurement based primarily on Balmer lines, dominated by high rotational velocity A-type stars, may be subject to systematics if the correct stellar population is not matched (Belli et al. 2017, e.g.). We tested for possible systematics by repeating the fit with stellar spectra from the Indo-U.S. library (Valdes et al. 2004), first using only F, G and K stars, than including also A stars. We obtained, in the two cases, =41041 km and =38448 km respectively, with the value obtained using stellar population synthesis models (=396 km ) in between.
The galaxy stellar velocity dispersion was derived from the relation , where km is the velocity dispersion resulting from the pPXF spectral fitting, km is the broadening due to the instrumental resolution, 10 km is the broadening due to the uncertainty in the wavelength calibration of the frames. The robustness of estimate was tested by repeating the measurement for a set of 100 simulated spectra (see Appendix B). We estimated km within a diameter aperture of =0.75 arcsec (the slit width). The resulting velocity dispersion within the effective radius Re=1 kpc (Marsan et al. 2015) is km , where we used the relation (Jørgensen et al. 1995; Cappellari et al. 2006)1212 12 This correction is derived from observations of local resolved galaxies. However, being a power-law, it can be applied also to spatially unresolved galaxies, as it is the case for C1-23152..
The dynamical mass of the galaxy has been derived from the velocity dispersion and the effective radius Re through the relation
| (4) |
where G is the gravitational constant and is the virial coefficient which takes into account the distribution of both luminous and dark matter (DM) and the projection effects (Bertin et al. 2002; Lanzoni & Ciotti 2003). We used (Cappellari et al. 2006)1313 13 We note that the relations relevant to dynamical properties of galaxies heavily rely on local studies. It is uncertain if these relations can be applied as they are also to galaxies in the early Universe. However, we noticed that, for a theoretical value of Kn=5, the dynamical mass and the DM fraction would change by about 13%. with Sérsic index , as resulting from surface brightness fitting (Marsan et al. 2015). We thus obtained M⊙.
We note that, in case of Chabrier IMF, the DM fraction is less than 10%, even if with large errors () while, for a Salpeter IMF =-0.180.3, still consistent with a null fraction. These results suggest that the DM fraction within the effective radius is extremely low in massive dense ETGs, as already noticed in ETGs at (Saracco et al. 2020), and that a bottom-heavy IMF (higher ratio of low- to high-mass stars) is disfavored in dense ETGs, irrespective of their redshift (Gargiulo et al. 2015). Notice that, based on results at 0 a bottom-heavy IMF is expected to be confined in the very central regions of galaxies, making the integrated stellar mass-to-light ratio within the effective radius below the expectation for a Salpeter IMF (La Barbera et al. 2019, see, e.g.). However, our observations virtually collect the whole object light and cannot detect this effect.
VI Discussion and conclusions

VI.1 The formation of a massive ETG at high-z
The analysis of the LBT-LUCI spectrum of the galaxy C1-23152 has lead to the following results (summarized in Tab.4). C1-23152 is an early-type galaxy hosting an AGN at that assembled 2.0(0.5) M⊙ of stars, quenched its star formation and shaped its morphology in the 600 Myr preceding the observation, i.e. between 3.354.6, as constrained by the oldest stellar component detected in the galaxy. This fast build-up is significantly shorter than that expected based on dynamical friction merging timescales, larger than 2-3 Gyr (Boylan-Kolchin et al. 2008, e.g.,). The short assembly time suggests that the stellar mass growth has taken place in-situ through highly dissipative processes rather than ex-situ through mergers of pre-existing stellar systems (Kroupa et al. 2020, e.g.,).
The high stellar velocity dispersion, =40960 km s-1, confirms the high mass, Mdyn=)1011 M⊙, and the high mass density of the galaxy. The surface stellar mass density within Re is =)1010 M⊙ kpc-2 (=)1010 M⊙ kpc-2), comparable with the density of the densest and most massive ETGs in the local Universe, as shown in Figure 10. This high mass density coherently argues for a highly dissipative formation process as expected theoretically (Hopkins et al. 2010; Lapi et al. 2018, e.g.,), and from the empirical Kennicutt-Schmidt law (Kennicutt 1998a). This fast dissipative process could result from a cosmological merger of gas-dominated systems (Naab et al. 2007, e.g.) or from violent instability of a gas-rich disk (Dekel & Burkert 2014), and points toward a role of the density in regulating the quenching process (Woo et al. 2015; Tacchella et al. 2016).
The whole stellar mass observed at has been formed within a short interval, 450 Myr, corresponding to an average 400 M⊙ yr-1, possibly through two main episodes of star formation or through a continuous episode. The resulting stellar population has a mean mass-weighted AgeM=400 Myr. The supersolar metallicity, [Z/H]=0.25 agrees with a fast dissipative process and points toward a star formation efficiency much higher than the replenishment time of the gas, resembling a nearly closed-box enrichment. Supersolar metallicity ([Z/H]=0.13) is also obtained when -enhanced models are considered. These abundance ratios may better match the overabundance of [Mg/Fe] observed in local massive ETGs (Worthey et al. 1992, e.g.,), overabundance usually interpreted as a result of short formation timescales (Trager et al. 2000; Renzini 2006, 1 Gyr; see e.g.,). Indeed, Vazdekis et al. 1996 show that, in case of closed-box regime, supersolar metallicity can be reached just within the first 100-200 Myr of star formation, a timescale comparable to the star formation of C1-23152 (Pantoni et al. 2019, see also). It is interesting to note that, in this approximation, the expected final extinction is negligible, as indicated by the virtually null value (AV=0.050.05) obtained by spectral fitting.
The star formation in C1-23152 has halted 100-150 Myr before observation, leaving a residual star formation 6.5 M⊙ yr-1. Therefore, quenching mechanism must have been extremely efficient to reduce the star formation to few M⊙ yr-1 in less than 150 Myr. The presence of an AGN could explain the fast quenching even if it is usually associated to a powerful outflow (Cicone et al. 2014; Maiolino et al. 2012, e.g.,) whose presence is difficult to assess from our data. Our analysis cannot establish a causality between the high mass density or the AGN and the extremely fast suppression of star formation. On the other hand, this study suggests that they can play a role in the very fast quenching process of massive galaxies in the early Universe.
VI.2 The evolution of a massive ETG since z=3.35
Figure 10 compares the physical properties (effective radius, velocity dispersion, surface mass density and stellar mass) of C1-23152 (big black points) with those of local ETGs with comparable mass (see § 2). In particular, for the local Universe, we considered ETGs selected from SPIDER sample (La Barbera et al. 2010, gray circles;), the ETGs with 350 km s-1 from Bernardi et al. 2006 (black triangles), the compact ETGs with high velocity dispersion selected by Saulder et al. 2015 (red square) and the compact ETGs missed by the Sloan Digital Sky Survey (SDSS) and identified by Damjanov et al. 2015 (orange stars). At redshift , the properties of C1-23152 are compared with those of the galaxy at (Tanaka et al. 2019; Tanaka et al. 2020) (green filled triangle), and an ETG at (Glazebrook et al. 2017) (light-blue square).
The evolutionary path that C1-23152 will follow in the subsequent 12 Gyr, whether minor merger will increase its size, and/or a secondary burst of star formation will rejuvenate the mean stellar age, or a major merger will increase its mass and size, or it will arrive unperturbed to , cannot be univocally determined. However, we investigated the properties of the possible descendant of C1-23152 according to the different evolutionary paths that the galaxy could follow.
In an equal mass (1:1) dry-merger, the growth in stellar mass is approximately the same as the growth in size (Ciotti et al. 2007; Hopkins et al. 2009, e.g.,). Consequently the velocity dispersion remains nearly constant, and the surface mass density decreases as the size increase. This case is shown in Figure 10 by the purple arrow for a mass increase by a factor 2, i.e. for a single major merger as expected for high-mass galaxies (De Lucia et al. 2006, e.g.).
If a mass increase by a factor 2 occurs via major wet-merger during which a significant fraction of the additional stellar mass is formed in-situ through star formation, then the size of the resulting galaxy increases less than a factor 2, depending on the fraction of mass involved in the dissipative process (Ciotti et al. 2007; Hopkins et al. 2009). Consequently, the velocity dispersion slightly increases, as the square root of the ratio between the mass and the size of the final system, while the surface density scales as the ratio between mass and the square of the radius. This case is shown by the light-purple arrow in Figure 10, representing a size increase by a factor 1.5.
Finally, if the mass increase is due to accretion of very small systems, i.e. minor mergers, then the size increase is greater than that observed for dry major merger scenario. For a mass increase by a factor 2 and assuming a single merger of mass ratio (1:10), the radius grows by a factor 4 while the velocity dispersion and the stellar mass surface density decrease by a factor of 1.4 and 8, respectively (Ciotti et al. 2007; Hopkins et al. 2009; Naab et al. 2009; Bezanson et al. 2009). This case is shown by the dark-green arrow in Figure 10.
The cases considered show that C1-23152 will hardly grow its mass significantly through dissipative processes since the resulting galaxy would have a mass density and velocity dispersion higher than those of the densest and highest velocity dispersion ETGs in the local Universe. On the other hand, a mass growth through dry major or minor merging is instead conceivable (but see Nipoti et al. 2009, for the large scatter introduced by dry mergers in the scaling relations).
It is worth noting that Marchesini et al. 2014, using a semi-empirical approach based on abundance matching, find that the likely progenitors of local ultra-massive galaxies (log(M∗)11.8 M⊙) growth by 0.56dex in stellar mass since =3, i.e., their mass at 3 is 2-31011 M⊙, consistent with the mass of C1-23152 (see also Kubo et al. 2018, for a discussion on the size evolution of galaxies since 4).
Finally, Figure 10 shows also that the densest massive ETGs in the local Universe share the same extreme physical properties of C1-23152 at . Theoretically, it is established that, at all redshifts, dissipation is the most important factor determining the mass density and, hence, size of galaxies (Hopkins et al. 2009, e.g.,). Given the higher density of the Universe and the larger gas fractions at high redshift, densest galaxies are expected to form in the early Universe (Hopkins et al. 2010). Accordingly, lower redshift formation implies less dense galaxies. In Figure 10, the dashed line connecting small black dots represents the properties that a C1-23152-like galaxy would have, if it forms at redshift , assuming that its properties (equal to those of C1-23152 at =4, for simplicity) scale as the matter density of the Universe, where we assumed the simple scaling relation .
If the densest galaxies form at high redshift, they should host the oldest stellar populations. Indeed, observations have established that, at fixed mass, denser galaxies host older stars irrespective of their redshift (Saracco et al. 2009; Saracco et al. 2011; Valentinuzzi et al. 2010, e.g.) and, consequently, their formation epoch precedes the one of less dense galaxies (Saracco et al. 2020; Estrada-Carpenter et al. 2020, e.g.,). Therefore, even if C1-23152 may follow different possible evolutionary paths, the densest massive ETGs in the local Universe most likely have a C1-23152-like galaxy as progenitor that arrived unperturbed to =0, since their extreme properties require physical conditions for their formation similar to those for C1-23152, difficult to realize at lower redshift.
Appendix A FAST++ fitting
A great advantage of FAST++ is that the whole SED can be considered in the fitting, simultaneously modeling the photometry and the spectrum. However, the best fitting model is chosen among a set of model templates whose SFH is defined a priori. Any SFH implies a trade off between stellar age and duration of the star formation to best match the data. Therefore, the resulting age, interval within which the star formation can have taken place and SFR depend on the adopted SFHs. Metallicity is not a free parameter in the fitting, as it is fixed with the choice of adopted models. We considered, BC03 models with Chabrier 2003 IMF and Calzetti et al. 2000 extinction law. Two SFHs were considered: a delayed exponentially declining SFH (-mod hereafter) with e-folding time log(/yr)=[7-10] with step 0.1, and log(age/yr)=[7-9] with step 0.05, and a double exponential (Schreiber et al. 2018, 2-mod hereafter; e.g.,) exponentially increasing (log(trise/yr)=[7-9.5] with step 0.5), and exponentially decreasing (log(tdecl/yr)=[7-9.5] with step 0.5). In both cases, a recent burst was allowed to be present. For each of these two SFHs, a solar metallicity (Z=0.02) and super-solar metallicity (Z=0.05) were adopted. For C1-23152, we fit together the LBT spectrum and the multiwavelength UltraVISTA photometry composed of 49 bands. In addition to the 30 photometric bands used in the construction of the UltraVISTA DR1 catalog of Muzzin et al. 2013, photometry from the following images were included: ultra-deep optical imaging from HSC (Tanaka et al. 2017), the UltraVISTA DR3 YJHK (1.2 mag deeper than the DR1 images), deeper (by 1 mag) IRAC photometry from SPLASH (Mehta et al. 2018) and SMUVS (Caputi et al. 2017; Ashby et al. 2018), UltraVISTA NB118, five CFHTLS deep optical images, and medium-band NIR images from the NMBS (see Muzzin et al. 2020, in prep.).
In all the cases, the SED+spectrum excluded the presence of a recent burst. For Z=Z⊙(2.5Z⊙), in the -mod case, the star formation starts 251(224) Myr prior to observation and 50% of the mass (2.9(2.6)1011 M⊙) is formed in about 42(42) Myr at a mean SFR3430(3060) M⊙ yr-1. The star formation drops to 10% 123(96) Myr prior observation, leaving a residual SFR=8(19) M⊙ yr-1. The extinction is AV=0.5(0.4) mag.
The 2-mod SFH implies a slightly faster buildup and quenching (and larger peak of star formation): for Z=Z⊙(2.5Z⊙), the star formation starts 224(178) Myr prior to observation and 50% of the mass (3.1(2.7)1011 M⊙) is formed in 38(8) Myr at a mean SFR4066(16800) M⊙ yr-1. The star formation drops to 10% 135(151) Myr prior to observation, leaving a residual SFR=25(23) M⊙ yr-1. The extinction is AV=0.6(0.4) mag.
Therefore, according to the adopted SFHs, the build-up of C1-23152 would be realized in less than 250 Myr, i.e. between 3.353.8. The resulting mean stellar age is younger than the ages obtained with STARLIGHT for the same BC03 models (see Tab.3), and with ALF method, and the build-up of the galaxy significantly shorter.
Appendix B Simulations
The robustness of age, metallicity and velocity dispersion measurements was assessed by repeating the fitting to two sets of 100 simulated spectra having the same S/N of the observed spectrum. The first set (MC-set hereafter) was obtained through a Monte Carlo approach, i.e. by varying the value of the true observed spectrum by a shift randomly chosen from a gaussian distribution with sigma d, the error on . The second set of simulated spectra (R-set hereafter) was obtained by summing to the best-fitting model template the residuals R()=- randomly shuffled in wavelength within windows 200 Å wide, along the wavelength axis, i.e. =+R()
The distributions of the best fitting values obtained with the two sets of simulated spectra do not differ significantly. However, R-set has the advantage to take into account possible systematics in the observed spectrum due to sky residuals or sky absorptions. Reshuffling allows for considering the effects of these systematics both in the absorption lines fitting and in the full spectral fitting. For these reasons, we consider the results obtained from R-set as reference.

The results of the absorption lines fitting obtained with R-set
of simulated spectra is shown in Figure 11 while
Figure 12 shows the results obtained with full spectral fitting (STARLIGHT).
To quantify the dependence of the results on the IMF assumed,
for each simulated spectrum we measured age and metallicity by running STARLIGHT
using the same parameters setup and two bases of SSP models, one based on Chabrier IMF and
the other on Salpeter IMF, as for the observed spectrum of galaxy C1-23152.
The distribution of the best-fitting extinction values AV are always constrained within low values,
with a median extinction AV=0.060.06 mag in the case of Charbier IMF and AV=0.080.09 mag in the case of Salpeter IMF.
Figure 12 the results obtained for the two different IMFs.
Salpeter IMF provides best-fitting mass-weighted ages with a slightly larger spread
with respect to Chabrier IMF.
Notice that the differences due to varying the IMF are not significant.
The errors at 68% confidence level reported in Tab. 1 for galaxy C1-23152 are
derived from the distribution of the best fitting values obtained from these simulations.

References
- Ageorges et al. (2010) Ageorges, N., Seifert, W., Jütte, M., et al. 2010, Society of Photo-Optical Instrumentation Engineers (SPIE) Conference Series, Vol. 7735, LUCIFER1 commissioning at the LBT, 77351L
- Asari et al. (2007) Asari, N. V., Cid Fernandes, R., Stasińska, G., et al. 2007, MNRAS, 381, 263. https://arxiv.org/abs/0707.3578
- Ashby et al. (2018) Ashby, M. L. N., Caputi, K. I., Cowley, W., et al. 2018, ApJS, 237, 39. https://arxiv.org/abs/1801.02660
- Baldwin et al. (1981) Baldwin, J. A., Phillips, M. M., & Terlevich, R. 1981, PASP, 93, 5
- Balogh et al. (1999) Balogh, M. L., Morris, S. L., Yee, H. K. C., Carlberg, R. G., & Ellingson, E. 1999, ApJ, 527, 54
- Beifiori et al. (2011) Beifiori, A., Maraston, C., Thomas, D., & Johansson, J. 2011, A&A, 531, A109. https://arxiv.org/abs/1012.3428
- Belli et al. (2014) Belli, S., Newman, A. B., & Ellis, R. S. 2014, ApJ, 783, 117. https://arxiv.org/abs/1311.3317
- Belli et al. (2017) Belli, S., Genzel, R., Förster Schreiber, N. M., et al. 2017, ApJl, 841, L6. https://arxiv.org/abs/1703.07778
- Bernardi et al. (2006) Bernardi, M., Nichol, R. C., Sheth, R. K., Miller, C. J., & Brinkmann, J. 2006, AJ, 131, 1288
- Bertin et al. (2002) Bertin, G., Ciotti, L., & Del Principe, M. 2002, A&A, 386, 149
- Bezanson et al. (2009) Bezanson, R., van Dokkum, P. G., Tal, T., et al. 2009, ApJ, 697, 1290. https://arxiv.org/abs/0903.2044
- Boylan-Kolchin et al. (2008) Boylan-Kolchin, M., Ma, C.-P., & Quataert, E. 2008, MNRAS, 383, 93. https://arxiv.org/abs/0707.2960
- Brooks & Christensen (2016) Brooks, A., & Christensen, C. 2016, in Astrophysics and Space Science Library, Vol. 418, Galactic Bulges, ed. E. Laurikainen, R. Peletier, & D. Gadotti, 317. https://arxiv.org/abs/1511.04095
- Bruzual (1983) Bruzual, A. G. 1983, ApJS, 53, 497
- Bruzual & Charlot (2003) Bruzual, G., & Charlot, S. 2003, MNRAS, 344, 1000
- Calzetti et al. (2000) Calzetti, D., Armus, L., Bohlin, R. C., et al. 2000, ApJ, 533, 682
- Cappellari (2017) Cappellari, M. 2017, MNRAS, 466, 798. https://arxiv.org/abs/1607.08538
- Cappellari & Emsellem (2004) Cappellari, M., & Emsellem, E. 2004, PASP, 116, 138
- Cappellari et al. (2006) Cappellari, M., Bacon, R., Bureau, M., et al. 2006, MNRAS, 366, 1126
- Caputi et al. (2017) Caputi, K. I., Deshmukh, S., Ashby, M. L. N., et al. 2017, ApJ, 849, 45. https://arxiv.org/abs/1705.06179
- Cardelli et al. (1989) Cardelli, J. A., Clayton, G. C., & Mathis, J. S. 1989, ApJ, 345, 245
- Cassata et al. (2013) Cassata, P., Giavalisco, M., Williams, C. C., et al. 2013, ApJ, 775, 106. https://arxiv.org/abs/1303.2689
- Chabrier (2003) Chabrier, G. 2003, PASP, 115, 763
- Cicone et al. (2014) Cicone, C., Maiolino, R., Sturm, E., et al. 2014, A&A, 562, A21. https://arxiv.org/abs/1311.2595
- Cid Fernandes et al. (2007) Cid Fernandes, R., Asari, N. V., Sodré, L., et al. 2007, MNRAS, 375, L16
- Cid Fernandes et al. (2005) Cid Fernandes, R., Mateus, A., Sodré, L., Stasińska, G., & Gomes, J. M. 2005, MNRAS, 358, 363
- Cimatti et al. (2008) Cimatti, A., Cassata, P., Pozzetti, L., et al. 2008, AA, 482, 21. https://arxiv.org/abs/0801.1184
- Ciotti et al. (2007) Ciotti, L., Lanzoni, B., & Volonteri, M. 2007, ApJ, 658, 65
- Damjanov et al. (2015) Damjanov, I., Geller, M. J., Zahid, H. J., & Hwang, H. S. 2015, ApJ, 806, 158. https://arxiv.org/abs/1501.04976
- Davidge & Clark (1994) Davidge, T. J., & Clark, C. C. 1994, AJ, 107, 946
- Davies (2007) Davies, R. I. 2007, MNRAS, 375, 1099. https://arxiv.org/abs/astro-ph/0612257
- De Lucia et al. (2006) De Lucia, G., Springel, V., White, S. D. M., Croton, D., & Kauffmann, G. 2006, MNRAS, 366, 499
- Dekel & Burkert (2014) Dekel, A., & Burkert, A. 2014, MNRAS, 438, 1870. https://arxiv.org/abs/1310.1074
- D’Eugenio et al. (2020) D’Eugenio, C., Daddi, E., Gobat, R., et al. 2020, ApJ, 892, L2. https://arxiv.org/abs/2003.04342
- Estrada-Carpenter et al. (2020) Estrada-Carpenter, V., Papovich, C., Momcheva, I., et al. 2020, arXiv e-prints, arXiv:2005.12289. https://arxiv.org/abs/2005.12289
- Forrest et al. (2020a) Forrest, B., Annunziatella, M., Wilson, G., et al. 2020a, ApJ, 890, L1. https://arxiv.org/abs/1910.10158
- Forrest et al. (2020b) Forrest, B., Marsan, Z. C., Annunziatella, M., et al. 2020b, ApJ, 903, 47. https://arxiv.org/abs/2009.07281
- Francis et al. (1991) Francis, P. J., Hewett, P. C., Foltz, C. B., et al. 1991, ApJ, 373, 465
- Gallazzi et al. (2006) Gallazzi, A., Charlot, S., Brinchmann, J., & White, S. D. M. 2006, MNRAS, 370, 1106. https://arxiv.org/abs/astro-ph/0605300
- Gargiulo et al. (2015) Gargiulo, A., Saracco, P., Longhetti, M., et al. 2015, A&A, 573, A110. https://arxiv.org/abs/1410.5229
- Glazebrook et al. (2017) Glazebrook, K., Schreiber, C., Labbé, I., et al. 2017, Nature, 544, 71. https://arxiv.org/abs/1702.01751
- Gobat et al. (2012) Gobat, R., Strazzullo, V., Daddi, E., et al. 2012, ApJ, 759, L44. https://arxiv.org/abs/1210.4299
- Goto et al. (2003) Goto, T., Nichol, R. C., Okamura, S., et al. 2003, PASJ, 55, 771. https://arxiv.org/abs/astro-ph/0301305
- Greggio & Renzini (2011) Greggio, L., & Renzini, A. 2011, Stellar Populations. A User Guide from Low to High Redshift
- Hill et al. (2017) Hill, A. R., Muzzin, A., Franx, M., et al. 2017, ApJ, 837, 147. https://arxiv.org/abs/1702.06126
- Hopkins et al. (2009) Hopkins, P. F., Hernquist, L., Cox, T. J., Keres, D., & Wuyts, S. 2009, ApJ, 691, 1424, doi: 10.1088/0004-637X/691/2/1424
- Hopkins et al. (2010) Hopkins, P. F., Murray, N., Quataert, E., & Thompson, T. A. 2010, MNRAS, 401, L19. https://arxiv.org/abs/0908.4088
- Jeřábková et al. (2018) Jeřábková, T., Hasani Zonoozi, A., Kroupa, P., et al. 2018, A&A, 620, A39. https://arxiv.org/abs/1809.04603
- Jørgensen et al. (1995) Jørgensen, I., Franx, M., & Kjaergaard, P. 1995, MNRAS, 276, 1341
- Kennicutt (1998a) Kennicutt, Robert C., J. 1998a, ApJ, 498, 541. https://arxiv.org/abs/astro-ph/9712213
- Kennicutt (1998b) Kennicutt, Jr., R. C. 1998b, ARA&A, 36, 189
- Kriek et al. (2009) Kriek, M., van Dokkum, P. G., Labbé, I., et al. 2009, ApJ, 700, 221. https://arxiv.org/abs/0905.1692
- Kriek et al. (2018) —. 2018, FAST: Fitting and Assessment of Synthetic Templates. http://ascl.net/1803.008
- Kroupa et al. (2020) Kroupa, P., Subr, L., Jerabkova, T., & Wang, L. 2020, MNRAS, 498, 5652. https://arxiv.org/abs/2007.14402
- Kubo et al. (2018) Kubo, M., Tanaka, M., Yabe, K., et al. 2018, ApJ, 867, 1. https://arxiv.org/abs/1810.00543
- La Barbera et al. (2010) La Barbera, F., de Carvalho, R. R., de La Rosa, I. G., et al. 2010, MNRAS, 408, 1313
- La Barbera et al. (2013) La Barbera, F., Ferreras, I., Vazdekis, A., et al. 2013, MNRAS, 433, 3017. https://arxiv.org/abs/1305.2273
- La Barbera et al. (2019) La Barbera, F., Vazdekis, A., Ferreras, I., et al. 2019, MNRAS, 489, 4090. https://arxiv.org/abs/1909.01382
- Lanzoni & Ciotti (2003) Lanzoni, B., & Ciotti, L. 2003, A&A, 404, 819
- Lapi et al. (2018) Lapi, A., Pantoni, L., Zanisi, L., et al. 2018, ApJ, 857, 22. https://arxiv.org/abs/1803.04734
- Magrini et al. (2012) Magrini, L., Sommariva, V., Cresci, G., et al. 2012, MNRAS, 426, 1195. https://arxiv.org/abs/1206.1513
- Maiolino & Mannucci (2019) Maiolino, R., & Mannucci, F. 2019, A&A Rev., 27, 3. https://arxiv.org/abs/1811.09642
- Maiolino et al. (2012) Maiolino, R., Gallerani, S., Neri, R., et al. 2012, MNRAS, 425, L66. https://arxiv.org/abs/1204.2904
- Maraston et al. (2010) Maraston, C., Pforr, J., Renzini, A., et al. 2010, MNRAS, 407, 830. https://arxiv.org/abs/1004.4546
- Maraston & Strömbäck (2011) Maraston, C., & Strömbäck, G. 2011, MNRAS, 418, 2785. https://arxiv.org/abs/1109.0543
- Marchesini et al. (2010) Marchesini, D., Whitaker, K. E., Brammer, G., et al. 2010, ApJ, 725, 1277. https://arxiv.org/abs/1009.0269
- Marchesini et al. (2014) Marchesini, D., Muzzin, A., Stefanon, M., et al. 2014, ApJ, 794, 65. https://arxiv.org/abs/1402.0003
- Marsan et al. (2015) Marsan, Z. C., Marchesini, D., Brammer, G. B., et al. 2015, ApJ, 801, 133. https://arxiv.org/abs/1406.0002
- Mateus et al. (2007) Mateus, A., Sodré, L., Cid Fernandes, R., & Stasińska, G. 2007, MNRAS, 374, 1457
- Mehta et al. (2018) Mehta, V., Scarlata, C., Capak, P., et al. 2018, ApJS, 235, 36. https://arxiv.org/abs/1711.05280
- Miller & Owen (2002) Miller, N. A., & Owen, F. N. 2002, AJ, 124, 2453. https://arxiv.org/abs/astro-ph/0207662
- Moustakas et al. (2005) Moustakas, J., Kennicutt, R. C., J., Zaritsky, D., & AGN Galaxy Evolution Survey Collaboration. 2005, in American Astronomical Society Meeting Abstracts, Vol. 207, American Astronomical Society Meeting Abstracts, 43.02
- Muzzin et al. (2013) Muzzin, A., Marchesini, D., Stefanon, M., et al. 2013, ApJS, 206, 8. https://arxiv.org/abs/1303.4410
- Naab et al. (2009) Naab, T., Johansson, P. H., & Ostriker, J. P. 2009, ApJ, 699, L178. https://arxiv.org/abs/0903.1636
- Naab et al. (2007) Naab, T., Johansson, P. H., Ostriker, J. P., & Efstathiou, G. 2007, ApJ, 658, 710
- Newman et al. (2018) Newman, A. B., Belli, S., Ellis, R. S., & Patel, S. G. 2018, ApJ, 862, 126. https://arxiv.org/abs/1806.06815
- Nipoti et al. (2009) Nipoti, C., Treu, T., Auger, M. W., & Bolton, A. S. 2009, ApJ, 706, L86. https://arxiv.org/abs/0910.2731
- Nipoti et al. (2012) Nipoti, C., Treu, T., Leauthaud, A., et al. 2012, MNRAS, 422, 1714. https://arxiv.org/abs/1202.0971
- Oser et al. (2012) Oser, L., Naab, T., Ostriker, J. P., & Johansson, P. H. 2012, ApJ, 744, 63. https://arxiv.org/abs/1106.5490
- Oser et al. (2010) Oser, L., Ostriker, J. P., Naab, T., Johansson, P. H., & Burkert, A. 2010, ApJ, 725, 2312. https://arxiv.org/abs/1010.1381
- Pantoni et al. (2019) Pantoni, L., Lapi, A., Massardi, M., Goswami, S., & Danese, L. 2019, ApJ, 880, 129. https://arxiv.org/abs/1906.07458
- Peng et al. (2015) Peng, Y., Maiolino, R., & Cochrane, R. 2015, Nature, 521, 192. https://arxiv.org/abs/1505.03143
- Pietrinferni et al. (2004) Pietrinferni, A., Cassisi, S., Salaris, M., & Castelli, F. 2004, ApJ, 612, 168
- Poggianti & Barbaro (1997) Poggianti, B. M., & Barbaro, G. 1997, A&A, 325, 1025. https://arxiv.org/abs/astro-ph/9703067
- Renzini (2006) Renzini, A. 2006, ARA&A, 44, 141
- Salpeter (1955) Salpeter, E. E. 1955, ApJ, 121, 161
- Saracco et al. (2020) Saracco, P., Gargiulo, A., La Barbera, F., Annunziatella, M., & Marchesini, D. 2020, MNRAS, 491, 1777. https://arxiv.org/abs/1911.01438
- Saracco et al. (2019) Saracco, P., La Barbera, F., Gargiulo, A., et al. 2019, MNRAS, 484, 2281
- Saracco et al. (2009) Saracco, P., Longhetti, M., & Andreon, S. 2009, MNRAS, 392, 718. https://arxiv.org/abs/0810.2795
- Saracco et al. (2011) Saracco, P., Longhetti, M., & Gargiulo, A. 2011, MNRAS, 412, 2707. https://arxiv.org/abs/1011.5740
- Saulder et al. (2015) Saulder, C., van den Bosch, R. C. E., & Mieske, S. 2015, A&A, 578, A134. https://arxiv.org/abs/1503.05117
- Schreiber et al. (2018) Schreiber, C., Glazebrook, K., Nanayakkara, T., et al. 2018, A&A, 618, A85. https://arxiv.org/abs/1807.02523
- Scodeggio et al. (2005) Scodeggio, M., Franzetti, P., Garilli, B., et al. 2005, PASP, 117, 1284. https://arxiv.org/abs/astro-ph/0409248
- Serven et al. (2005) Serven, J., Worthey, G., & Briley, M. M. 2005, ApJ, 627, 754
- Silverman et al. (2009) Silverman, J. D., Lamareille, F., Maier, C., et al. 2009, ApJ, 696, 396. https://arxiv.org/abs/0810.3653
- Springel et al. (2018) Springel, V., Pakmor, R., Pillepich, A., et al. 2018, MNRAS, 475, 676. https://arxiv.org/abs/1707.03397
- Straatman et al. (2014) Straatman, C. M. S., Labbé, I., Spitler, L. R., et al. 2014, ApJ, 783, L14. https://arxiv.org/abs/1312.4952
- Tacchella et al. (2016) Tacchella, S., Dekel, A., Carollo, C. M., et al. 2016, MNRAS, 458, 242. https://arxiv.org/abs/1509.00017
- Tanaka et al. (2017) Tanaka, M., Hasinger, G., Silverman, J. D., et al. 2017, arXiv e-prints, arXiv:1706.00566. https://arxiv.org/abs/1706.00566
- Tanaka et al. (2019) Tanaka, M., Valentino, F., Toft, S., et al. 2019, ApJL, 885, L34. https://arxiv.org/abs/1909.10721
- Tanaka et al. (2020) —. 2020, ApJ, 894, L13
- Thomas et al. (2010) Thomas, D., Maraston, C., Schawinski, K., Sarzi, M., & Silk, J. 2010, MNRAS, 404, 1775. https://arxiv.org/abs/0912.0259
- Trager et al. (2000) Trager, S. C., Faber, S. M., Worthey, G., & González, J. J. 2000, AJ, 120, 165
- Trager et al. (1998) Trager, S. C., Worthey, G., Faber, S. M., Burstein, D., & González, J. J. 1998, ApJS, 116, 1
- Valdes et al. (2004) Valdes, F., Gupta, R., Rose, J. A., Singh, H. P., & Bell, D. J. 2004, ApJS, 152, 251
- Valentino et al. (2020) Valentino, F., Tanaka, M., Davidzon, I., et al. 2020, ApJ, 889, 93. https://arxiv.org/abs/1909.10540
- Valentinuzzi et al. (2010) Valentinuzzi, T., Fritz, J., Poggianti, B. M., et al. 2010, ApJ, 712, 226. https://arxiv.org/abs/0907.2392
- van de Sande et al. (2013) van de Sande, J., Kriek, M., Franx, M., et al. 2013, ApJ, 771, 85. https://arxiv.org/abs/1211.3424
- Vazdekis et al. (1996) Vazdekis, A., Casuso, E., Peletier, R. F., & Beckman, J. E. 1996, ApJS, 106, 307. https://arxiv.org/abs/astro-ph/9605112
- Vazdekis et al. (2015) Vazdekis, A., Coelho, P., Cassisi, S., et al. 2015, MNRAS, 449, 1177. https://arxiv.org/abs/1504.08032
- Wellons et al. (2015) Wellons, S., Torrey, P., Ma, C.-P., et al. 2015, MNRAS, 449, 361. https://arxiv.org/abs/1411.0667
- Woo et al. (2015) Woo, J., Dekel, A., Faber, S. M., & Koo, D. C. 2015, MNRAS, 448, 237. https://arxiv.org/abs/1406.5372
- Worthey et al. (1992) Worthey, G., Faber, S. M., & Gonzalez, J. J. 1992, ApJ, 398, 69
- Worthey & Ottaviani (1997) Worthey, G., & Ottaviani, D. L. 1997, ApJS, 111, 377
- Yan et al. (2019) Yan, Z., Jerabkova, T., & Kroupa, P. 2019, A&A, 632, A110. https://arxiv.org/abs/1911.02568