Atomic and electronic structure of cesium lead triiodide surfacesPreprint: AIP/123-QED
Abstract
The (001) surface of the emerging photovoltaic material cesium lead triiodide (CsPbI3) is studied. Using first-principles methods, we investigate the atomic and electronic structure of cubic () and orthorhombic () CsPbI3. For both phases, we find that CsI-termination is more stable than PbI2-termination. For the CsI-terminated surface, we then compute and analyse the surface phase diagram. We observe that surfaces with added or removed units of nonpolar CsI and PbI2 are most stable. The corresponding band structures reveal that the phase exhibits surface states that derive from the conduction band. The surface reconstructions do not introduce new states in the band gap of CsPbI3, but for the phase we find additional surface states at the conduction band edge.
I Introduction
In recent years, perovskite solar cells (PSCs) have generated increased attention within the photovoltaic community. The most common PSC photoabsorbers are hybrid organic-inorganic halide perovskites (HPs) with ABX3 structure, where A is an (organic) monovalent cation, B either Pb or Sn, and X a halogen. Among the HPs, the most widely studied materials are methylammonium (MA) lead iodide ( or ) and formamidinium (FA) lead iodide [ or ]. HPs are the most promising materials for next-generation photovoltaic technologies as reflected by their rapidly rising power conversion efficiency (PCE): it reached 25% NRE 2020 only seven years after the invention of the state-of-the-art PSC architecture in 2012 (PCE 10%) Kim et al. 2012; Lee et al. 2012. HPs are also promising for light emitting diodes, lasers, and photodetectors Huang and Lambrecht 2014; Lin et al. 2015; Cho et al. 2015. Their outstanding properties for optoelectronic applications include optimal band gaps, excellent absorption in the visible range of the solar spectrum, exceptional transport properties for both electrons and holes, flexibility of composition engineering, as well as low cost in both materials and fabrication Snaith 2013; Green et al. 2014; Stranks et al. 2013; Xing et al. 2013; Eperon et al. 2015; Troughton et al. 2017.
Despite the rapid PCE improvement in the laboratory, stability issues limit the development and commercialization of HPs for real photovoltaic applications. Especially, the organic components in hybrid perovskites are susceptible to ambient conditions such as moisture, oxygen, and heat, and exposure leads to rapid performance degradation Niu et al. 2014; Niu et al. 2015; Huang et al. 2017; Kim et al. 2017; Mesquita et al. 2018; Ciccioli and Latini 2018; Li et al. 2018. Several approaches have been proposed to solve these pressing stability problems, including surface protection with organic long-chain ligands Schmidt et al. 2014; González-Carrero et al. 2015; Dong et al. 2019, synthesis of quasi two-dimensional perovskites Quan et al. 2016; Dou 2017; Ran et al. 2018; Wang et al. 2018; Liu et al. 2018; Ran et al. 2019, protective coating with inorganic semiconductors or insulators Matteocci et al. 2016; Cheacharoen et al. 2018a; Cheacharoen et al. 2018b; Seidu et al. 2019, and A-site substitution with smaller monovalent ions Noh et al. 2013; Yi et al. 2016; Zhou et al. 2016; Tan et al. 2017; Ciccioli and Latini 2018; Gao et al. 2018; Correa-Baena et al. 2017; Ganose et al. 2017.
In the context of A-site substitutions, the all-inorganic perovskite and its mixed-halide derivatives have emerged as a promising alternative to the hybrid MA- and FA-based perovskites. has a similar structure and slightly closer Pb–I packing and higher thermal and chemical stabilities than MAPbI3 and FAPbI3 Eperon et al. 2015; Frolova et al. 2017. The latest PCE of -based PSCs has already reached 18% Wang et al. 2019, but more materials design and device engineering are needed to increase the conversion efficiency and the operational stability. This applies to several aspects, such as morphology control of the HP thin films, interface engineering between and interlayer materials, and the passivation of intrinsic defects at the interfaces and grain boundaries, which act as nonradiative recombination centers thus degrading the device efficiency. A comprehensive understanding of the atomic and electronic structure of surfaces would advance its development as a PSC photoabsorber. The surfaces of MA- and FA-based perovskites have been investigated theoretically Haruyama et al. 2014; Haruyama et al. 2016; Grånäs et al. 2016; Akbari et al. 2017 and experimentally Jiang et al. 2019; Chen et al. 2018; Cho et al. 2018; Saliba et al. 2016a; Saliba et al. 2016b; Saliba et al. 2016c. For , however, we are only aware of bulk defect studies Li et al. 2017a; Huang et al. 2018; Sutton et al. 2018; Evarestov et al. 2019. The surfaces and interfaces of have not yet been considered.
In this work, we present first-principles density functional theory (DFT) calculations for the reconstructed surfaces of the photovoltaic-active (cubic) and (orthorhombic) phases of . Starting from the pristine (clean) surface models with CsI- and PbI2-terminations (denoted by CsI-T and PbI2-T, respectively), constituent elements (Cs, Pb, and I) as well as their complexes (CsI, PbI, and PbI2) were added to or removed from the surface. The thermodynamic stability of these surface models was investigated for different chemical environments by means of ab initio thermodynamics Reuter and Scheffler 2003a; Karsten Reuter and Catherine Stampfl and Matthias Scheffler 2005; Reuter and Scheffler 2003b. For the stable surface models, we calculated their electronic structure and elucidated changes in their electronic properties in comparison to the clean surfaces.
The remainder of this paper is organized as follows. In Sec. II, we briefly outline the computational details of our DFT calculations and summarize the thermodynamic constraints for the growth of bulk CsPbI3 as well as the CsI-T and PbI2-T surfaces. In Sec. III, we first analyze the stability of the clean-surface models (CsI-T and Pb2-T) and the reconstructed models with missing- and add-atoms (and their complexes). We then discuss changes in crystal structures due to missing- and add-atoms with focus on their stability and their atomic and electronic structure. Finally, we conclude with a summary in Sec. V.
II Computational details
All DFT calculations were performed using the Perdew-Burke-Ernzerhof exchange-correlation functional for solids (PBEsol) Perdew et al. 2008 implemented in the all-electron numeric-atom-centered orbital code fhi-aims Blum et al. 2009; Havu et al. 2009; Levchenko et al. 2015. We chose PBEsol because it describes the lattice constants of well at moderate computational cost Yang et al. 2017; Bokdam et al. 2017. Scalar relativistic effects were included by means of the zeroth-order regular approximation van Lenthe et al. 1993. We used standard fhi-aims tier 2 basis sets for all calculations, in combination with a -centered and a -point mesh for the bulk materials and the surface calculations with a slab model, respectively. The bulk structures were optimized with the analytical stress tensor Knuth et al. 2015. For the slab models, we fixed the the lattice constants and all atomic positions except for atoms in the top and bottom CsPbI3 units (the surface atoms). Surface-dipole correction Neugebauer and Scheffler 1992 was used in all surface calculations.
II.1 Structural optimization
II.1.1 Bulk and surface structures
In this work, we considered two experimentally accessible photovoltaic-active perovskite phases of : the (cubic) phase with space group Pm3̄m and the (orthorhombic) phase with space group Pnma. For each phase, we constructed and optimized a bulk supercell with DFT (structures shown in Fig. 1). The lattice parameters of our optimized phase are Å and . For the phase, the lattice parameters are Å, Å and , .

For each phase, we constructed the surface models by inserting a vacuum region in the direction of the investigated system. With a vacuum thickness and the inclusion of surface-dipole correction Neugebauer and Scheffler 1992, we minimized the interaction between neighboring slabs. In this work, we focused on the surfaces which are the major facet of halide perovskites Haruyama et al. 2014; Haruyama et al. 2016; Schulz et al. 2019 and the most relevant surfaces of . We carried out DFT calculations for surfaces with symmetric slab models for CsI-T and PbI2-T surfaces. As depicted in Fig. 2, the CsI-T surface model consists of 5 CsI and 4 PbI2 layers alternatively stacked along the direction. Similarly, the PbI2-T surface model has 5 PbI2 and 4 CsI alternating layers.To avoid quantum confinement in our slab model band structure plots, we added 5 units of CsPbI3 along the (001) direction of our 2 supercell and calculated the band structures before and after relaxation.

For both CsI-T and -T surface models, we studied different missing- and add-atom reconstructions. The missing- and add-atoms are labeled as v and i , respectively, with X indicating the atoms or their complexes. All add-atoms and their complexes were added to the surfaces, while missing-atoms were removed from the topmost layers containing those atoms. For instance, v , v , and v of CsI-T surfaces were constructed by removing atoms from the topmost CsI layer while v , v , and v indicate the removal of atoms from the PbI2 layer below the topmost CsI layer.
The surface unit cell allows us to study 26 reconstructed surface models each for CsI-T and PbI2-T. In detail, these amount to 13 missing-atom or missing-complex models (v , v , v [only in CsI-T], v , v , v [only in PbI2-T], v , v , v , v , v , v , v , and v) and 13 add-atom or add-complex structures (i , i , i , i , i , i , i , i , i [only in CsI-T], i , i , i , i , and i [only in PbI2-T]). For double missing- and add-atoms (i.e., v and i), we considered both line and diagonal options (i.e., removing iodine atoms along the or directions for v). We found no significant total-energy differences between these two modes. Hence we only present results from the diagonal modes in this paper.
In pursuit of open materials science Himanen et al. 2019, we made the results of all relevant calculations available on the Novel Materials Discovery (NOMAD) repository NOM.
II.2 Grand potential analysis
For a system in contact with a particle reservoir and neglecting finite temperature contributions, the thermodynamic stability of a structure is obtained from the grand potential, ,
| (1) |
Here is the chemical potential of species and the number of atoms of this species in the structure. The sum over runs over all elements in the compound. The relative stability between two systems both in contact with the same particle reservoir is determined by differences in , with indicating that phase is more stable than phase . A special case of is when a system is in contact with its constituent species in their most stable phase. This defines the standard formation energy which is denoted by hereafter:
| (2) |
Here, indicates the chemical potential of species in its most stable form. The thermodynamic stability condition states that the system’s total energy must be lower than the sum of its constituents’ chemical potentials, each in their most stable phase.
The chemical potentials are set by environmental conditions. We apply a simple transformation to the chemical potentials,
| (3) |
to introduce the parameter . is the change in the chemical potential away from its value in the element’s most stable phase, . The represent environmental growth conditions and are a convenient parameter to vary in order to map phase diagrams. The grand potential can be rewritten as
| (4) |
The relative stability condition between phases A and B is then
| (5) |
which can be rearranged as
We recognize for phases and ,
| (6) |
The inequality given in Eq. (6) is the basis for the phase diagram, including the SPDs in this work. We calculate using the DFT total energy of the surface for and the DFT total energy per species unit for . For the specific case of a surface formation energy, reduces to
| (7) |
for surface total energy , bulk total energy , and the total energy of any adsorbants . With the various total energies tabulated from DFT calculations, we plot an SPD based on the inequalities in Eq. (6) as a function of the parameters .
II.3 Thermodynamic constraints for stable bulk and surfaces
We first consider conditions for stable in the bulk. In order to avoid the formation of atomic Cs, Pb, and I as well as bulk CsI and , the region of the phase diagram for stable is determined by the inequalities,
| (8) |
and
| (9) |
The inequalities in Eq. (9) can be rearranged as
| (10) |
, , are calculated for the stable structures of Cs (I4̄3m), Pb (P63/mmc), and I ( molecule). Eqs. (8) and (10) are the conditions for stable . Formation energies for Eqs. (8) and (10) are calculated with DFT. Varying the three parameters , , and maps the bulk stability region.
To compare the stability of two surfaces, we solve Eq. (6) to obtain the SPDs. Eq. (6) is a condition for surface stability in addition to Eqs. (8) and (10), which are only for the bulk. The bulk and surface are not in isolation from each other. For this reason, the final surface stability is determined by overlaying the SPD on the bulk stability region. We consider the overlap of the stable bulk region with the SPD to be the predictor of a viable bulk and surface together.
III Results and Discussion
In this section, we present the results from our thermodynamic analysis, compare the stability of our surface termination models (CsI-T vs. PbI2-T), and analyse the most relevant terminations using SPDs. We conclude the section with the electronic properties of the bulk and most relevant reconstructed surface models.
III.1 Thermodynamic stability limits for bulk and surface terminations
The PBEsol-calculated formation energies of bulk CsI, PbI2 , -CsPbI3 , and -CsPbI3 are , , , and eV, respectively. From Eq. (10), the thermodynamic growth limits for bulk in the and the phases at then are
| (11) |
Similarly, the growth limits for bulk at in the and the phases are
| (12) |
The small difference between the left and the right values of these inequalities indicates the narrow stability region of bulk . The stability window in the phase is especially small, only eV. For each phase, the width of this region equals the energy required for to decompose into CsI and PbI2 . Therefore, the narrow energy range for the growth of bulk reflects the instability and ease of dissociation of into CsI and PbI2 , as alluded to in Sec. I.
Figure 3 depicts the SPDs for the CsI-T and PbI2-T clean surfaces in the and the phases at . The stable bulk region is represented with the white shading. The CsI-T and PbI2-T surfaces are stable in different regions. Since the CsI-T surface intersects the stable bulk region, we consider it more stable in conditions for bulk growth. Additionally, we observe stable CsI-T surfaces across a wider range of ( Cs, Pb, I) than PbI2-T surfaces. The results of Fig. 3 are similar to the findings of previous theoretical studies for Yin et al. 2014; Haruyama et al. 2014; Haruyama et al. 2016; Geng et al. 2015 on the stability of methylammonium-iodide terminated over PbI2-T surfaces. Our discussions will therefore focus on CsI-T surfaces from here on. Data for PbI2-T surfaces including the relaxed surface-reconstruction structures and the SPDs are given in Supplementary Material (SM).

III.1.1 Surface phase diagrams of CsI-T surface models
Figure 4 shows the SPDs for the considered surface reconstructions of the CsI-T surfaces (SPDs of PbI2-T reconstructed models are given in Fig. S4 in SM). In principle, we need to plot the SPD in 3 dimensions (3D) because it depends on three chemical potentials: , , and . Since such a 3D diagram is hard to visualize, we present two 2D slices instead, one / slice at and one / at . The left side of Fig. 4 shows the SPDs at and the right shows . Vertical panels show the and the phases, respectively. is plotted on the vertical axis and the other chemical potential plotted on the horizontal axis. Colored regions and their labels indicate the most stable surface at that pair of chemical potentials. The white shaded region again depicts the growth limit for stable bulk , which serves as our reference to determine the most relevant surface models.

For the phase (Fig. 4 upper panel), we find the following stable surface structures at some point in the phase diagram in the Pb-rich limit (): v , v , v , v , v , i , i , i , and the clean surface. In the Cs-rich limit (), we instead find v and i . The situation for the phase is very similar. The extent of some of the stability regions changes slightly from to , and the v reconstruction disappears from the phase diagram (Fig. 4 lower panel).
With the exception of v , all the observed reconstructions are valence-neutral, i.e., with addition or removal of valence-neutral units such as CsI or PbI2 . Here, valence-neutral units refer to added or removed complexes that do not induce “net charges“ on CsPbI3 as a whole. The addition or removal of valence-neutral units is energetically more favorable than that of single atoms or non-valence-neutral complexes, because it does not introduce free charge carriers, as we will demonstrate in Sec. III.2. As expected, we observe Cs-deficient reconstructed models (v , v , v) for low and Cs-rich ones (i) at the high region. A similar trend is observed for low and high Pb chemical potentials. A notable exception is the stability of i in the Pb-rich region in the upper right panel. Since the Cs chemical potential is at a maximum, the Cs-rich, i reconstruction dominates over Pb add-atom structures.
Of particular relevance to us are the surface reconstructions that intersect the bulk stability region (white region). These stable reconstructions that intersect the bulk region are the same for the and the phases. In addition to the clean CsI-T surface, we find only the valence-neutral surface reconstructions v , v , i , i , and i . It is noteworthy that although the clean surface occupies quite a broad stability region for , it is only stable if the growth conditions are I-deficient and not at all in Cs-rich conditions.
III.1.2 Atomic structures of the most relevant surface reconstructions
Figure 5 shows the relaxed geometries of the most relevant surface models (clean, v , v , i , i , and i) for the and the phases. The remaining surface structures are shown in Fig. . The clean surface does not exhibit any significant deviations from the bulk atomic positions after relaxation. Hence, all changes in the reconstructed structures will be discussed with reference to the clean surface hereafter.
In all reconstructions, we observe changes in the surface layer that translate into slight tilting of the surface octahedra. For instance, the surface octahedra in v for both phases tilt to account for the missing PbI2 units. Similarly, the surface octahedra of i and i tilt to accommodate the added PbI2 . In addition to the tilting, other slight changes in the atomic positions are observed. For example, the Cs-I bond lengths in the surfaces of i for both phases vary by Å. To highlight the changes in atomic positions, Cs, Pb, and I atoms of interest in Fig. 5 are depicted in pink, red and blue, respectively.
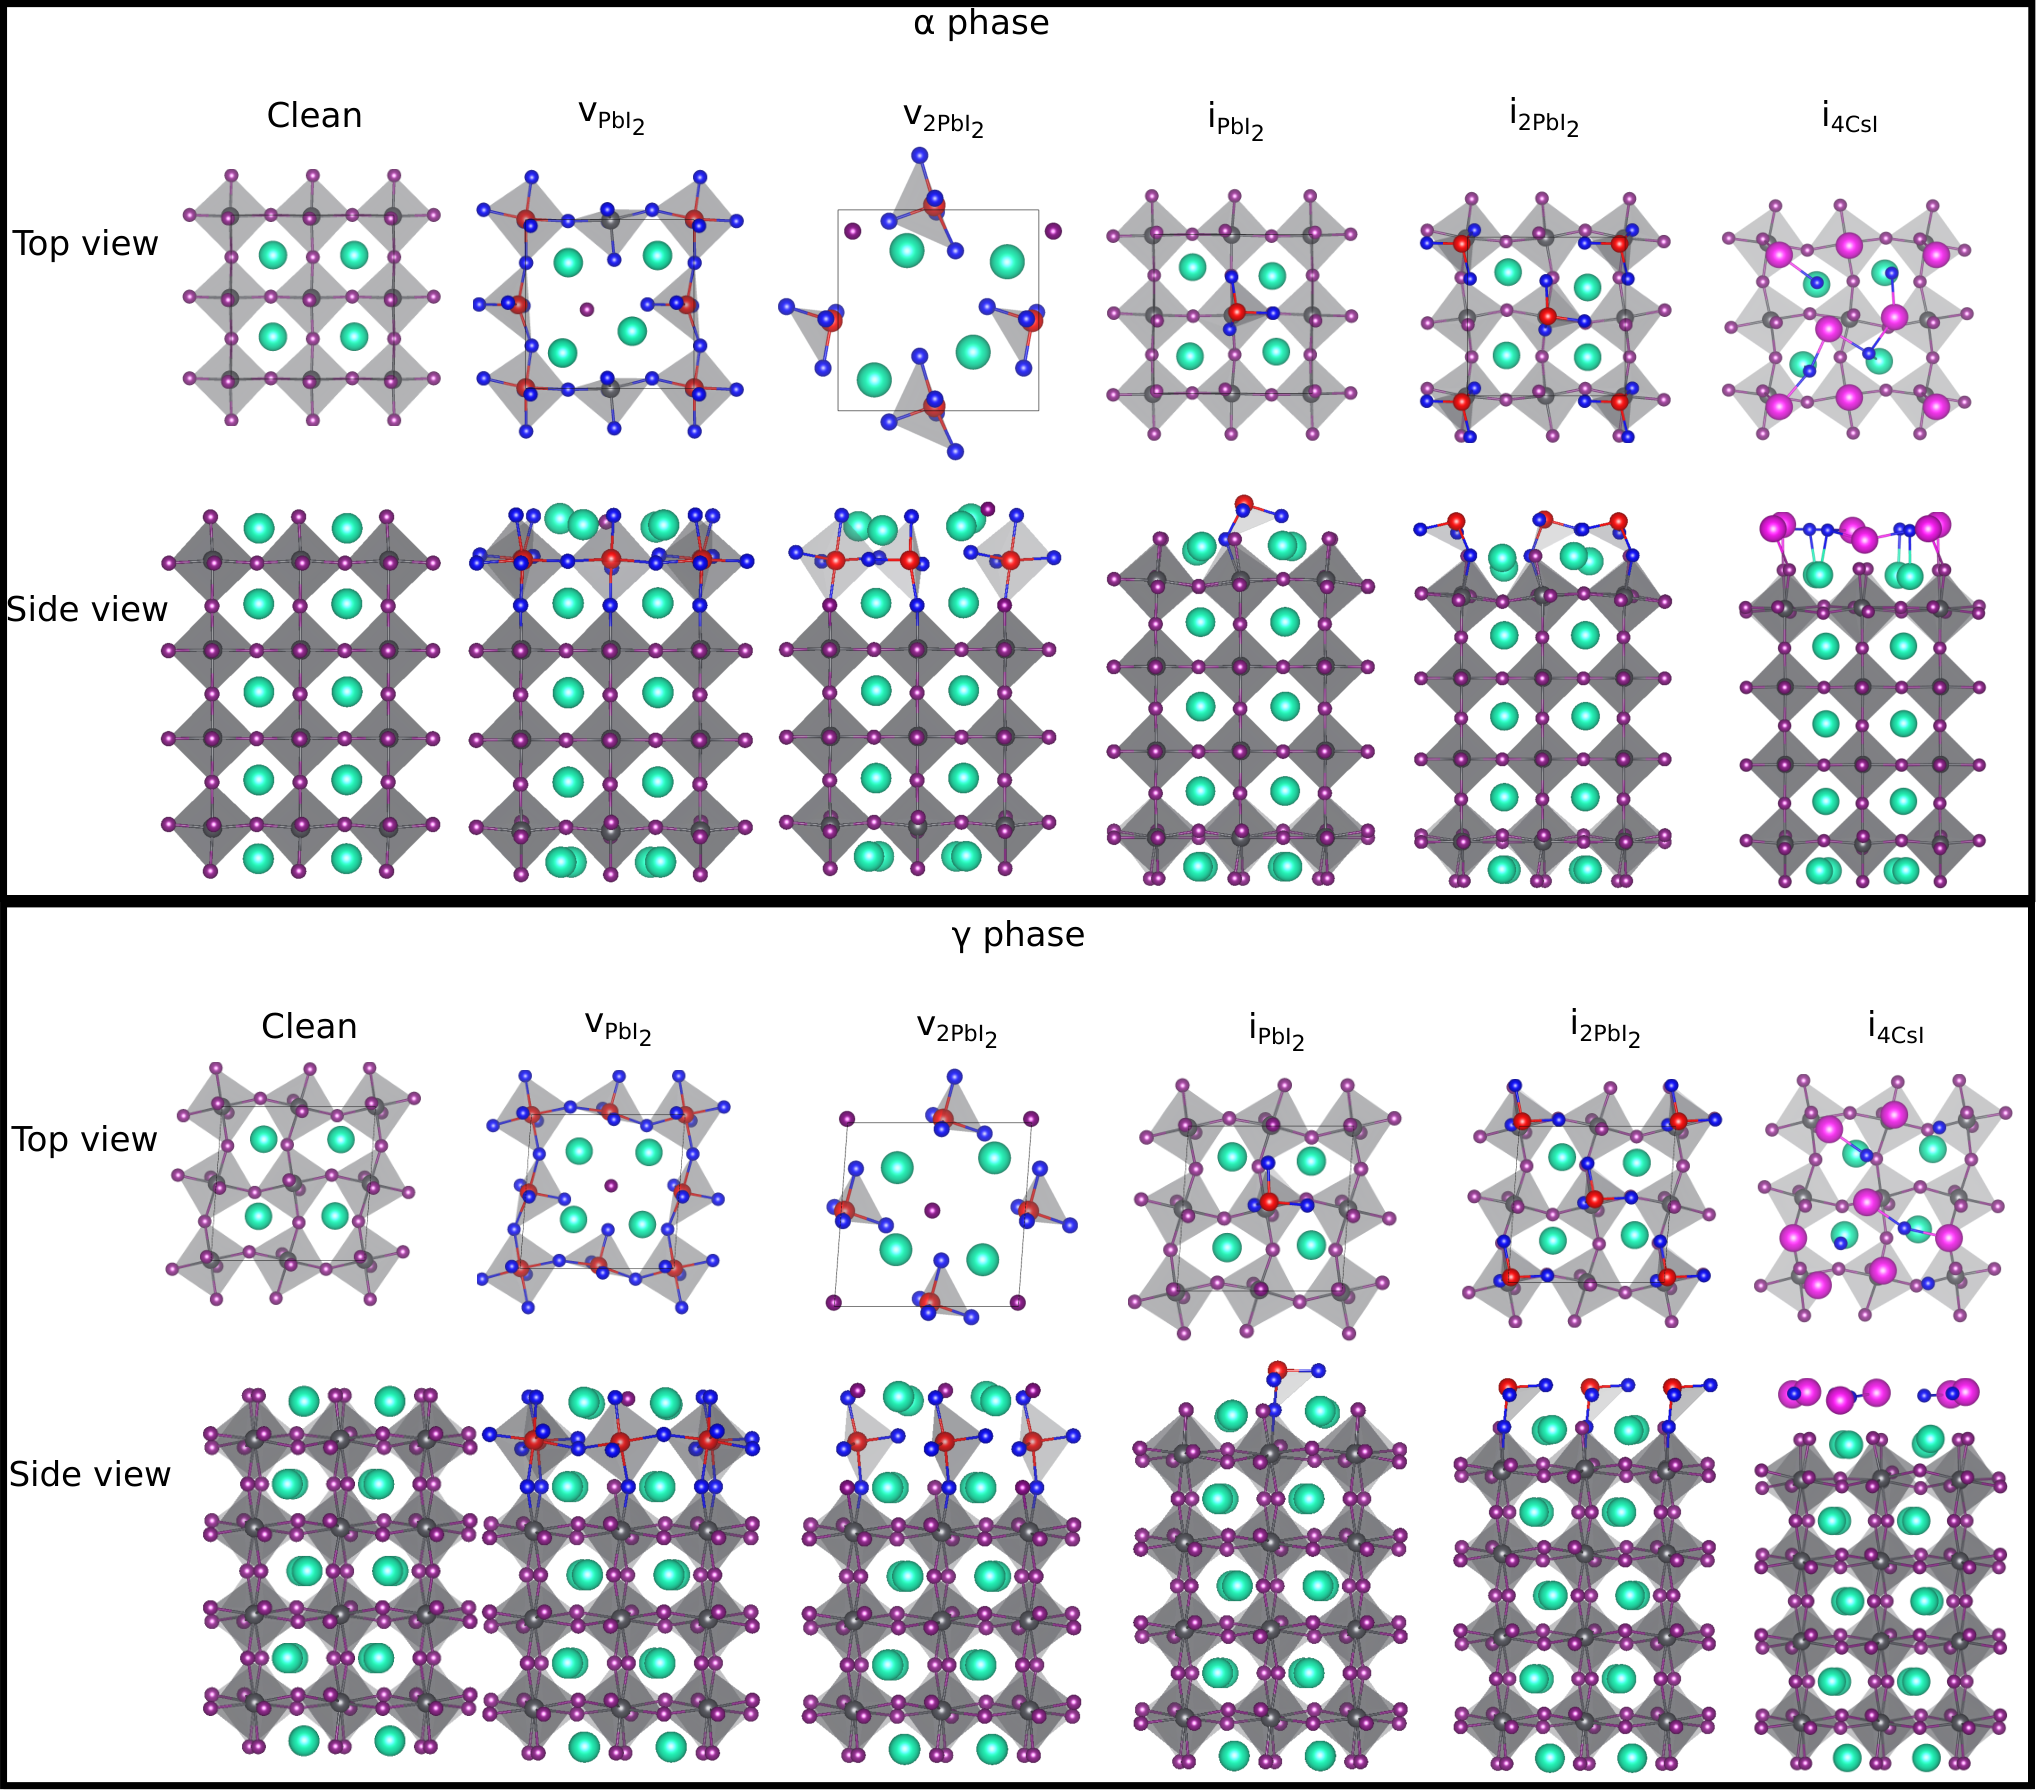
A more drastic change occurs for v in the phase. Migration of I atoms within the surface layer leads to an asymmetric distribution of them, causing the formation of separate and polyhedra in the surface layer. This structure is similar to the findings of Haruyama et al. for MAPbI3 Haruyama et al. 2014; Haruyama et al. 2015; Haruyama et al. 2016, in which they observed the formation of - polyhedra upon the removal of “one-half“ of the PbI2 units from the PbI2-T surfaces. Interestingly, we do not see the same atomic rearrangement for v in the phase. Instead, we find a relatively symmetric I distribution and two isolated PbI4 polyhedra. The different behavior in the phase is likely due to the larger lattice constant, which results in a larger Cs–Cs distance and a weaker binding of I atoms.
I migration is also observed in the i reconstruction of both phases and v of the phase (see Fig. S1 in SM). In each case, two I atoms move close to each other such that their distance is close to that of an I2 molecule Gurvich et al. 1989. Specifically, the I-I distance in v is reduced to Å. Similarly, the I–I distance of the added I atoms in i reduces to Å in the phase and Å in the phase. These values are close to the experimental bond length ( Å) of the I2 molecule in the gas phase Gurvich et al. 1989, albeit a bit larger since the surface I atoms are bound to other surface atoms such as Cs and Pb, thus reducing the bond strength of I–I.
III.2 Electronic properties of most relevant CsI-T surfaces
In this section, we discuss the electronic properties of bulk CsPbI3 , the clean surfaces in the and the phases, as well as the relevant reconstructions reported in Figs. 4 and 5.
III.2.1 Electronic properties of the bulk and the clean CsI-T surface
Figure 6 depicts the band structures of the bulk and the clean CsI-T surfaces of the and the phases. For the bulk of both phases, we adopt the high-symmetry -point path in the Brillouin zone for a simple-cubic lattice of the supercell model for simplicity. In addition, we only show the band structure along M–X––M with , , and , i.e., within the plane of the Brillouin zone (identical to the plane in real space in our cases). Accordingly, we plot the band structure of the surface unit cells of both phases along the same high-symmetry -point path for an easy comparison. The valence band maximum (VBM) in all plots is set to zero. In the band structure plots of the surface models, the projected bulk band structure is included as a blue-shaded background to help identify possible surface states Ingesfield 1982; Speer et al. 2009.

In both phases, bulk CsPbI3 exhibits a direct band gap at the point. The charge densities (shown in Fig. 7) reveal that the VBM of CsPbI3 in both phases is dominated by I-5p orbitals with a noticeable contribution from the Pb-6s orbitals, which gives rise to the well known antibonding character Huang et al. 2018; Haruyama et al. 2014; Haruyama et al. 2016; Li et al. 2017b. The conduction band maximum (CBM) mainly consists of Pb-6p orbitals.

Next, we investigate if the CsI termination introduces surface states. The middle panels of Fig. 6 show the band structure of the two unrelaxed CsI-T models. The bands of the supercell coincide with the projected bulk band structure, which indicates that no surface states appear. However, upon relaxation, the bottom of the conduction band is pulled into the bulk band gap for the phase but not for the phase, as can be seen in the right most band structure panels in Fig. 6. The clean surface of the phase therefore exhibits a surface state that derives from the CsPbI3 conduction band. This is further evidenced in Fig. 7, which shows that the lowest conduction band resides at the surface and has Pb-6p character. In contrast, the corresponding state in the phase is quite clearly a bulk state and not a surface state.
III.2.2 Electronic properties of most relevant reconstructed CsI-T surface models
Figure 8 shows the band structures of the most relevant surface models observed in Fig. 4, i.e., v , v , i4CsI , i and i . Similar to Fig. 6, the bulk band structure is included as the background for comparison.
Figure 8 displays a similar pattern as Fig. 6, i.e., the most notable changes in the band structure of the surface models appear for the phase near the bottom of the conduction band. For neither phase do we observe perturbations of the VBM region. Further inspection of the charge distributions of the valence-band-edge states shown in Fig. S2 in SM confirms that the VBM retains its bulk character for all relevant surface reconstructions.
For the reconstructed surface models of the phase, we observe the same surface states as in the clean-surface model (Fig. 6). In addition, flat bands appear near or below the conduction band edge that are most notable around the M-points of the band structure. The only exception is i , for which the surface band structure strongly resembles that of the clean CsI-T surface. The flat bands are especially pronounced in the v and v models. Correspondingly, the states near the conduction-band edge of these two surface reconstructions exhibit a more localized character than for the clean surface (compare Fig. S2 upper panel in SM with Fig. 7). For these surface models, the reconstruction therefore introduces additional surface states to the ones of the clean surface.

IV Discussion
Our results offer guidance for growing favorable CsPbI3 surfaces. By favorable, we here imply surface reconstructions that have a bulk-like band structure and no additional states in the band gap or perturbations of the band edges that might adversely affect the transport properties. Our analysis of the previous section suggests that the phase of CsPbI3 is generally more suited for this purpose, as all of its stable surface reconstructions are free of band edge perturbations.
For the phase, the objective would be to avoid both PbI2 deficient (v and v) and rich (i and i) reconstructions. Fortunately, the clean surface is stable across a wide range of the bulk stability region, as our surface phase diagram analysis shows. For Cs rich growth conditions, the i4CsI phase dominates the phase diagram. This phase provides a good alternative to the clean surface since its band structure resembles that of the clean surface closely.
V Conclusions
In summary, we have studied the surface atomic and electronic structure of CsPbI3 from first principles. For both the (cubic) and the (orthorhombic) phases, we have considered the clean-surface models and a series of surface reconstructions. Surface phase diagram analysis indicates that the CsI-terminated surface is more stable within a large range of allowed chemical potentials for both phases. In addition, several CsI and PbI2 rich and deficient surface reconstructions are stable. These surface reconstructions do not induce deep energy levels in the band gap. Nevertheless, the removal of PbI2 units in the CsI-terminated -CsPbI3 surface has noticeable effects on the material’s electronic structure, especially close to the conduction-band edge. Combining our surface-phase diagram and electronic structure analysis allows us to recommend growth regimes for CsPbI3 surfaces with favorable transport properties. Our work highlights the complexity of CsPbI3 surfaces and provides avenues for future surface science and interface studies.
VI Supplementary Material
See Supplementary Material for the charge density plots of all relevant surface models with CsI-termination, surface phase diagrams of PbI2-terminated models, crystal structures of studied surface models in both CsI-T and PbI2-T (that are not included in the main text) and the formation energies of all surface models.
Acknowledgments
We acknowledge the computing resources by the CSC-IT Center for Science, the Aalto Science-IT project, and Xi’an Jiaotong University’s HPC Platform. An award of computer time was provided by the Innovative and Novel Computational Impact on Theory and Experiment (INCITE) program. This research used resources of the Argonne Leadership Computing Facility, which is a DOE Office of Science User Facility supported under Contract DE-AC02-06CH11357. We further acknowledge funding from the European Union’s Horizon 2020 research and innovation programme under grant agreement No 676580 (The Novel Materials Discovery (NOMAD) Laboratory), the Väisälä Foundation as well as the Academy of Finland through its Centres of Excellence Programme (284621), its Key Project Funding scheme (305632) and project 316347.
VII Aip publishing data sharing policy
The data that supports the findings of this study will be openly available in NOvel Materials Discovery (NOMAD) repository at NOM.
References
- NRE [2020]
https://www.nrel.gov/pv/assets/pdfs/best-research-cell-efficiencies.20200311.pdf
(National Renewable Energy Laboratory: Best research-cell efficiencies, 2020). - Kim et al. [2012] H.-S. Kim, C.-R. Lee, J.-H. Im, K.-B. Lee, T. Moehl, A. Marchioro, S.-J. Moon, R. Humphry-Baker, J.-H. Yum, J. E. Moser, et al., Sci. Rep. 2, 591 (2012).
- Lee et al. [2012] M. M. Lee, J. Teuscher, T. Miyasaka, T. N. Murakami, and H. Snaith, Science 338, 643 (2012).
- Huang and Lambrecht [2014] L.-Y. Huang and W. R. L. Lambrecht, Phys. Rev. B 90, 195201 (2014).
- Lin et al. [2015] Q. Lin, A. Armin, D. M. Lyons, P. L. Burn, and P. Meredith, Advanced Materials pp. 2060–2064 (2015).
- Cho et al. [2015] H. Cho, S.-H. Jeong, M.-H. Park, Y.-H. Kim, C. Wolf, C.-L. Lee, J. H. Heo, A. Sadhanala, N. Myoung, S. Yoo, et al., Science 350 (2015).
- Snaith [2013] H. J. Snaith, J. Phys. Chem. Lett. 4, 3623 (2013).
- Green et al. [2014] M. A. Green, A. Ho-Baille, and H. J. Snaith, Nat. Photon. 8, 506 (2014).
- Stranks et al. [2013] S. D. Stranks, G. E. Eperon, G. Grancini, C. Menelaou, M. J. P. Alcocer, T. Leijtens, L. M. Herz, A. Petrozza, and H. J. Snaith, Science 342, 341 (2013).
- Xing et al. [2013] G. Xing, N. Mathews, S. Sun, S. S. Lim, Y. M. Lam, M. Grätzel, S. Mhaisalkar, and T. C. Sum, Science 342, 344 (2013).
- Eperon et al. [2015] G. E. Eperon, G. M. Paternò, R. J. Sutton, A. Zampetti, A. A. Haghighirad, F. Cacialli, and H. J. Snaith, J. Mater. Chem. A 3, 19688 (2015).
- Troughton et al. [2017] J. Troughton, K. Hooper, and T. M. Watson, Nano Energy 39, 60 (2017).
- Niu et al. [2014] G. Niu, W. Li, F. Meng, L. Wang, H. Dong, and Y. Qiu, J. Mater. Chem. A 2, 705 (2014).
- Niu et al. [2015] G. Niu, X. Guo, and L. Wang, J. Mater. Chem. A 3, 8970 (2015).
- Huang et al. [2017] J. Huang, S. Tan, P. D. Lund, and H. Zhou, Energy Environ. Sci. 10, 2284 (2017).
- Kim et al. [2017] G.-H. Kim, H. Jang, Y. J. Yoon, J. Jeong, S. Y. Park, B. Walker, I.-Y. Jeon, Y. Jo, H. Yoon, M. Kim, et al., Nano Lett. 17, 6385 (2017).
- Mesquita et al. [2018] I. Mesquita, L. Andrade, and A. Mendes, Renew. Sustain. Energy Rev. 82, 2471 (2018).
- Ciccioli and Latini [2018] A. Ciccioli and A. Latini, J. Phys. Chem. Lett. 9, 3756 (2018).
- Li et al. [2018] F. Li, J. Yuan, X. Ling, Y. Zhang, Y. Yang, S. H. Cheung, C. H. Y. Ho, X. Gao, and W. Ma, Adv. Funct. Mater. 18, 1706377 (2018).
- Schmidt et al. [2014] L. C. Schmidt, A. Pertegá, S. González-Carrero, O. Malinkiewicz, S. Agouram, G. M. Espallargas, H. J. Bolink, R. E. Galian, and J. Pérez-Prieto, J. Am. Chem. Soc. 136, 850 (2014).
- González-Carrero et al. [2015] S. González-Carrero, R. E. Galian, and J. Pérez-Prieto, J. Mater. Chem. A 3, 9187 (2015).
- Dong et al. [2019] H. Dong, J. Xi, L. Zuo, J. Li, Y. Yang, D. Wang, Y. Yu, L. Ma, C. Ran, W. Gao, et al., Adv. Funct. Mater. 29, 1808119 (2019).
- Quan et al. [2016] L. N. Quan, M. Yuan, R. Comin, O. Voznyy, E. M. Beauregard, S. Hoogland, A. Buin, A. R. Kirmani, K. Zhao, A. Amassian, et al., J. Am. Chem. Soc. 138, 2649 (2016).
- Dou [2017] L. Dou, J. Mater. Chem. C 5, 11165 (2017).
- Ran et al. [2018] C. Ran, J. Xi, W. Gao, F. Yuan, T. Lei, B. Jiao, X. Hou, and Z. Wu, ACS Energy Lett. 3, 713 (2018).
- Wang et al. [2018] Z. Wang, A. M. Ganose, C. Niu, and D. O. Scanlon, J. Mater. Chem. A 6, 5652 (2018).
- Liu et al. [2018] C. Liu, W. Huhn, K.-Z. Du, A. Vazquez-Mayagoitia, D. Dirkes, W. You, Y. Kanai, D. B. Mitzi, and V. Blum, Phys. Rev. Lett. 121, 146401 (2018).
- Ran et al. [2019] C. Ran, W. Gao, J. Li, J. Xi, L. Li, J. Dai, Y. Yang, X. Gao, H. Dong, B. Jiao, et al., Joule 3, 3072 (2019).
- Matteocci et al. [2016] F. Matteocci, L. Cinà, E. Lamanna, S. Cacovich, G. Divitini, P. A. Midgley, C. Ducati, and A. di Carlo, Nano Energy 30, 162 (2016).
- Cheacharoen et al. [2018a] R. Cheacharoen, N. Rolston, D. Harwood, K. A. Bush, R. H. Dauskardt, and M. D. McGehee, Energy Environ. Sci. 11, 144 (2018a).
- Cheacharoen et al. [2018b] R. Cheacharoen, C. C. Boyd, G. F. Burkhard, T. Leijtens, J. A. Raiford, K. A. Bush, S. F. Bent, and M. D. McGehee, Sustain. Energy Fuels 2, 2398 (2018b).
- Seidu et al. [2019] A. Seidu, L. Himanen, J. Li, and P. Rinke, New J. Phys. 21, 083018 (2019).
- Noh et al. [2013] J. H. Noh, S. H. Im, J. H. Heo, T. N. Mandal, and S. I. Seok, Nano Lett. 13, 1764 (2013).
- Yi et al. [2016] C. Yi, J. Luo, S. Meloni, A. Boziki, N. Ashari-Astani, C. Grätzel, S. M. Zakeeruddin, U. Röthlisberger, and M. Grätzel, Energy Environ. Sci. 9, 656 (2016).
- Zhou et al. [2016] Y. Zhou, Z. Zhou, M. Chen, Y. Zong, J. Huang, S. Pang, and N. P. Padture, J. Mater. Chem. A 4, 17623 (2016).
- Tan et al. [2017] H. Tan, A. Jain, O. Voznyy, X. Lan, F. P. G. de Arquer, J. Z. Fan, R. Quintero-Bermudez, M. Yuan, B. Zhang, Y. Zhao, et al., Science 355, 722 (2017).
- Gao et al. [2018] W. Gao, C. Ran, J. Li, H. Dong, L. Zhang, X. Lan, X. Hou, and Z. Wu, J. Phys. Chem. Lett. 9, 6999 (2018).
- Correa-Baena et al. [2017] J.-P. Correa-Baena, A. Abate, M. Saliba, W. Tress, T. J. Jacobsson, M. Grätzel, and A. Hagfeldt, Energy Environ. Sci. 10, 710 (2017).
- Ganose et al. [2017] A. M. Ganose, C. N. Savory, and D. O. Scanlon, Chem. Commun. 53, 20 (2017).
- Frolova et al. [2017] L. A. Frolova, D. V. Anokhin, A. A. Piryazev, S. Y. Luchkin, N. N. Dremova, K. J. Stevenson, and P. A. Troshin, J. Phys. Chem. Lett. 8, 67 (2017).
- Wang et al. [2019] Y. Wang, M. I. Dar, L. K. Ono, T. Zhang, M. Kan, Y. Li, L. Zhang, X. Wang, Y. Yang, X. Gao, et al., Science 365, 591 (2019).
- Haruyama et al. [2014] J. Haruyama, K. Sodeyama, L. Han, and Y. Tateyama, J. Phys. Chem. Lett. 5, 2903 (2014).
- Haruyama et al. [2016] J. Haruyama, K. Sodeyama, L. Han, and Y. Tateyama, Acc. Chem. Res. 49, 554 (2016).
- Grånäs et al. [2016] O. Grånäs, D. Vinichenko, and E. Kaxiras, Sci. Rep. 6, 36108 (2016).
- Akbari et al. [2017] A. Akbari, J. Hashemi, E. Mosconi, F. D. Angelis, and M. Hakala, J. Mater. Chem. A 5, 2339 (2017).
- Jiang et al. [2019] Q. Jiang, Y. Zhao, X. Zhang, X. Yang, Y. Chen, Z. Chu, Q. Ye, X. Li, Z. Yin, and J. You, Nat. Photon. 13, 460 (2019).
- Chen et al. [2018] P. Chen, Y. Bai, S. Wang, M. Lyu, J.-H. Yun, and L. Wang, Adv. Funct. Mater. 28, 1706923 (2018).
- Cho et al. [2018] H. Cho, A. M. Soufiani, J. S. Yun, J. Kim, D. S. Lee, J. Seidel, X. Deng, M. A. Green, S. Huang, and A. W. Y. Ho-Baillie, Adv. Energy. Mater. 8, 1703392 (2018).
- Saliba et al. [2016a] M. Saliba, T. Matsui, J.-Y. Seo, K. Domanski, J.-P. Correa-Baena, M. K. Nazeeruddin, S. M. Zakeeruddin, W. Tress, A. Abate, A. Hagfeldt, et al., Energy Environ. Sci. 9, 1989 (2016a).
- Saliba et al. [2016b] M. Saliba, S. Orlandi, T. Matsui, S. Aghazada, M. Cavazzini, J.-P. Correa-Baena, P. Gao, R. Scopelliti, E. Mosconi, K.-H. Dahmen, et al., Nat. Energy 1, 15017 (2016b).
- Saliba et al. [2016c] M. Saliba, T. Matsui, K. Domanski, J.-Y. Seo, A. Ummadisingu, S. M. Zakeeruddin, J.-P. Correa-Baena, W. Tress, A. Abate, A. Hagfeldt, et al., Science 354, 206 (2016c).
- Li et al. [2017a] Y. Li, C. Zhang, D. Huang, Q. Shen, Y. Cheng, and W. Huang, Appl. Phys. Lett. 111, 162106 (2017a).
- Huang et al. [2018] Y. Huang, W.-J. Yin, and Y. He, J. Phys. Chem. C pp. 1345–1350 (2018).
- Sutton et al. [2018] R. J. Sutton, M. R.Filip, A. A. Haghighirad, N. Sakai, B. Wenger, F. Giustino, and H. J. Snaith, ACS Energy Lett. 3, 1787 (2018).
- Evarestov et al. [2019] R. A. Evarestov, A. Sanocrate, E. A. Kotomin, and J. Maier, Phys. Chem. Chem. Phys. 21, 7841 (2019).
- Reuter and Scheffler [2003a] K. Reuter and M. Scheffler, Phys. Rev. Lett. 90, 0461031 (2003a).
- Karsten Reuter and Catherine Stampfl and Matthias Scheffler [2005] Karsten Reuter and Catherine Stampfl and Matthias Scheffler, Handbook of Material Modeling (Springer Dordreccht, 2005), s. yip ed.
- Reuter and Scheffler [2003b] K. Reuter and M. Scheffler, Phys. Rev. B 68, 045407 (2003b).
- Perdew et al. [2008] J. P. Perdew, A. Ruzsinszky, G. I. Csonka, O. A. Vydrov, G. E. Scuseria, L. A. Constantin, X. Zhou, and K. Burke, Phys. Rev. Lett. 100, 136406 (2008).
- Blum et al. [2009] V. Blum, R. Gehrke, F. Hanke, P. Havu, V. Havu, X. Ren, K. Reuter, and M. Scheffler, Comput. Phys. Commun. 180, 2175 (2009).
- Havu et al. [2009] V. Havu, V. Blum, P. Havu, and M. Scheffler, J. Comput. Phys. 228, 8367 (2009).
- Levchenko et al. [2015] S. V. Levchenko, X. Ren, J. Wieferink, R. Johanni, P. Rinke, V. Blum, and M. Scheffler, Comput. Phys. Commun. 192, 60 (2015).
- Yang et al. [2017] R. X. Yang, J. M. Skelton, E. L. da Silva, J. M. Frost, and A. Walsh, J. Phys. Chem. Lett. 8, 4720 (2017).
- Bokdam et al. [2017] M. Bokdam, J. Lahnsteiner, B. Ramberger, T. Schäfer, and G. Kresse, Phys. Rev. Lett. 119, 145501 (2017).
- van Lenthe et al. [1993] E. van Lenthe, E. J. Baerends, and J. G. Snijders, J. Chem. Phys. 99 (1993).
- Knuth et al. [2015] F. Knuth, C. Carbogno, V. Atalla, V. Blum, and M. Scheffler, Comput. Phys. Commun. 190, 33 (2015).
- Neugebauer and Scheffler [1992] J. Neugebauer and M. Scheffler, Phys. Rev. B 46, 16067 (1992).
- Schulz et al. [2019] P. Schulz, D. Cahen, and A. Kahn, Chem. Rev. pp. 3349–3417 (2019).
- Himanen et al. [2019] L. Himanen, A. Geurts, A. S. Foster, and P. Rinke, Adv. Sci. 6, 1900808 (2019).
- [70] To avoid the generation of multiple DOIs, submission to NOMAD repository will follow inclusion of reviewer’s comments.
- Yin et al. [2014] W.-J. Yin, T. Shi, and Y. Yan, Appl. Phys. Lett. 104, 063903 (2014).
- Geng et al. [2015] W. Geng, C.-J. Tong, Z.-K. Tang, C. Yam, Y.-N. Zhang, W.-M. Lau, and L.-M. Liu, Journal of Materiomics 1, 213 (2015).
- Haruyama et al. [2015] J. Haruyama, K. Sodeyama, L. Han, and Y. Tateyama, J. Am. Chem. Soc. 137, 10048 (2015).
- Gurvich et al. [1989] L. V. Gurvich, I. V. Veyts, and C. B. Alcock, Thermodynamic Properties of Individual Substances (Hemisphere Pub. Co. New York, 1989).
- Ingesfield [1982] J. E. Ingesfield, Rep. Prog. Phys. 45, 223 (1982).
- Speer et al. [2009] N. J. Speer, M. K. Brinkley, Y. Liu, C. M. Wei, T. Miller, and T. C. Chiang, Europhys. Lett. 88, 67004 (2009).
- Li et al. [2017b] W. Li, J. Liu, F.-Q. Bai, H.-X. Zhang, and O. V. Prezhdo, ACS Energy Lett. 2, 1270 (2017b).