Confirming the Explosive Outflow in G5.89 with ALMAJournal: ApJFacilities: ALMACASA (McMullin et al. 2007), KARMA (Gooch 1996)
Abstract
The explosive molecular outflow detected decades ago in the Orion BN/KL region of massive star formation was considered to be a bizarre event. This belief was strengthened by the non detection of similar cases over the years with the only exception of the marginal case of DR21. Here, we confim a similar explosive outflow associated with the UCHII region G5.890.39 that indicates that this phenomenon is not unique to Orion or DR21. Sensitive and high angular resolution ( 0.1′′) ALMA CO(21) and SiO(54) observations show that the molecular outflow in the massive star forming region G5.890.39 is indeed an explosive outflow with an age of about 1000 yrs and a liberated kinetic energy of 1046-49 erg. Our new CO(21) ALMA observations revealed over 30 molecular filaments, with Hubble-like expansion motions, pointing to the center of UCHII region. In addition, the SiO(54) observations reveal warmer and strong shocks very close to the origin of the explosion, confirming the true nature of the flow. A simple estimation for the occurrence of these explosive events during the formation of the massive stars indicates an event rate of once every 100 yrs, which is close to the supernovae rate.
Keywords:
instrumentation: interferometers, stars: formation, ISM: kinematics and dynamics, submillimeter: ISMI Introduction
The explosive outflows (with a kinetic energy injected that reaches the 1047-49 erg range) are suggested to be powered by the liberation of gravitational energy associated with the formation of a close-by stellar massive binary or maybe a protostellar merger (Bally et al. 2005; Zapata et al. 2017; Bally et al. 2017). The explosive molecular outflows are composed of tens of narrow straight molecular filament-like ejections with clear Hubble-like velocity increments that point back approximately to a common origin, and with a nearly isotropic configuration (Zapata et al. 2009; Bally et al. 2017; Bally et al. 2020). Rivera-Ortiz et al. 2019 showed that the duration of such explosive outflows should be around some thousand years. As more cases like Orion-KL or DR 21 come to light we would know in what extent the dynamical interactions are a key ingredient in oder to form massive stars. Sensitive searches using the recently finished ALMA observatory will be very important to discover more explosive outflows and runaway stars in close-by massive star forming regions.
G5.890.39 or W28A2 is a massive star forming region located at a distance of 2.99 kpc (Sato et al. 2014). This region contains a bright expanding shell-like UCHII region with a dynamical age of 600 years, estimated from its expansion rate (Acord et al. 1998). Feldt et al. 2003 proposed that a massive young O5 V star, revealed by their near infrared NACO-VLT observations, is energizing the UCHII region. This object, however, is offset by about 1′′ to the northwest from the center of the shell-like UCHII region. Feldt et al. 2003 also proposed that the young O5 V star may have migrated from the center of the UCHII region to the present place with a velocity of about 10 km s-1 some 1000 yrs ago. A second infrared object is also located at the edge of the UCHII region that is called Puga’s star (Puga et al. 2006) and is related with a northeast optical outflow. The nature of the molecular outflow in this region is not clear (Zapata et al. 2019). Harvey et al. 1998 reported that the molecular outflow located in G5.890.39 is one of the most powerful outflows in our galaxy with a kinetic energy of 1049 erg. However, more recent estimations place the energetics of this outflow in a range between 1046-48 erg (Acord et al. 1998; Klaassen et al. 2005). Using Chandra observations, Hampton et al. 2016 reported the presence of a gamma-ray source (HESSJ1800-240B) associated with G5.890.39 that maybe is related with the outflow arising from here. Very recently, Zapata et al. 2019 using Submillimeter Array (SMA) observations, detected the presence of six explosive filaments pointing directly to the center of the UCHII region. They deduced the presence of an explosive outflow and suggested a relation between the UCHII region and the flow, but their study was not conclusive.

Here, using much more sensitive11 1 A factor of 40 better in the rms noises, compared with the previous SMA observations, Zapata et al. 2019 spectral line ALMA (Atacama Large Millimeter/Submillimeter Array) CO(21) and SiO(54) observations together with a much better beam area22 2 Almost a factor of 70, again compared with the previous SMA observations provided us a better fidelity in the spectral and continuum images to study in more detail the intriguing molecular outflow in G5.890.39.
II Observations
The ALMA observations of G5.890.39 were carried out in 2019 September 5th as part of the Cycle 6 program 2018.1.00513.S (PI: Paul Ho). These observations were split in two sessions, one with 49 antennas and the other with 45 antennas, both using antennas with diameters of 12 m, yielding baselines with projected lengths from 38 to 3600 m (29–2769 k). As the primary beam at this frequency (Band 6) has a Full Width Half Maximum (FWHM) of about 25′′, the outflow from G5.890.39 was covered with a single pointing at the-sky-position = , and = . The total integration time on source that includes the two sessions is 78 min. The maximum recoverable scale for these observations is 2.5′′.
The weather conditions were excellent during these observations, with an average system temperature around 90 K and with an average precipitable water vapor around 1.8 mm. During these observations, the 183 GHz water line was monitored with water vapor radiometers (WVR), used to reduce atmospheric phase fluctuations. The quasars J19242914, J18202528, and J18312714 were used as the amplitude, atmosphere, bandpass, pointing, gain fluctuations, and WVR calibrators.
The continuum image presented in Figure 1 was obtained by averaging line-free spectral channels of nine spectral windows. The total bandwidth for the continuum is about 3.75 GHz. The spectral windows were selected to observe different molecular lines as for example CH3OH, HC3N, CO, and SiO. In this paper, we concentrate in the emission of the SiO(54) and CO(21) spectral lines at rest frequencies of 217.105 and 230.538 GHz, respectively. An in-depth study for the rest of the lines will be presented in a future paper. The spectral windows where we detected the SiO and CO have a native channel spacing of 488.3 kHz or 0.61 km s-1. However, given the broad velocity range of the lines, we smoothed the spacing channel to 2.44 km s-1.
The data were calibrated, imaged, and analyzed using CASA (McMullin et al. 2007), the Common Astronomy Software Applications package, Version 5.6. We also used some routines in Python to image the data (Astropy Collaboration et al. 2013). We imaged the uv-data using the task TCLEAN. We set the Robust parameter of TCLEAN equals to 0.5 for the continuum and line emissions. We obtained an image rms-noise for the 1.3 mm continuum of 0.2 mJy Beam-1 at an angular resolution of 0.12′′ 0.09′′ with a PA of 75∘. The ALMA theoretical rms-noise for this configuration, integration time, bandwidth, and frequency is approximately 0.02 mJy beam-1, which is an order of magnitud smaller. The strong continuum emission from the UCHII region (with a density flux of about 10 Jy and a dynamic range of 200) did not allow us to reach the theoretical noise levels. An alternative possibility is the lack of short spacing information on the continuum structure.
The line image rms-noise is 0.75 mJy beam-1 km s-1 at an angular resolution of 0.13′′ 0.09′′ with a PA of 73∘. The ALMA theoretical rms noise for this configuration, integration time, bandwidth (channel spacing), and frequency is about 0.7 mJy beam-1, which is also very close to the value we obtain in the line images. It is interesting to note that even when the line sensitivity is very close to that obtained theoretically, for the continuum emission it is not the case, again suggesting that the bright emission from the UCHII region is responsible for increased the rms-noise.
Phase self-calibration was done using the continuum emission as a model and then we applied the solutions to the line emission. We obtained about a factor two of improvement in the rms-noise.
III Results and Discussion
In Figure 1 we present the CO(21) moment one map (intensity weighted velocity image), traditionally used to obtain the “velocity field”, overlaid with the 1.3 mm continuum emission, and the 34 expanding filaments reported here that are related with this outflow. This map may help the reader to see clearly the expanding filaments emerging from the center of the flow. This thermal emission was especially selected from outside the velocity range from 20 to 40 km s-1, where the emission arises from the systemic molecular cloud and probably from some other clouds along the line-of-sight. At these velocities there are also strong absorption features associated with the UCHII at the center of the flow. We here avoid the confusing emission close to the embedding cloud systemic velocity, rather focussing on the filaments at higher velocities. The CO(21) thermal emission is found from 170 up to 130 km s-1. These velocities are broader as compared to those radial velocities reported in recent SMA studies (Hunter et al. 2008; Su et al. 2012; Zapata et al. 2019), probably because the better ALMA sensitivity allows us to detect fainter emission at higher velocities. We find 17 blueshifted, and 17 redshifted expanding filaments emerging from G5.890.39. Each filament marks the position of one sequence of molecular condensations mapped at different spectral channel velocities as already done in this, and other massive star forming regions (Zapata et al. 2009; Zapata et al. 2013; Zapata et al. 2019). These filaments coincide very well with some filamentary structures already traced by the moment one map and the six explosive filaments reported in Zapata et al. 2019. The most prominent filaments in this Figure, the three blueshifted to the south/north of the explosive event and the two redshifted to the north, are the ones already reported by those SMA observations (Hunter et al. 2008; Su et al. 2012; Zapata et al. 2019). The rest of the filaments are new detections and give a more complete view of the explosiveness of the flow in G5.890.39.
In Figure 1, it is also clear that the filaments get bluer or redder with increasing projected distance from their origin, suggesting that they follow a Hubble-velocity law, that is, the velocities increase linearly with on-the-sky distance from the center. This phenomenon is confirmed in the position-velocity diagram obtained in Figure 2 or the 3D view presented in Figure 4. This property is one of the main features that characterize the explosive outflows (Zapata et al. 2017). In Figure 1, the 1.3 mm continuum contours delineate a shell-like structure that is associated with the expanding and ionized UCHII region reported in G5.890.39 (Wood et al. 1989; Acord et al. 1998; Hunter et al. 2008). All filaments converge to the center of the UCHII, the place where they originated. This position is located at = 0.005s and = 0.75′′. The position given here is similar to the one obtained in Zapata et al. 2019 for the convergence of the six molecular filaments, but now with a better error. In addition, we also include in this Figure the positions of the two objects located in the vicinities of the ionized shell, the Feldt (Feldt et al. 2003) and Puga (Puga et al. 2006) objects reported at infrared wavelengths. In this image, we mark the location of the dusty and compact objects reported by the SMA observations (Hunter et al. 2008). Massive young stars found in the periphery of the UCHII region are likely related to the energetic explosion, but an in-depth proper motion study at optical or maybe infrared wavelengths is necessary to search for runaway massive stars in this region, as in the case of Orion BN-KL (Rodriguez et al. 2020). A search for an optical counterpart of the Feldt’s star in the GAIA catalogue failed (Zapata et al. 2019), likely because of the high extinction at low galactic latitudes (Foster et al. 2012).
In Figure 2, we present the on-the-sky distance vs. the radial velocity plot of the 34 expanding filaments reported in this letter, and presented in the moment one map (Figure 1). As mentioned earlier, the filaments follow nearly straight lines and seem to converge to a radial velocity range between 7.2 to 9.7 km s-1, the systemic velocity of the molecular cloud in G5.890.39 is around 9 km s-1, see Figure 7 from Hunter et al. 2008. In all filaments the radial velocities increase linearly with the projected distance to the center of the UCHII region, that is, follow a clear Hubble velocity-law. This pattern was already revealed by the SMA observations for the six filaments (Zapata et al. 2019), but it was not completely demonstrated that they belonged indeed to an explosive outflow. The lack of deceleration in the filaments is an indication of the impulsive nature of the expansion. This implies that the density of the ejecta must be substantially larger than the medium through which they move. In a Hubble flow crated by an explosion about 1,000 years ago, slower ejecta has moved a smaller distance than faster ejecta which has moved farther.
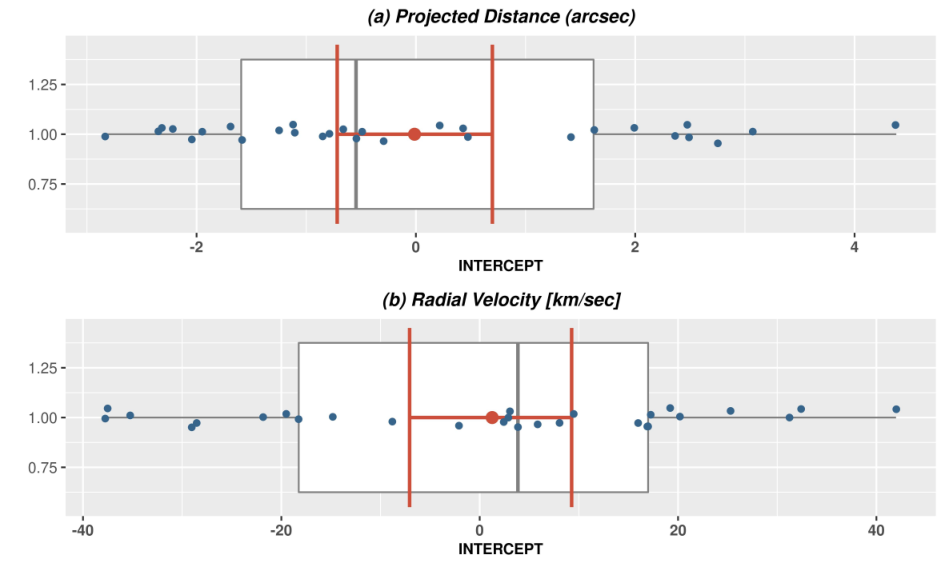
In Figure 3, we present a statistical analysis on the origin of the explosive outflow in G5.89. In this Figure is shown the jittered intercept estimated points and mean interval confidence for intercepts. Removing three outlier trajectories (or filaments), the mean of the projected distance intercepts is and a 95% confidence interval for the mean of intercepts is ICμ=(0.75′′,0.73′′). For the radial velocity mean of intercepts is + km s-1 and a 95% confidence interval for the mean of intercepts is ICμ=(7.25 km s-1, 9.77 km s-1). With p-value of 0.9725 for the projected distance and p-value of 0.7643 for the radial velocity the hypothesis of cannot be rejected for both cases. These results show that statistically all trajectories have a common coordinated system origin. We included this origin in Figure 1.


The fact that the filaments are not straight lines reveals internal structure, probably because lateral or across-the-line-of-sight motions. From these discrepancies, we can estimate the linear dispersion across the filaments, assuming a displacement of about 1′′ away from a linear trajectory over 1000 years, implies a traverse velocity of about 15 km s-1. Alternatively, these displacements may result from deflection of the ejecta by dense clumps. From the position-velocity diagram, taking maximum radial velocity of about 160 km s-1 and the maximum projected distance of 12′′, we obtained a kinematic age of 1000 yrs, a similar value for the fossil outflow reported by Klaassen et al. 2005 and the estimated time to reach the present position of the Feldt’s star.
A three-dimension (3D) view of the explosive outflow is presented in Figure 4. This image has three axis, the projected distance in RA and DEC (in arcseconds), and the radial velocity (in km s-1) of the filaments. Here, the central position is at (0′′,0′′,0 km s-1), where in RA it is at and DEC it is at . In the Figure it is clearly seen how the colors/velocities change getting bluer or redder far from the origin indicating a Hubble-law velocity of each filament as already noted. It is important to mention that inside of the UCHII region there is no emission from the filaments, they appear to start a bit farther from this position, see Figure 2.
In Figure 5 the moments of order zero (upper panel) and one (lower panel) emission of the SiO(54) spectral line from G5.890.39 are presented. To make this Figure, we integrated from 50 to 50 km s-1 in radial velocities. This velocity range includes the radial velocities close to the systemic cloud velocities (9 km s-1), but as this molecule emission is found mainly in strong shocks (Schilke et al. 1997), ALMA could sample very well all these velocities, with no ambient cloud contamination. We resolved the SiO thermal emission, and reveal many filaments in almost every orientation (i. e. with a nearly isotropic orientation), and again pointing back to the center of the UCHII region. Overall the SiO maps confirm the explosion in this region. Only a few SiO filaments have a counterpart in the CO emission. Most of the CO filaments are found farther out from the SiO ones, and with broader velocity ranges. The northwest bipolarity reported for this SiO outflow (Acord et al. 1998; Sollins et al. 2004) is totally lost in these new ALMA images, in which the outflow is more resemblant to an explosion.
Finally, one can make a very crude estimation of the rate of the explosive outflows occurring in our Galaxy using the case of Orion BN/KL , DR21, and G5.890.39. If we assume that this event occurs approximately three times every 10,000 years (the kinematic age of DR21) in a radius of 2.99 kpc, we obtain a rate of about one explosion every 130 years, close to the rate of supernovae (Tammann et al. 1994). The similarity between the event rates of explosive protostellar outflows and supernovae suggests that stellar dynamical interactions may play important roles in the formation of massive stars. Models of high-mass star formation should be revised to include dynamical interactions.
IV Conclusions
In summary, the sensitive and high angular ALMA observations allow us to find that the outflow in G5.890.39 is indeed an explosion that emerged from the center of an ionized UCHII region, and where young massive stars placed in its periphery could have powered the flow, but they moved from the center. G5.890.39 is thus the third explosive outflow in the Galaxy until now. Dedicated searches for explosive outflows in close-by massive star forming regions (for instance, if they take place when a protostellar merger is produced or by the formation of a capture of a companion into a close-binary orbit) could show this phenomenon to be more common than previously thought.
References
- Acord et al. (1998) Acord, J. M., Churchwell, E., & Wood, D. O. S. 1998,ApJ, 495, L107
- Astropy Collaboration et al. (2013) Astropy Collaboration, Robitaille, T. P., Tollerud, E. J., et al. 2013, A&A, 558, A33.
- Bally et al. (2005) Bally, J. & Zinnecker, H. 2005, AJ, 129, 2281
- Bally et al. (2017) Bally, J., Ginsburg, A., Arce, H., et al. 2017, ApJ, 837, 60
- Bally et al. (2020) Bally, J., Ginsburg, A., Forbrich, J., et al. 2020, ApJ, 889, 178
- Foster et al. (2012) Foster, J. B., Stead, J. J., Benjamin, R. A., et al. 2012, ApJ, 751, 157
- Feldt et al. (2003) Feldt, M., Puga, E., Lenzen, R., et al. 2003, ApJL, 599, L91
- Gooch (1996) Gooch, R. 1996, Astronomical Data Analysis Software and Systems V, 101, 80
- Hampton et al. (2016) Hampton, E. J., Rowell, G., Hofmann, W., et al. 2016, Journal of High Energy Astrophysics, 11, 1
- Harvey et al. (1998) Harvey, P. M., & Forveille, T. 1988, A&A, 197, L19
- Hunter et al. (2008) Hunter, T. R., Brogan, C. L., Indebetouw, R., & Cyganowski, C. J. 2008, ApJ, 680, 1271
- Klaassen et al. (2005) Klaassen, P. D., Plume, R., Ouyed, R., et al. 2006, ApJ, 648, 1079
- McMullin et al. (2007) McMullin, J. P., Waters, B., Schiebel, D., Young, W., & Golap, K. 2007, Astronomical Data Analysis Software and Systems XVI, 376, 127
- Puga et al. (2006) Puga, E., Feldt, M., Alvarez, C., et al. 2006, ApJL, 641, 373
- Rivera-Ortiz et al. (2019) Rivera-Ortiz, P. R., Rodríguez-González, A., Hernández-Martínez, L., et al. 2019, ApJ, 885, 104
- Rodriguez et al. (2020) Rodríguez, L. F., Dzib, S. A., Zapata, L., et al. 2020, ApJ, 892, 82
- Sato et al. (2014) Sato, M., Wu, Y. W., Immer, K., et al. 2014, ApJ, 793, 72
- Schilke et al. (1997) Schilke, P., Walmsley, C. M., Pineau des Forets, G., et al. 1997, A&A, 321, 293
- Sollins et al. (2004) Sollins, P. K., Hunter, T. R., Battat, J., et al. 2004, ApJL, 616, L35
- Su et al. (2009) Su, Y.-N., Liu, S.-Y., Wang, K.-S., et al. 2009, ApJL, 704, L5
- Su et al. (2012) Su, Y.-N., Liu, S.-Y., Chen, H.-R., et al. 2012, ApJL, 744, L26
- Tammann et al. (1994) Tammann, G. A., Loeffler, W., & Schroeder, A. 1994, ApJS, 92, 487
- Wood et al. (1989) Wood, D. O. S., & Churchwell, E. 1989, ApJS, 69, 831
- Zapata et al. (2009) Zapata, L. A., Schmid-Burgk, J., Ho, P. T. P., et al. 2009, ApJ, 704, L45
- Zapata et al. (2013) Zapata, L. A., Schmid-Burgk, J., Pérez-Goytia, N., et al. 2013, ApJ, 765, L29
- Zapata et al. (2017) Zapata, L. A., Schmid-Burgk, J., Rodríguez, L. F., et al. 2017, ApJ, 836, 133
- Zapata et al. (2019) Zapata, L. A., Ho, P. T. P., Guzmán Ccolque, E., et al. 2019, MNRAS, 486, L15