Optimization of coupling and global collapse in diffusively coupled socio-ecological resource exploitation networks
Abstract
Single- and multi-layer complex networks have been proven as a powerful tool to study the dynamics within social, technological, or natural systems. An often observed common goal there is to optimize these systems for specific purposes by minimizing certain costs while maximizing a desired output. Acknowledging that especially real-world systems from the coupled socio-ecological realm are highly intertwined this work exemplifies that in such systems the optimization of a certain subsystem, e.g., to increase the resilience against external pressure in an ecological network, may unexpectedly diminish the stability of the whole coupled system. For this purpose we utilize an adaptation of a previously proposed conceptual bilayer network model composed of an ecological network of diffusively coupled resources co-evolving with a social network of interacting agents that harvest these resources and learn each other’s strategies depending on individual success. We derive an optimal coupling strength that prevents a collapse in as many resources as possible if one assumes that the agents’ strategies remain constant over time. However, we then show that if agents socially learn and adapt strategies according to their neighbors’ success, this optimal coupling strength is revealed to be a critical parameter above which the probability for a global collapse in terms of irreversibly depleted resources is high – an effect that we denote the tragedy of the optimizer. We thus find that measures which stabilize the dynamics within a certain part of a larger co-evolutionary system may unexpectedly cause the emergence of novel undesired globally stable states. Our results therefore underline the importance of holistic approaches for managing socio-ecological systems because stabilizing effects which focus on single subsystems may be counter-beneficial for the system as a whole.
I Introduction
Complex networks have been proven as a powerful framework to study the structure and dynamics in a broad range of real-world systems, ranging from social networks Dodds et al. 2003; Vosoughi et al. 2018; Stopczynski et al. 2014; Schleussner et al. 2016 to complex adaptive systems in socio-ecology Preise et al. 2018 and multilayer hierarchical structures in infrastucture Kivelä et al. 2014, economy Wiedermann et al. 2013 or even the climate system Donges et al. 2011; Feng et al. 2012. As such they are particularly useful to study meso- and macroscopic emergent phenomena arising from the microscopic interaction between dynamics at individual nodes, such as the stability of power grids Auer et al. 2016; Nishikawa and Motter 2015, survival and co-existence in resource networks or food-webs Dunne 2006; Pilosof et al. 2017; Knebel et al. 2013, or the synchronization in networks of coupled oscillators Arenas et al. 2008; Rodrigues et al. 2016; Rakshit et al. 2018; Maksimenko et al. 2016. Specifically, complex networks have also been utilized to analyze a broad range of social dynamics Castellano et al. 2009 and spreading processes De Domenico et al. 2016 that fostered the development of associated conceptual models with foci on complex contagion Dodds and Watts 2005; Guilbeault et al. 2018, opinion dynamics Watts and Dodds 2007; Klamser et al. 2017; Holme and Newman 2006 or epidemic spreading Castellano and Pastor-Satorras 2010; Pastor-Satorras et al. 2015; Gross et al. 2006.
Through a combination of techniques from social and ecological network models Wiedermann et al. 2015; Barfuss et al. 2017; Geier et al. 2019; Auer et al. 2016 complex networks have recently been proven as a promising approach to bridge theoretical physics and efforts to understand future trajectories of the Earth system in the Anthropocene Filatova et al. 2013; Donges et al. 2020; Schlueter et al. 2012, where human social dynamics have become a dominant geological process Steffen et al. 2018; Crutzen 2006. These so-called World-Earth models Strnad et al. 2019; Donges et al. 2018; Donges et al. 2020 have for example been used to study emergent characteristics of interactions between social networks of resource harvesting agents Barfuss et al. 2017; Geier et al. 2019; Wiedermann et al. 2015, impacts of multi-agent social learning and market dynamics on deforestation rates in rain forests Müller-Hansen et al. 2019, or the emergence of sudden regime shifts in socio-ecological systems driven by specific network characteristics Sugiarto et al. 2015; Sugiarto et al. 2017.
One commonly observed goal in managing such socio-ecological systems is their optimization for a specific purpose by minimizing certain costs and maximizing a desired output Schlüter et al. 2017; Young et al. 2006 even though such strategies may not necessarily yield desired long-term stable states Barfuss et al. 2018. Such optimization schemes include for example quota managements in cross-national fisheries Karagiannakos 1996 control programs to slow down or prevent the spread of harmful species Carrasco et al. 2012 or the most cost-effective choice of biodiversity conservation hotspots Myers et al. 2000. However, such strategies often focus primarily on understanding the underlying ecological system and its natural dynamics for establishing an optimal management while the dynamics in the social system and human behaviour that interacts with these systems is neglected or assumed static, thus, posing a key uncertainty in assessing the effectiveness of such measures Fulton et al. 2011; Schlüter et al. 2017.
Here we exemplify on this potential drawback and show that in a coupled socio-ecological system the optimization of the natural component alone may unexpectedly diminish the stability of the system as a whole and even may cause the existence of undesired stable fixed points corresponding to a global collapse. For this purpose we utilize a recently proposed conceptual socio-ecological bi-layer network model consisting of a social layer and an ecological layer Wiedermann et al. 2015; Barfuss et al. 2017; Geier et al. 2019. The ecological layer is comprised of a set of nodes that represent an abstract stock of a renewable resource Perman et al. 2003. Each node in the social layer interacts with exactly one of the stocks through different exploitation strategies. These strategies either yield high short-term gain at the cost of depletion or lower short-term gain for the sake of sustained long-term harvest as the stock approaches a positive stable fixed point Wiedermann et al. 2015. Nodes within the social network interact with each other by learning different strategies depending on the differences in their immediate harvesting payoffs. In a substantial addition to previous implementations of this model, we specifically acknowledge that resources do not evolve in isolation, but are often interacting via diffusive coupling, such as in migratory patterns of different mammals Okubo and Levin 2013, insects Dobzhansky and Wright 1943; Tufto et al. 2012 or fish Crittenden 1994; Radinger et al. 2017. Hence, we treat stocks in the ecological system as connected in a complex network and investigate the effect of diffusion strengths between nodes on the overall stability of the system, as such processes can give rise to rich dynamics ranging from increased synchronizability Motter et al. 2005 to the emergence of chaos Nakao and Mikhailov 2009.
Along the aforementioned lines of optimal resource management, we first derive an optimal coupling strength such that a minimum number of stocks reaches an undesired stable fixed point of almost or full depletion. We therefore assume that no interaction and learning in the social layer takes place, thus emulating the neglection of human behaviour in determining an optimal management strategy Fulton et al. 2011; Schlüter et al. 2017. We then show that under myopic social learning dynamics, where nodes aim to optimize their short term yield, this optimal coupling strength corresponds to a critical value above which a collapse of the entire socio-ecological system becomes likely, an effect that we denote here as the tragedy of the optimizer. Our findings imply that approaches for managing socio-ecological systems that focus on enhancing the stability in single subsystem may at the same time be counter-beneficial for the system as a whole. This calls for a further investigation of human behaviour and decision making in shaping trajectories and stability of coupled socio-ecological systems and, thus, conceptually underlines the importance of holistic approaches for determining appropriate management strategies.
The remainder of this paper is organized as follows. Section II presents the specifics of the model that is used in this work. We then present the corresponding results in Sec. III. Specifically, we first derive in Sec. III.1 an optimal coupling strength for the ecological network if no social interactions take place. Sec. III.2 studies the stability of our coupled socio-ecological model if there are social interactions and assesses the influence of interaction rates and diffusive coupling strength on the existence of desired and undesired equilibria. Ultimately, Section 6 demonstrates that the derived optimal coupling strength directly corresponds to a critical coupling strength above which the entire system is likely to collapse. We conclude our work in Sec. IV with a summary of the results and an outlook to future work.
II Model description
We model the interaction of a stylized social system with diffusely coupled individual resources by means of a bi-layer network . consists of a resource layer with nodes and edges and a social layer with nodes and edges. Nodes represent agents that interact with their own renewable (abstract) resource stocks at the corresponding nodes .
II.1 Node dynamics and diffusion
We first describe the node dynamics in the resource layer . Here, each node represents a time-dependent renewable stock whose dynamics are modeled by a logistic growth function with linear extraction, Perman 2009:
| (1) |
Here, is the growth rate, the capacity and the extraction or harvesting strategy. Equation 1 is commonly used to describe various real-world resource systems Perman et al. 2003 and has been applied previously in the context of investigating an adaptive social network co-evolving with dynamic node states Wiedermann et al. 2015, a multi-layer network setup describing a resource-user system with a governance layer Geier et al. 2019 and the effects of heterogeneous resource distributions Barfuss et al. 2017. Specifically, we assume the harvest of each node, given in the last term of Equation 1 by , to be linearly dependent on the available stock, a common assumption in the context of resource economics Perman et al. 2003 or socio-ecological systems modeling Lade et al. 2013; Cooke and Witten 1986. In contrast to the assumption of a constant harvest, this functional form accounts for the requirement that if the corresponding harvest vanishes as well, . It has additionally been shown that such linear extraction is the optimal harvesting strategy for resources with logistic growth Brown and Roughgarden 1995 and explicitly incorporates that success in harvesting is typically positively correlated with the amount of available resource Fryxell et al. 2010. We set the growth rate and the capacity for all stocks so that time and stocks are measured in dimensionless quantities. An individual effort is assigned to each node and, for the chosen parameters and , leads to two possible equilibrium states. For a high effort , all stocks converge to an empty state , implying depletion of the resource, whereas for a low effort all stocks converge to , preserving the resource while initially providing less harvest. We choose to set the high effort to and the low effort to so that maximizes the sustainable equilibrium harvest and both efforts are distributed symmetrically around .
As most entities in real-world ecological systems do not evolve in isolation, the individual renewable stocks are coupled through Laplacian diffusion along the links of the network. Hence, by using the Laplacian operator Fiedler 1989 and diffusion rates , the dynamics given by Eq. (1) change to:
| (2) |
Here, can be understood as the rate at which the stock is transferred into the neighboring stocks . are the elements of the Laplacian , given by , where is the degree matrix and is the adjacency matrix of stock network graph.
The introduction of diffusive coupling along the network structure alters the previously mentioned equilibrium stable states of (see above), an effect that we investigate in detail below in Sec. III.1.
II.2 Social learning of exploitation strategies
We now describe the dynamics within the social network layer where each node represents an agent exploiting its individual resource stock on the corresponding node in the resource layer (see above). The edges represent social ties between the nodes/agents, such as friendships or business partnerships.
In real-world social systems and economies, exploitation strategies rarely remain constant, but may be subject to either rational economic optimization Perman 2009 or, for instance, social learning depending on one’s own and other’s success Wiedermann et al. 2015; Barfuss et al. 2017; Traulsen et al. 2010. Here, we follow upon previous studies in modeling socio-ecological networks Wiedermann et al. 2015; Barfuss et al. 2017; Geier et al. 2019 and describe the temporal evolution of individual exploitation efforts through individual activation and social learning.
At first, each agent becomes active after an individual waiting time , drawn independently, with its probability density corresponding to an exponential distribution given by
| (3) |
This typical choice of waiting times in social systems Haight 1967 leads the average waiting time between two social updates of the same agent to be .
From there, the dynamics in the social system are calculated as follows:
- 1.
The system is integrated forward in time according to Eq. (2) until the minimum of all waiting times is reached.
- 2.
The corresponding agent with the effort randomly selects an agent with the effort from its neighborhood and compares the respective efforts.
- 3.
If the harvest difference is computed, corresponding to a comparison between the immediate success of the two employed exploitation efforts and . Agent then adopts the exploitation effort of agent with a probability given by the logistic function , a functional form that has been derived from experimental results Traulsen et al. 2010 and has been successfully employed in previous modelling implementations Barfuss et al. 2017; Wiedermann et al. 2015 that are similar to the one studied here.
- 4.
A new waiting time is drawn for agent and the model returns to step 1 above.
Once all agents have chosen either one of the two possible exploitation efforts, the model reaches a steady state at a time , since no further changes to individual efforts are possible, ending the iterations.
Note that, in contrast to aforementioned preceding works Wiedermann et al. 2015; Geier et al. 2019, the social network structure studied here is static and does not include adaptive rewiring. As identified previously Wiedermann et al. 2015, the social update time is an important parameter for the outcome of the system because it sets the relative time scale between the dynamics of the stocks and the social dynamics. In implementations without diffusive coupling the model converges to a state where all agents chose the high effort , at shorter social updates times, leading to a depletion of all stocks. In contrast, for longer social update times the model converges to a state where all agents chose the low effort , with the stocks converging to . In fact, highly harvested stocks are depleted by their exploiting agents behavior before their next social update. Thus the agents are not able to anticipate the consequences of their effort choices.
A schematic representation and summary of the model dynamics and related variables is shown in Fig. 1. One network layer corresponds to the social network and the other to the stock network . Both networks have an identical set of nodes as each agent in the social network harvests a single stock in the stock network while the edges differ. Over the course of this work, both networks are generated as Watts-Strogatz random networks Watts and Strogatz 1998 with nodes which is consistent with previous works Barfuss et al. 2017; Geier et al. 2019; Wiedermann et al. 2015. It has been checked that different network sizes do not qualitatively change the results of the model as long as is of appropriate size, i.e., (not shown). This observation also aligns with previous results from an analytical mean-field approximation of a similar model setup which showed that the model dynamics are expected to be independent of Wiedermann et al. 2015. For the stock network layer, we test the influence of both, average degree and the rewiring probability , on the expected outcome of the model. The social network layer is consistently set up with an average degree of and a rewiring probability of . All stocks start out at full capacity, so that .
III Results and discussion
We now investigate numerical simulations of the network dynamics described in the previous section. We therefore first study the case of an infinite social update time, meaning that no interactions take place between nodes in the social network regardless of their state and harvest. This allows us to gain an understanding of how the diffusive coupling of stocks in the resource layer affects its overall stability and fixed points. From there, we lower the social updates time to finite numbers in a range that has been studied in previous works Wiedermann et al. 2015; Barfuss et al. 2017; Geier et al. 2019. We ultimately show that the choice of a coupling strength that is optimal for the resource network without social updates leads to a critical transition in the whole coupled socio-ecological system once social interactions between agents in the social layer are explicitly accounted for.
III.1 Optimization of resource resilience with infinite social update time
Our first goal is to understand the effects of diffusive coupling on the stock network’s equilibrium states for a fixed number of stocks which are exploited with a low effort. We therefore set the social update , so that no social updates occur.
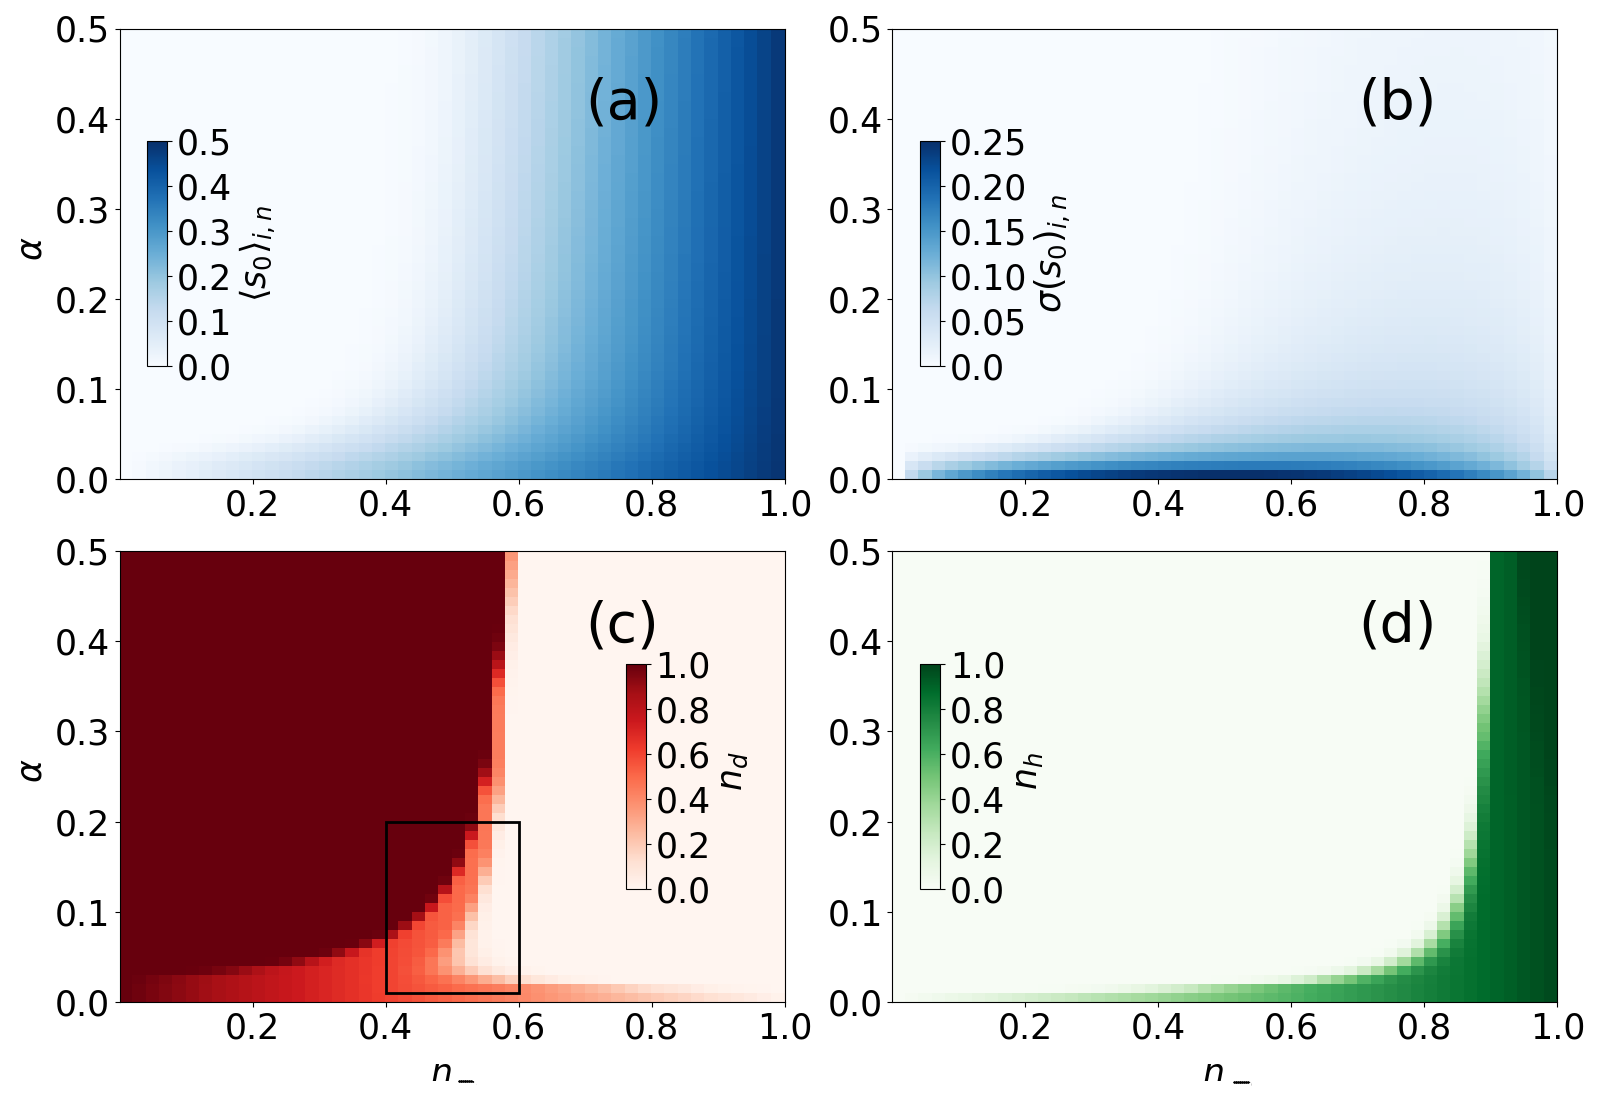
Numerical simulations are performed for different combinations of the coupling strength and the fraction of nodes exploited with low effort. The nodes that hold the effort are therefore randomly selected at each initialization of the simulation. Figure 2a shows the mean equilibrium stock averaged over an ensemble of simulations per set of parameters and as well as all nodes. An increase in the coupling strength until leads to a lower mean equilibrium stock, Fig. 2a. From there, a further increase in the seems to have only minor effects, Fig.2a. What we observe is the transition between two separate regimes: In the first regime, for , the evolution of resource stocks is mostly dominated by its intrinsic growth and harvest dynamics. With increasing coupling interactions between resources become stronger until for the resources are sufficiently mixed. They then exhibit dynamics similar to what one would expect from a single global stock simultaneously available to a all nodes. As such, the second limiting regime can be interpreted as a common pool resource which is a popular model of shared resources in socio-ecological systemsOstrom 2009; Tavoni et al. 2012. The exact value of (here ) at which this transition occurs (see Fig.2a) most likely depends on the various parameters of our model, such as the average degree , the levels of exploitation efforts as well as the underlying network topology. Since for the purpose of this work we mainly focus on the qualitative differences between the two observed regimes, a further in-depth quantitative analysis of the transition point remains as a subject of future research.
We also observe that the introduction of diffusive coupling substantially reduces the standard deviation of the equilibrium stock (Fig. 2b) for increasing . Hence, we conclude that diffusively coupling the stock network generally leads to a lower mean resource stock combined with a more homogeneous equilibrium stock distribution, facilitated by the flow of stock from nodes being exploited with low effort to nodes being exploited with high effort .
In other words, diffusively coupling the renewable stocks thus seems to be detrimental for the network as a whole. However, as described in Section 1, the stocks exploited with a high effort approach an empty state in an uncoupled network. They take a very long time to recover from that state even if the exploiting agent changes their exploitation strategy back to the low level . Through diffusive coupling stocks from neighbouring nodes exploited with low effort levels flow to highly exploited nodes (with effort level ) potentially saving them from depletion. In order to investigate such an effect, we define two categories of stocks according to their equilibrium value compared to the sustainable equilibrium stock value of . A stock is defined as irreversibly depleted if its equilibrium value is lower than of the sustainable equilibrium stock, meaning . Analogously, an equilibrium stock is defined as being in a healthy state if is higher than of the sustainable equilibrium stock, meaning . Additionally studying different percentages from – (–) for defining depleted (healthy) equilibrium stocks yielded no significant changes in the results for a range of (not shown).

Following the above definition, the fraction of depleted () and healthy stocks () is computed for varying choices of and , We find that continuously decreases with increasing , since any form of coupling leads to the outflow of stock towards nodes with lower stock levels, Fig 2d. Generally, we uncover that coupling slightly increases with increasing , Fig. 2c. However for parameter choices in the region and (black box in Figure 2c), we find a decrease in the number of depleted stocks which indicates that there seems to exist an optimal coupling coefficient that minimizes the fraction of depleted stocks , while only slightly decreasing the fraction of healthy stocks .
In order to estimate , we now compute the average fraction of depleted stocks over all fractions of nodes exploited with low effort. We find that shows a distinct minimum (Fig. 3a) and we define the optimal coupling coefficient to be the value of where is minimal. Computing for different choices of rewiring probability and average degree reveals that only substantially affects the numerical value of (results for are therefore not shown). The specific numerically obtained dependence between and shows that monotonically decreases with increasing , Fig.3b.
Thus, for the coupled stock network, there seems to be an optimal flow preserving the maximum possible number of stocks from depletion and appears to be inversely proportional to the average network degree . As the diffusive flow between the stocks determined by (giving the number of available diffusion pathways) and (giving the width of these pathways), there seems to be a universal optimal diffusive flow characteristic for the system given by a properly rescaled product of and . This relationship should be further investigated, possibly including varying network topologies. As will be discussed in the next section, the here obtained is a critical parameter in understanding the behaviour of the coupled socio-ecological system.
III.2 Effect of the diffusive flow with social learning
We now describe the behavior of the coupled socio-ecological network for varying social update times and coupling strengths . The fraction of nodes with low effort is initially set as and changes over time, since agents adapt their effort level through social learning. The nodes in the social network that hold the low (and consequently also the high) effort are randomly selected at the beginning of each simulation. The system is integrated forward until consensus is reached at a time , i.e. all agents employ one of the two efforts and therefore no further social updates take place. For each set of parameters we evaluate ensembles of numerical simulations, while we keep the network parameters and fixed for both the social and ecological network.
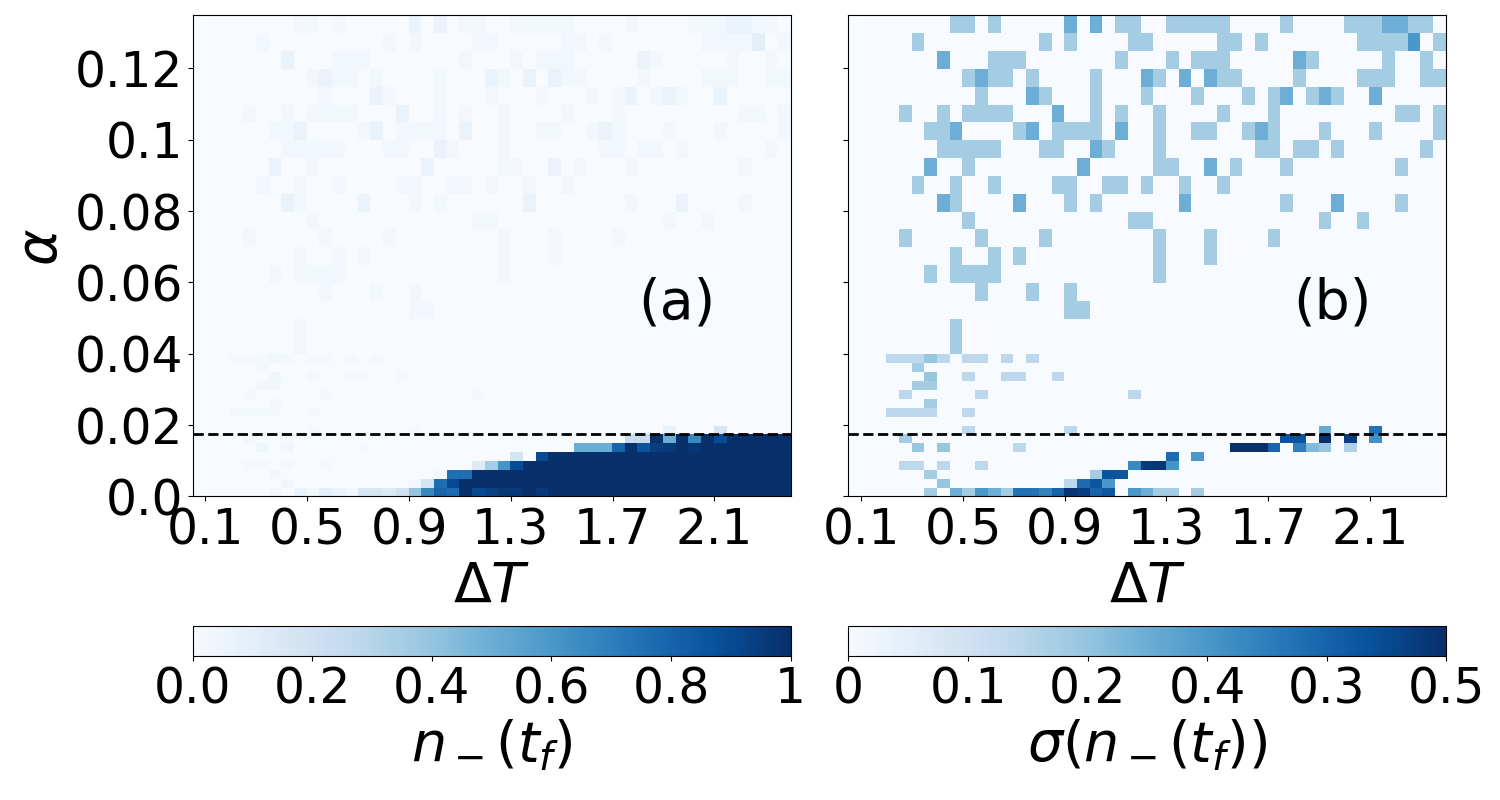
Without diffusive coupling (), a transition from all agents choosing a high effort to all agents choosing a low effort appears around a critical update time , Fig.4a , consistent with results from previous works Wiedermann et al. 2015. With increasing the critical update time increases until at a numerically estimated critical value of all agents choose a high effort independently of the social update time, Fig. 4a. Note that is close to the previously described optimal coupling strength , compare Fig. 3a and Fig. 4a. An intuitive explanation for the existence of this critical coupling strength is the following: Stronger diffusive coupling leads to a more homogeneous stock distribution (see again Fig. 2a and b), effectively protecting highly exploited stocks from complete depletion. As a consequence, all nodes carry similar amounts of stock whether exploited with low or high effort. Because the harvest depends on both, current effort level and the stock, this leads to a higher harvest for agents employing the high effort when compared to the harvest of agents using the low effort . This counteracts the effect of larger social update times which usually give advantage to agents with low effort as their stocks would in the long run approach larger values than those exploited with high effort if no coupling were to exist. This effect can already be observed at lower through the increase of the critical social update time above which the system approaches a long-term sustainable state, since all nodes employ the low effort (lower right corner in Fig. 4a). However, for the corresponding vanishes (or moves to values outside the considered parameter regime, i.e. ) and, hence, causing the high effort to be established along the entire network for all choices of , Fig. 4a. This nonlinear behavior related to the optimal coupling strength will be further investigated below in Sec. 6.
For , an increase in the corresponding standard deviation is observed around , Fig.4b, as is to be expected for systems close to a phase transition Hohenberg and Halperin 1977. Interestingly, for higher values of the standard deviation increases again, whereas the agents continue to preferentially choose a high effort, Fig. 4b. This effect can be explained from the fact that the probability for an agent to choose either effort depends on the difference between its own and neighbouring agents harvest, (see Sec. II.2). For larger , the highly exploited stocks tend to increase while the stocks exploited with low effort tend to decrease as compared to the case . This effect reduces the expected differences in harvest between agents employing high and low efforts with the high exploitation effort providing a slightly higher harvest. The probability for an agent with low effort to choose the high effort when comparing both harvests will thus almost, but not completely, be random and the system therefore shows a tendency to approach a state with all nodes employing the high effort (), but with increasing variance, i.e., increasing
It has been checked that a variation of the rewiring probability in the stock network does not have a substantial influence on the system’s behavior (not shown). In contrast, the average degree in the resource network alters the numerically estimated value of the critical coupling strength , an effect that we study in detail in the next section.
III.3 Optimized diffusive flow for the ecological subsystem leads to globally undesirable state

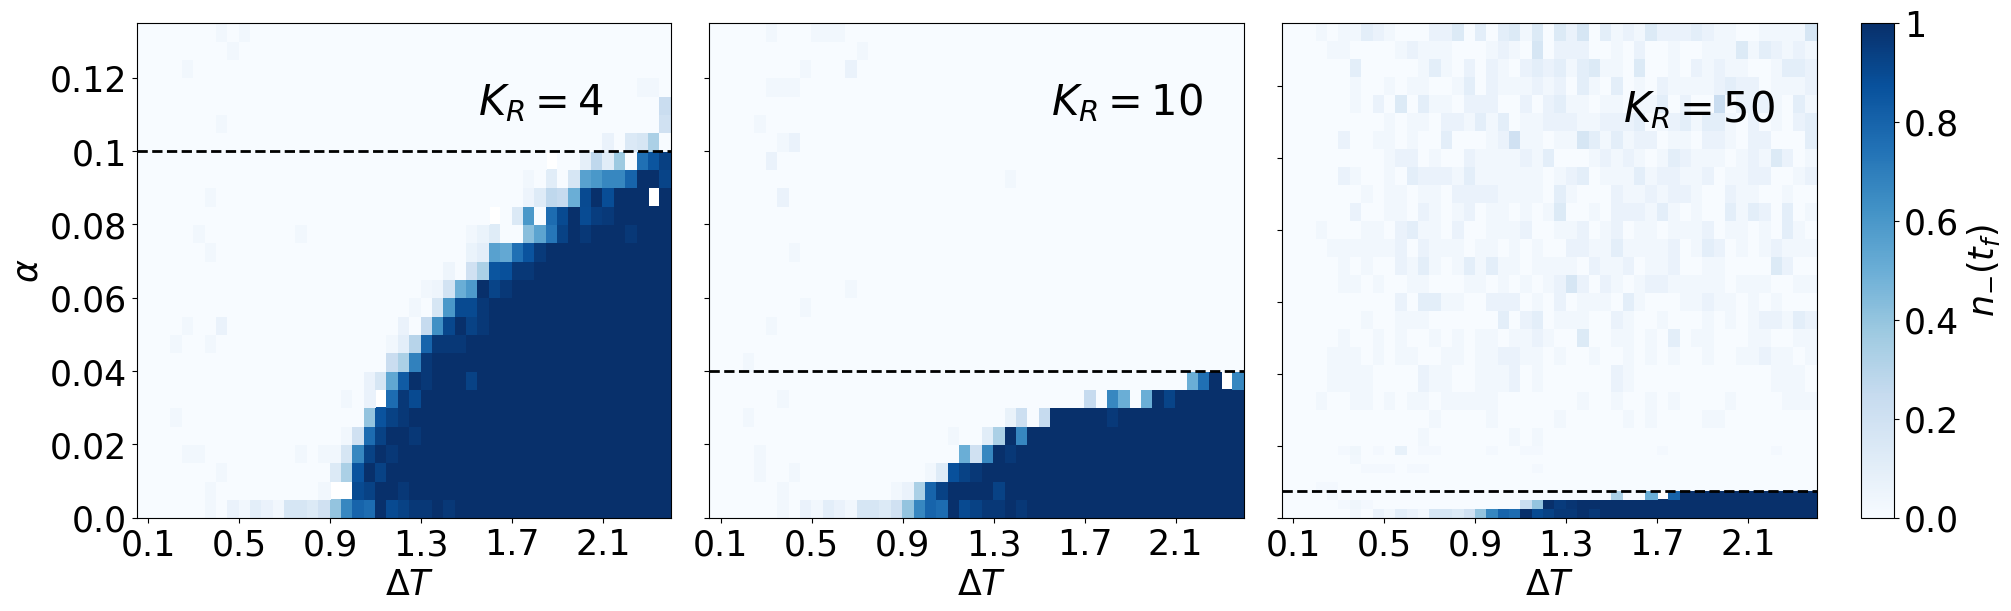
We now ultimately study how the critical coupling strength above which all agents choose a high effort for all considered social update times is related to the optimal coupling strength that we identified in Section III.1. Particularly, we previously found that for the (Fig. 4a), while the optimal coupling strength has been estimated at (Fig. 3), thus appearing to be comparatively close to .
To further investigate the relationship between and we vary , social update time and stock network average degree and compute again the fraction of agents employing a low effort at consensus over ensembles of simulations per set of parameters, Fig. 5. For each choice of the average degree , a different is numerically identified (horizontal lines Fig.5) and it appears that decreases with increasing stock network degree , Fig.5. We have additioanlly performed similar calculations for varying rewiring probabilities (not shown) and found that only the average degree has a significant influence on the critical coupling strength . We have made similar observations with respect to the sensitivity of the results on and when estimating (see above).
In particular, we find that and display a linear dependency with for varying values of , Fig. 6. As shown in Sec. III.1 above, corresponds to a value at which the stocks exploited with high effort are best protected against depletion, thus optimizing the stocks’ resilience against over-exploitation. However, this coincides with at or above which all agents in the social network layer choose a high effort. This leads to a critical state for the coupled socio-ecological system as a whole by causing all stocks to ultimately collapse and approach their undesired fixed point , an effect that we denote here as the tragedy of the optimizer.
This observed paradox or tragedy, i.e., a coupling strength that is optimal for the resource network leads to a likely collapse of the entire coupled socio-ecological system, has an intuitive explanation. Recall again that the optimal coupling coefficient was chosen to provide the largest possible protection against depletion of stocks which are exploited with high effort through a diffusive inflow of stocks which are exploited with low effort . This implies an advantage for agents employing , since their over-exploitation of stocks is compensated by the inflow of stocks from nodes harvested with . Further increasing amplifies this advantage and causes stocks that are exploited with and to become more similar. At the same time the harvests of nodes with are therefore expected to exceed those of nodes with . Hence, for all values of the system is expected to converge to a state where all agents hold once consensus is reached regardless the choice of the social update time , Fig. 4a and Fig 5. This then also implies that this previously detected corresponds to the identified in the previous section.
IV conclusion & outlook
Following up on previous studies of co-evolving socio-ecological networks with dynamic node states Wiedermann et al. 2015; Barfuss et al. 2017; Geier et al. 2019 we have introduced here a bi-layer network model that describes the interplay between a network of diffusively coupled resource stocks and a social network of agents updating their exploitation behaviors according to differences in harvest or payoff.
We have first studied an implementation of the model with infinite social update time and from there it has been possible to define and explain the existence of an optimal coupling coefficient . At this coupling coefficient the diffusive flow between the individual stocks in the network is optimized so that highly exploited stocks are best protected against complete depletion through the inflow from moderately exploited stocks.
From there, we have studied the cases of finite social update times, meaning that interactions do not only take place along diffusive pathways in the resource network, but also along social ties in the corresponding network of interacting agents. We have observed that for lower coupling coefficients the system undergoes a transition from a state where most agents choose a high exploitation effort to one where most agents prefer a low exploitation effort. The precise location of that transition varies with increasing social update times, a finding that is also in accordance with previous modelling results Wiedermann et al. 2015. We have additionally estimated a critical coupling coefficient above which all agents prefer a high exploitation effort independently of the social update time. Ultimately we have found a second phase transition for comparatively large coupling coefficients at which the second moment of the system’s equilibrium state shows a sudden increase. This transition is explained from the fact that agents choose either a high or a low effort at similar probabilities with only a slight preference for the high exploitation effort.
The comparison between and has revealed that they are very similar across various choices of the average degree in the resource network, thus leading to what we denote a tragedy of the optimizer. This tragedy implies that a coupling coefficient which appears to be optimal for the stock network on its own leads to a critical, hence undesired, transition in the coupled socio-ecological system as a whole. This effect shows that a measure which can stabilize the dynamics within a certain part of a larger co-evolutionary system may unexpectedly cause the emergence of new undesired globally stable states. This observation conceptually underlines the importance of a comprehensive approach for managing socio-ecological systems, since stabilizing effects that focus on a single sub-system may be detrimental for the system as a whole.
The proposed model can be cautiously applied to a broader real-world context. In that sense, the here studied stock network could be considered to represent diffusively linked renewable natural resources, such as fish in a network of lakes and rivers. Agents with a high exploitation effort represent unsustainably acting individuals or communities, while agents with a low exploitation effort preserving natural resources long-term represent sustainably acting ones. Natural resources can be more resilient against over-exploitation when they are connected Perkins 2019; Lundberg and Moberg 2003, and therefore protected, by healthy ecosystems around them, as is shown by the existence of an optimal coupling strength. The unsustainable harvesting of a natural resource at one location may then not be immediately experienced by other individuals that are managing this resource because surrounding ecological systems can to some degree compensate effects of over-exploitation through additional inflow. Unsustainable harvesting thus appears more attractive to shortsighted agents exploiting highly connected systems of ecological resources, which in its most extreme form of a common pool resource can lead to a tragedy of the commons Hardin 1968; Ostrom 1990. As a consequence agents will tend to adopt harvesting strategies that (in the long-run) cannot be compensated by the increased resilience of the natural resource which ultimately increases the likelihood to overstretch planetary boundaries Rockström et al. 2009 through over-exploitation.
The described tragedy of the optimizer raises challenging questions for future research. It should be investigated whether such a tragedy can also be observed in other types of coupled socio-ecological systems, such as systems with more than two network layers, including, e.g, a form of external management such as a governance layer Geier et al. 2019. In addition the analysis should be broadened to also include other network topologies, such as scale-free or small-world networks or even real-world ecological networks, like river or lake ecosystems. Such an analysis could elucidate a different type of potential management strategies in such socio-ecological system, e.g., the creation of new connections between nodes in the resource networks, as is already done in other areas of study, such as power grid networks Schultz et al. 2014. Another approach for expanding the model would be to allow the harvesting agents to move from one resource to another, which has been shown to be a promising candidate to improve cooperation and, hence, potentially the convergence into a sustainable state Nag Chowdhury et al. 2020.
Future work should also aim to cautiously compare the obtained model results to data from real-world phenomena where human intervention aiming to optimize the resilience of a natural resource failed and possibly led to adverse effects that could be linked to short-sighted optimization Berkes 2010.
Acknowledgements.
This work was developed in the context of the COPAN collaboration at the Potsdam Institute for Climate Impact Research (PIK).T.H. was supported by the German Research Foundation (DFG) (MU4430/2-1). M.W. is supported by the Leibniz Association (project DOMINOES).J.K. was supported by the Russian Ministry of Science and Education Agreement No. 075-15-2020-808. The authors gratefully acknowledge the European Regional Development Fund (ERDF), the German Federal Ministry of Education and Research and the Land Brandenburg for providing resources on the high-performance computer system at PIK.References
- Dodds et al. (2003) P. S. Dodds, R. Muhamad, and D. J. Watts, An experimental study of search in global social networks, science 301, 827 (2003).
- Vosoughi et al. (2018) S. Vosoughi, D. Roy, and S. Aral, The spread of true and false news online, Science 359, 1146 (2018).
- Stopczynski et al. (2014) A. Stopczynski, V. Sekara, P. Sapiezynski, A. Cuttone, M. M. Madsen, J. E. Larsen, and S. Lehmann, Measuring large-scale social networks with high resolution, PloS one 9, e95978 (2014).
- Schleussner et al. (2016) C.-F. Schleussner, J. F. Donges, D. A. Engemann, and A. Levermann, Clustered marginalization of minorities during social transitions induced by co-evolution of behaviour and network structure, Scientific reports 6, 30790 (2016).
- Preise et al. (2018) R. Preise, R. Biggs, A. De Vos, and C. Folke, Social-ecological systems as complex adaptive systems: organizing principles for advancing research methods and approaches (Resilience Alliance, 2018).
- Kivelä et al. (2014) M. Kivelä, A. Arenas, M. Barthelemy, J. P. Gleeson, Y. Moreno, and M. A. Porter, Multilayer networks, Journal of complex networks 2, 203 (2014).
- Wiedermann et al. (2013) M. Wiedermann, J. F. Donges, J. Heitzig, and J. Kurths, Node-weighted interacting network measures improve the representation of real-world complex systems, EPL (Europhysics Letters) 102, 28007 (2013).
- Donges et al. (2011) J. F. Donges, H. C. Schultz, N. Marwan, Y. Zou, and J. Kurths, Investigating the topology of interacting networks, The European Physical Journal B 84, 635 (2011).
- Feng et al. (2012) A. Feng, Z. Gong, Q. Wang, and G. Feng, Three-dimensional air–sea interactions investigated with bilayer networks, Theoretical and Applied Climatology 109, 635 (2012).
- Auer et al. (2016) S. Auer, K. Kleis, P. Schultz, J. Kurths, and F. Hellmann, The impact of model detail on power grid resilience measures, The European Physical Journal Special Topics 225, 609 (2016).
- Nishikawa and Motter (2015) T. Nishikawa and A. E. Motter, Comparative analysis of existing models for power-grid synchronization, New Journal of Physics 17, 015012 (2015).
- Dunne (2006) J. A. Dunne, The network structure of food webs, Ecological networks: linking structure to dynamics in food webs , 27 (2006).
- Pilosof et al. (2017) S. Pilosof, M. A. Porter, M. Pascual, and S. Kéfi, The multilayer nature of ecological networks, Nature Ecology & Evolution 1, 1 (2017).
- Knebel et al. (2013) J. Knebel, T. Krüger, M. F. Weber, and E. Frey, Coexistence and survival in conservative lotka-volterra networks, Physical review letters 110, 168106 (2013).
- Arenas et al. (2008) A. Arenas, A. Díaz-Guilera, J. Kurths, Y. Moreno, and C. Zhou, Synchronization in complex networks, Physics reports 469, 93 (2008).
- Rodrigues et al. (2016) F. A. Rodrigues, T. K. D. Peron, P. Ji, and J. Kurths, The kuramoto model in complex networks, Physics Reports 610, 1 (2016).
- Rakshit et al. (2018) S. Rakshit, B. K. Bera, D. Ghosh, and S. Sinha, Emergence of synchronization and regularity in firing patterns in time-varying neural hypernetworks, Physical Review E 97, 052304 (2018).
- Maksimenko et al. (2016) V. A. Maksimenko, V. V. Makarov, B. K. Bera, D. Ghosh, S. K. Dana, M. V. Goremyko, N. S. Frolov, A. A. Koronovskii, and A. E. Hramov, Excitation and suppression of chimera states by multiplexing, Physical Review E 94, 052205 (2016).
- Castellano et al. (2009) C. Castellano, S. Fortunato, and V. Loreto, Statistical physics of social dynamics, Reviews of modern physics 81, 591 (2009).
- De Domenico et al. (2016) M. De Domenico, C. Granell, M. A. Porter, and A. Arenas, The physics of spreading processes in multilayer networks, Nature Physics 12, 901 (2016).
- Dodds and Watts (2005) P. Dodds and D. Watts, A generalized model of social and biological contagion, Journal of Theoretical Biology 232, 587 (2005), number: 4.
- Guilbeault et al. (2018) D. Guilbeault, J. Becker, and D. Centola, Complex Contagions: A Decade in Review, in Complex Spreading Phenomena in Social Systems: Influence and Contagion in Real-World Social Networks, Computational Social Sciences, edited by S. Lehmann and Y.-Y. Ahn (Springer International Publishing, Cham, 2018) pp. 3–25.
- Watts and Dodds (2007) D. J. Watts and P. S. Dodds, Influentials, Networks, and Public Opinion Formation, Journal of Consumer Research 34, 441 (2007), number: 4.
- Klamser et al. (2017) P. P. Klamser, M. Wiedermann, J. F. Donges, and R. V. Donner, Zealotry effects on opinion dynamics in the adaptive voter model, Physical Review E 96, 052315 (2017).
- Holme and Newman (2006) P. Holme and M. E. J. Newman, Nonequilibrium phase transition in the coevolution of networks and opinions, Physical Review E 74, 056108 (2006), number: 5.
- Castellano and Pastor-Satorras (2010) C. Castellano and R. Pastor-Satorras, Thresholds for epidemic spreading in networks, Physical review letters 105, 218701 (2010).
- Pastor-Satorras et al. (2015) R. Pastor-Satorras, C. Castellano, P. Van Mieghem, and A. Vespignani, Epidemic processes in complex networks, Reviews of modern physics 87, 925 (2015).
- Gross et al. (2006) T. Gross, C. J. D. D’Lima, and B. Blasius, Epidemic dynamics on an adaptive network, Physical review letters 96, 208701 (2006).
- Wiedermann et al. (2015) M. Wiedermann, J. F. Donges, J. Heitzig, W. Lucht, and J. Kurths, Macroscopic description of complex adaptive networks coevolving with dynamic node states, Physical Review E 91, 052801 (2015).
- Barfuss et al. (2017) W. Barfuss, J. F. Donges, M. Wiedermann, and W. Lucht, Sustainable use of renewable resources in a stylized social–ecological network model under heterogeneous resource distribution, Earth System Dynamics 8, 255 (2017), number: 2.
- Geier et al. (2019) F. Geier, W. Barfuss, M. Wiedermann, J. Kurths, and J. F. Donges, The physics of governance networks: critical transitions in contagion dynamics on multilayer adaptive networks with application to the sustainable use of renewable resources, The European Physical Journal Special Topics 228, 2357 (2019).
- Filatova et al. (2013) T. Filatova, P. H. Verburg, D. C. Parker, and C. A. Stannard, Spatial agent-based models for socio-ecological systems: challenges and prospects, Environmental modelling & software 45, 1 (2013).
- Donges et al. (2020) J. F. Donges, J. Heitzig, W. Barfuss, M. Wiedermann, J. A. Kassel, T. Kittel, J. J. Kolb, T. Kolster, F. Müller-Hansen, I. M. Otto, et al., Earth system modeling with endogenous and dynamic human societies: the copan: Core open world–earth modeling framework, Earth System Dynamics 11, 395 (2020).
- Schlueter et al. (2012) M. Schlueter, R. R. Mcallister, R. Arlinghaus, N. Bunnefeld, K. Eisenack, F. Hoelker, E. J. MILNER-GULLAND, B. Müller, E. Nicholson, M. Quaas, et al., New horizons for managing the environment: A review of coupled social-ecological systems modeling, Natural Resource Modeling 25, 219 (2012).
- Steffen et al. (2018) W. Steffen, J. Rockström, K. Richardson, T. M. Lenton, C. Folke, D. Liverman, C. P. Summerhayes, A. D. Barnosky, S. E. Cornell, M. Crucifix, et al., Trajectories of the earth system in the anthropocene, Proceedings of the National Academy of Sciences 115, 8252 (2018).
- Crutzen (2006) P. J. Crutzen, The “anthropocene”, in Earth system science in the anthropocene (Springer, 2006) pp. 13–18.
- Strnad et al. (2019) F. M. Strnad, W. Barfuss, J. F. Donges, and J. Heitzig, Deep reinforcement learning in world-earth system models to discover sustainable management strategies, Chaos: An Interdisciplinary Journal of Nonlinear Science 29, 123122 (2019).
- Donges et al. (2018) J. F. Donges, W. Lucht, J. Heitzig, W. Barfuss, S. E. Cornell, S. J. Lade, and M. Schlüter, Taxonomies for structuring models for world-earth system analysis of the anthropocene: Subsystems, their interactions and social-ecological feedback loops, Earth System Dynamics Discussions 2018, 1 (2018).
- Müller-Hansen et al. (2019) F. Müller-Hansen, J. Heitzig, J. F. Donges, M. F. Cardoso, E. L. Dalla-Nora, P. Andrade, J. Kurths, and K. Thonicke, Can intensification of cattle ranching reduce deforestation in the amazon? insights from an agent-based social-ecological model, Ecological Economics 159, 198 (2019).
- Sugiarto et al. (2015) H. S. Sugiarto, N. N. Chung, C. H. Lai, and L. Y. Chew, Socioecological regime shifts in the setting of complex social interactions, Physical Review E 91, 062804 (2015).
- Sugiarto et al. (2017) H. Sugiarto, N. Chung, C. Lai, and L. Chew, Emergence of cooperation in a coupled socio-ecological system through a direct or an indirect social control mechanism, Journal of Physics Communications 1, 055019 (2017).
- Schlüter et al. (2017) M. Schlüter, A. Baeza, G. Dressler, K. Frank, J. Groeneveld, W. Jager, M. A. Janssen, R. R. McAllister, B. Müller, K. Orach, et al., A framework for mapping and comparing behavioural theories in models of social-ecological systems, Ecological Economics 131, 21 (2017).
- Young et al. (2006) O. R. Young, F. Berkhout, G. C. Gallopin, M. A. Janssen, E. Ostrom, and S. Van der Leeuw, The globalization of socio-ecological systems: an agenda for scientific research, Global Environmental Change 16, 304 (2006).
- Barfuss et al. (2018) W. Barfuss, J. F. Donges, S. J. Lade, and J. Kurths, When optimization for governing human-environment tipping elements is neither sustainable nor safe, Nature communications 9, 1 (2018).
- Karagiannakos (1996) A. Karagiannakos, Total allowable catch (tac) and quota management system in the european union, Marine Policy 20, 235 (1996).
- Carrasco et al. (2012) L. R. Carrasco, D. Cook, R. Baker, A. MacLeod, J. D. Knight, and J. D. Mumford, Towards the integration of spread and economic impacts of biological invasions in a landscape of learning and imitating agents, Ecological Economics 76, 95 (2012).
- Myers et al. (2000) N. Myers, R. A. Mittermeier, C. G. Mittermeier, G. A. Da Fonseca, and J. Kent, Biodiversity hotspots for conservation priorities, Nature 403, 853 (2000).
- Fulton et al. (2011) E. A. Fulton, A. D. Smith, D. C. Smith, and I. E. van Putten, Human behaviour: the key source of uncertainty in fisheries management, Fish and fisheries 12, 2 (2011).
- Perman et al. (2003) R. Perman, Y. Ma, J. McGilvray, and M. Common, Natural resource and environmental economics (Pearson Education, 2003).
- Okubo and Levin (2013) A. Okubo and S. A. Levin, Diffusion and ecological problems: modern perspectives, Vol. 14 (Springer Science & Business Media, 2013).
- Dobzhansky and Wright (1943) T. Dobzhansky and S. Wright, Genetics of natural populations. x. dispersion rates in drosophila pseudoobscura, Genetics 28, 304 (1943).
- Tufto et al. (2012) J. Tufto, R. Lande, T.-H. Ringsby, S. Engen, B.-E. Sæther, T. R. Walla, and P. J. DeVries, Estimating brownian motion dispersal rate, longevity and population density from spatially explicit mark–recapture data on tropical butterflies, Journal of Animal Ecology 81, 756 (2012).
- Crittenden (1994) R. N. Crittenden, A diffusion model for the downstream migration of sockeye salmon smolts, Ecological Modelling 71, 69 (1994).
- Radinger et al. (2017) J. Radinger, F. Hölker, and C. Wolter, Assessing how uncertainty and stochasticity affect the dispersal of fish in river networks, Ecological Modelling 359, 220 (2017).
- Motter et al. (2005) A. E. Motter, C. Zhou, and J. Kurths, Network synchronization, diffusion, and the paradox of heterogeneity, Physical Review E 71, 016116 (2005).
- Nakao and Mikhailov (2009) H. Nakao and A. S. Mikhailov, Diffusion-induced instability and chaos in random oscillator networks, Physical Review E 79, 036214 (2009).
- Perman (2009) R. Perman, ed., Natural resource and environmental economics, 3rd ed. (Pearson/Addison Wesley, Harlow, 2009) oCLC: 551817450.
- Lade et al. (2013) S. J. Lade, A. Tavoni, S. A. Levin, and M. Schlüter, Regime shifts in a social-ecological system, Theoretical ecology 6, 359 (2013).
- Cooke and Witten (1986) K. L. Cooke and M. Witten, One-dimensional linear and logistic harvesting models, Mathematical Modelling 7, 301 (1986).
- Brown and Roughgarden (1995) G. Brown and J. Roughgarden, An ecological economy: notes on harvest and growth, Biodiversity loss: Economic and ecological issues , 150 (1995).
- Fryxell et al. (2010) J. M. Fryxell, C. Packer, K. McCann, E. J. Solberg, and B.-E. Sæther, Resource management cycles and the sustainability of harvested wildlife populations, Science 328, 903 (2010).
- Fiedler (1989) M. Fiedler, Laplacian of graphs and algebraic connectivity, Banach Center Publications 25, 57 (1989).
- Traulsen et al. (2010) A. Traulsen, D. Semmann, R. D. Sommerfeld, H.-J. Krambeck, and M. Milinski, Human strategy updating in evolutionary games, Proceedings of the National Academy of Sciences 107, 2962 (2010).
- Haight (1967) F. A. Haight, Handbook of the Poisson distribution (Wiley, 1967).
- Watts and Strogatz (1998) D. J. Watts and S. H. Strogatz, Collective dynamics of ’small-world’ networks, Nature 393, 440 (1998).
- Ostrom (2009) E. Ostrom, A general framework for analyzing sustainability of social-ecological systems, Science 325, 419 (2009), https://science.sciencemag.org/content/325/5939/419.full.pdf .
- Tavoni et al. (2012) A. Tavoni, M. Schlüter, and S. Levin, The survival of the conformist: Social pressure and renewable resource management, Journal of Theoretical Biology 299, 152 (2012), evolution of Cooperation.
- Hohenberg and Halperin (1977) P. C. Hohenberg and B. I. Halperin, Theory of dynamic critical phenomena, Reviews of Modern Physics 49, 435 (1977).
- Perkins (2019) J. S. Perkins, ‘only connect’: Restoring resilience in the kalahari ecosystem, Journal of Environmental Management 249, 109420 (2019).
- Lundberg and Moberg (2003) J. Lundberg and F. Moberg, Mobile link organisms and ecosystem functioning: implications for ecosystem resilience and management, Ecosystems 6, 0087 (2003).
- Hardin (1968) G. Hardin, The tragedy of the commons, Science 162, 1243 (1968).
- Ostrom (1990) E. Ostrom, Governing the commons: The evolution of institutions for collective action (Cambridge university press, 1990).
- Rockström et al. (2009) J. Rockström, W. Steffen, K. Noone, Å. Persson, F. S. Chapin III, E. F. Lambin, T. M. Lenton, M. Scheffer, C. Folke, H. J. Schellnhuber, et al., A safe operating space for humanity, nature 461, 472 (2009).
- Schultz et al. (2014) P. Schultz, J. Heitzig, and J. Kurths, A random growth model for power grids and other spatially embedded infrastructure networks, The European Physical Journal Special Topics 223, 2593 (2014).
- Nag Chowdhury et al. (2020) S. Nag Chowdhury, S. Kundu, M. Duh, M. Perc, and D. Ghosh, Cooperation on interdependent networks by means of migration and stochastic imitation, Entropy 22, 485 (2020).
- Berkes (2010) F. Berkes, Shifting perspectives on resource management: resilience and the reconceptualization of ‘natural resources’ and ‘management’, Mast 9, 13 (2010).