Data Mining in Large Frequency Tables With Ontology, with an Application to the Vaccine Adverse Event Reporting System
Abstract
Vaccine safety is a concerning problem of the public, and many signal detecting methods have been developed to identify relative risks between vaccines and adverse events (AEs). Those methods usually focus on individual AEs, where the randomness of data is high. The results often turn out to be inaccurate and lack of clinical meaning. The AE ontology contains information about biological similarity of AEs. Based on this, we extend the concept of relative risks (RRs) to AE group level, which allows the possibility of more accurate and meaningful estimation by utilizing data from the whole group. In this paper, we propose the method zGPS.AO (Zero Inflated Gamma Poisson Shrinker with AE ontology) based on the zero inflated negative binomial distribution. This model has two purples: a regression model estimating group level RRs, and a empirical bayes framework to evaluate AE level RRs. The regression part can handle both excess zeros and over dispersion in the data, and the empirical method borrows information from both group level and AE level to reduce data noise and stabilize the AE level result. We have demonstrate the unbiaseness and low variance features of our model with simulated data, and obtained meaningful results coherent with previous studies on the VAERS (Vaccine Adverse Event Reporting System) database. The proposed methods are implemented in the R package zGPS.AO, which can be installed from the Comprehensive R Archive Network, CRAN. The results on VAERS data are visualized using the interactive web app Rshiny.
Keywords Vaccine adverse event VAERS Empirical Bayes Zero-inflated negative binomial distribution
1 Introduction
The Centers for Disease Control and Prevention (CDC) and the U.S. Food and Drug Administration (FDA) conduct post-licensure vaccine safety monitoring using the Vaccine Adverse Event Reporting System (VAERS) [1, 2]. VAERS accepts spontaneous reports of suspected vaccine adverse events after administration of any vaccine licensed in the United States from 1990 to present. As a national public health surveillance resource, VAERS is a key component in ensuring the safety of vaccines.
Numerous methods have been used to conduct safety studies with the VAERS database [3, 4, 5, 6, 7, 8, 9, 10, 11, 12, 13, 14, 15]. In these methods, a contingency table is generally created to display counts for all vaccine and adverse event pairs during a specified time period. In this table, each row represents a vaccine and each column represents an adverse event (AE). Each cell in the table contains the number of VAERS reports that mention both that vaccine and that event for a defined period. A statistical measure is then calculated to quantify the association between an adverse event and a vaccine. A large value of the measure shows a strong association, which might indicate a vaccine safety problem (called “signal”). A signal is considered evidence that an adverse event might be caused by vaccination and warrants further investigation or action. However, these methods frequently identify many AE signals and they are often hard to interpret in a biological context.
2 Method
2.1 Statistical Model
To mining for unusually frequent vaccine-AE combinations, we summarize VAERS reports into a large AE-vaccine contingency table of rows (vaccines) and columns (AEs) (see Table 1). The cell count is the total number of reports mentioned both vaccine and the AE in a specific time period, the column margin is the total number of reports mentioned the vaccine , the row margin is the total number of reports mentioned the AE and is the total number of reports in this time period.
| … | ||||
| … | ||||
| … | ||||
| … | … | … | … | … |
| … |
The strength of the vaccine-AE association is commonly expressed in terms of a ratio of the observed to the expected frequencies of report. Based on [3], the expected frequency for the vaccine-AE pair is defined as which is the frequency we would observe if vaccine and AE are independent. The relative reporting rate (RR) is defined as If RR for a vaccine-AE pair, then this pair occurred in the data 3.2 times more frequently than expected under the assumption of no association between the vaccine and the AE. In [3], is assumed to have a Poisson distribution, i.e., where is the parameter of interest for estimating RR, with a larger value indicating a stronger association between vaccine and AE .
[3] enhances the simple use of the separate Poisson model by allowing ”shrinkage” of similar ’s towards each other, thereby reducing the effect of sampling variation in the data. In this paper, we define similar AEs using the AE ontology in MedDRA (Medical Dictionary for Regulatory Activities) [reference] [16]. MedDRA describe AE relationships by a five level hierarchy. VAERS uses the second lowest term, “Preferred Terms” (PT), which is a distinct descriptor for a symptom, sign and disease. Related PTs are grouped into higher-level AE terms, including “High Level Group Terms” (HLGT) and “System Organ Classes” (SOC). By incorporating the AE ontology in modelling, we allow related AEs shrinking towards each other. Specifically, we assume that parameters in the same AE group are generated from a common gamma distribution. This common distribution allows information sharing between ’s in the same AE group. The gamma-Poisson mixture distribution is equivalent to a negative binomial distribution for . To accommodate excessive zero frequencies for vaccine-pairs in VAERS dataset, we consider a zero-inflated negative binomial distribution (ZINB) for modelling a group of AE counts. Under this modelling framework, we are able to mining safety signals for both the AE groups and individual AEs within the each group simultaneously.
2.2 Mining safety signal for AE groups
We model each AE group separately. Suppose an AE group include AE terms, and we assume that , (),
| (1) |
where is the proportion of zeros and denotes a negative binomial (NB) with the dispersion parameter and the mean . The dispersion parameter, is assumed to be the same for all vaccines, and is the mean of the NB distribution when , with a different value for each vaccine. Under this formulation, the RR of this AE group for vaccine is defined as
| (2) |
When is small (i.e., the AE group has a small percentage of zero counts) and is large (i.e., a large mean for the remaining NB distributed counts), is large. A large indicates a a higher risk of the AE group associated with vaccine .
2.3 Estimation of RR for each individual AE
Next, we use the Empirical Bayes approach to estimate RR of each individual AE in the vaccine group. In this approach, parameter estimates (,,) from the ZINB model are considered as prior information. The parameter of interest for estimating individual AE is . In this section, we drop the indices for vaccine to ease notation burden.
The NB distribution can be represented as a gamma-Poisson mixture distribution
Under the ZINB model, we generalize the Poisson distribution of by including such that
| (3) |
In this distribution, is degenerated at 0 when , which can be easily seen based on two mathematical conventions, and .
Under this formulation, can be parameterized a mixture of the degenerated random variable at 0 and a gamma distribution,
| (4) |
where and and are parameters in ZINB model as described in equation (1); is the Dirac delta function, denoting the p.m.f. of the degenerated random variable at 0 [17].
The posterior distribution of is also as a mixture distribution,
| (5) |
If , the posterior distribution of is a mixture of 0 and the gamma distribution. The mixing weight, is the posterior probability that is from the zero component of ZINB.
Finally, the posterior mean of is
| (6) |
This posterior mean is RR estimate of AE . With some algebra, we can see that this estimate is a weighted average of the sample mean, and the prior mean, ,
| (7) |
If , When goes to infinity, goes to 1. Here, reflects the amount of information in the data. When it is large, the weight of the sample mean is large and RR uses more information from the data. The derivation for is complex (details can be found in Appendix).
2.3.1 Estimate RR for an AE group and each AE within the group
Estimate parameters. To estimate the parameters , we apply a generalized linear regression (GLM) method, using the canonical log link function. This is done independently for each AE group. We use to denote observed counts in a specific AE group (of size ) associated with any vaccine. ( is a column vector of length ) The vector of expected mean of the count part for the ZINB distribution can be expressed as:
where is a binary design matrix indicating which vaccine each count is associated with. ( is a cross matrix, without the intercept column) Here is the vector of baseline frequencies with elements corresponding to elements in and . Under the log link, .
The vector of zero part probabilities is transformed with the logit function, and can be expressed as:
where the is a transformed version of with
The ZINB regression method can be implemented using the function zeroinfl from the pscl package in R [18]. The function will give us by the default Broyden–Fletcher–Goldfarb–Shanno algorithm, which is in essence an maximum likelihood estimation (MLE). Due to the functional invariance property of MLE, can be obtained by and . With in hand, we are able to obtain both group level and AE level RRs using equation 2 and 6 respectively.
Estimate significance. As we test associations for many pairs of vaccine and AE groups, we need to control for multiple comparisons. Adjustment methods, such as [19], can be used to control for the false discovery rate based on the p-values generated from these association tests. In this paper, we use the method in [20, 21] and use the () as the test statistics (the maximum is taking over all vaccines and all AE groups). By using this maximum statistics, the method is conservative in detecting multiple signals and controls the overall Type I error at a given level [20, 21].
The distribution of under the null ( no association between vaccines and AE groups) is not analytically tractable and is obtained using permutation test. However, the permutation test needs to account for the correlation between AEs mentioned on the same report. For this reason, we consider AEs observed on the same report as a single set and reshuffle the sets of AEs across reports in the permutation test. As a simple example with two reports, if one report mentioned one vaccine denoted by and three AEs, and the other report mentioned two vaccines, and and two AEs, and . By reshuffling the AE sets, AE set () is linked to vaccine ( ) and AE set () is linked to vaccine . By permuting sets of AEs, the correlation between AEs are reserved. For each permuted dataset, we compute a value of . By generating permuted datasets ( is generally large, say 5,000), we obtain an empirical null distribution of values (including the value from the observed dataset). Let denotes the rank of the observed in the null distribution, then the p-value is . A small p-value indicates a strong association between the vaccine and AE group. Using the null distribution of , we can obtain the p-values of the second largest, third largest , etc.
Similarly, we can obtain p-values of RR for all individual AEs, by using the maximum of (here, the maximum is taking over all vaccines and all AEs) as the test statistics.
3 Simulation
We conducted simulation studies for a specific AE group to investigate our method with regarding to the accuracy of estimating RR for each individual AE and the AE group. We generated 20, 50, 100, or 200 AE counts (group size) from ZINB for 3 vaccines. To make simulation studies more realistic, parameters for the three vaccines (, , and ) are sampled from the observed VAERS data. In order to simulate the four different numbers of AE count (group size), we sampled four sets of expected counts from the real data. RRs for the AE group are defined as in 2. In each simulation, we generated the RRs for all individual AEs (’s) based on 4, and cell counts (’s) based on 3.
The ’s and cell counts are generated for 1000 times, and ’s are recorded after each simulation. To evaluate the model performance, we consider two commonly metrics, the observed biases (difference of observed ’s and the true value) and the MSE (average value of observed biases). Observed biases near 0 and smaller MSEs imply better unbiasedness and accuracy of the model.
In the simulation studies, we also increased the expected counts (’s) by multiplying all ’s by 5 to see if larger ’s imply better accuracy in our model. Addtionally, we generated data from ZIP (no over-dispersion) by replacing by , and see if our ZINB can predict well with data having no over-dispersion.

Figure 1 shows that our method accurately estimate the RR for the AE group. an AE group of a larger size or increased expected counts had more accurate estimation of the . Simulation results also demonstrate that our method can deal with data from ZIP. ZINB reduces to ZIP for data without dispersion. The same metrics on can be used to evaluate the performance of zGPS.AO on AE level.
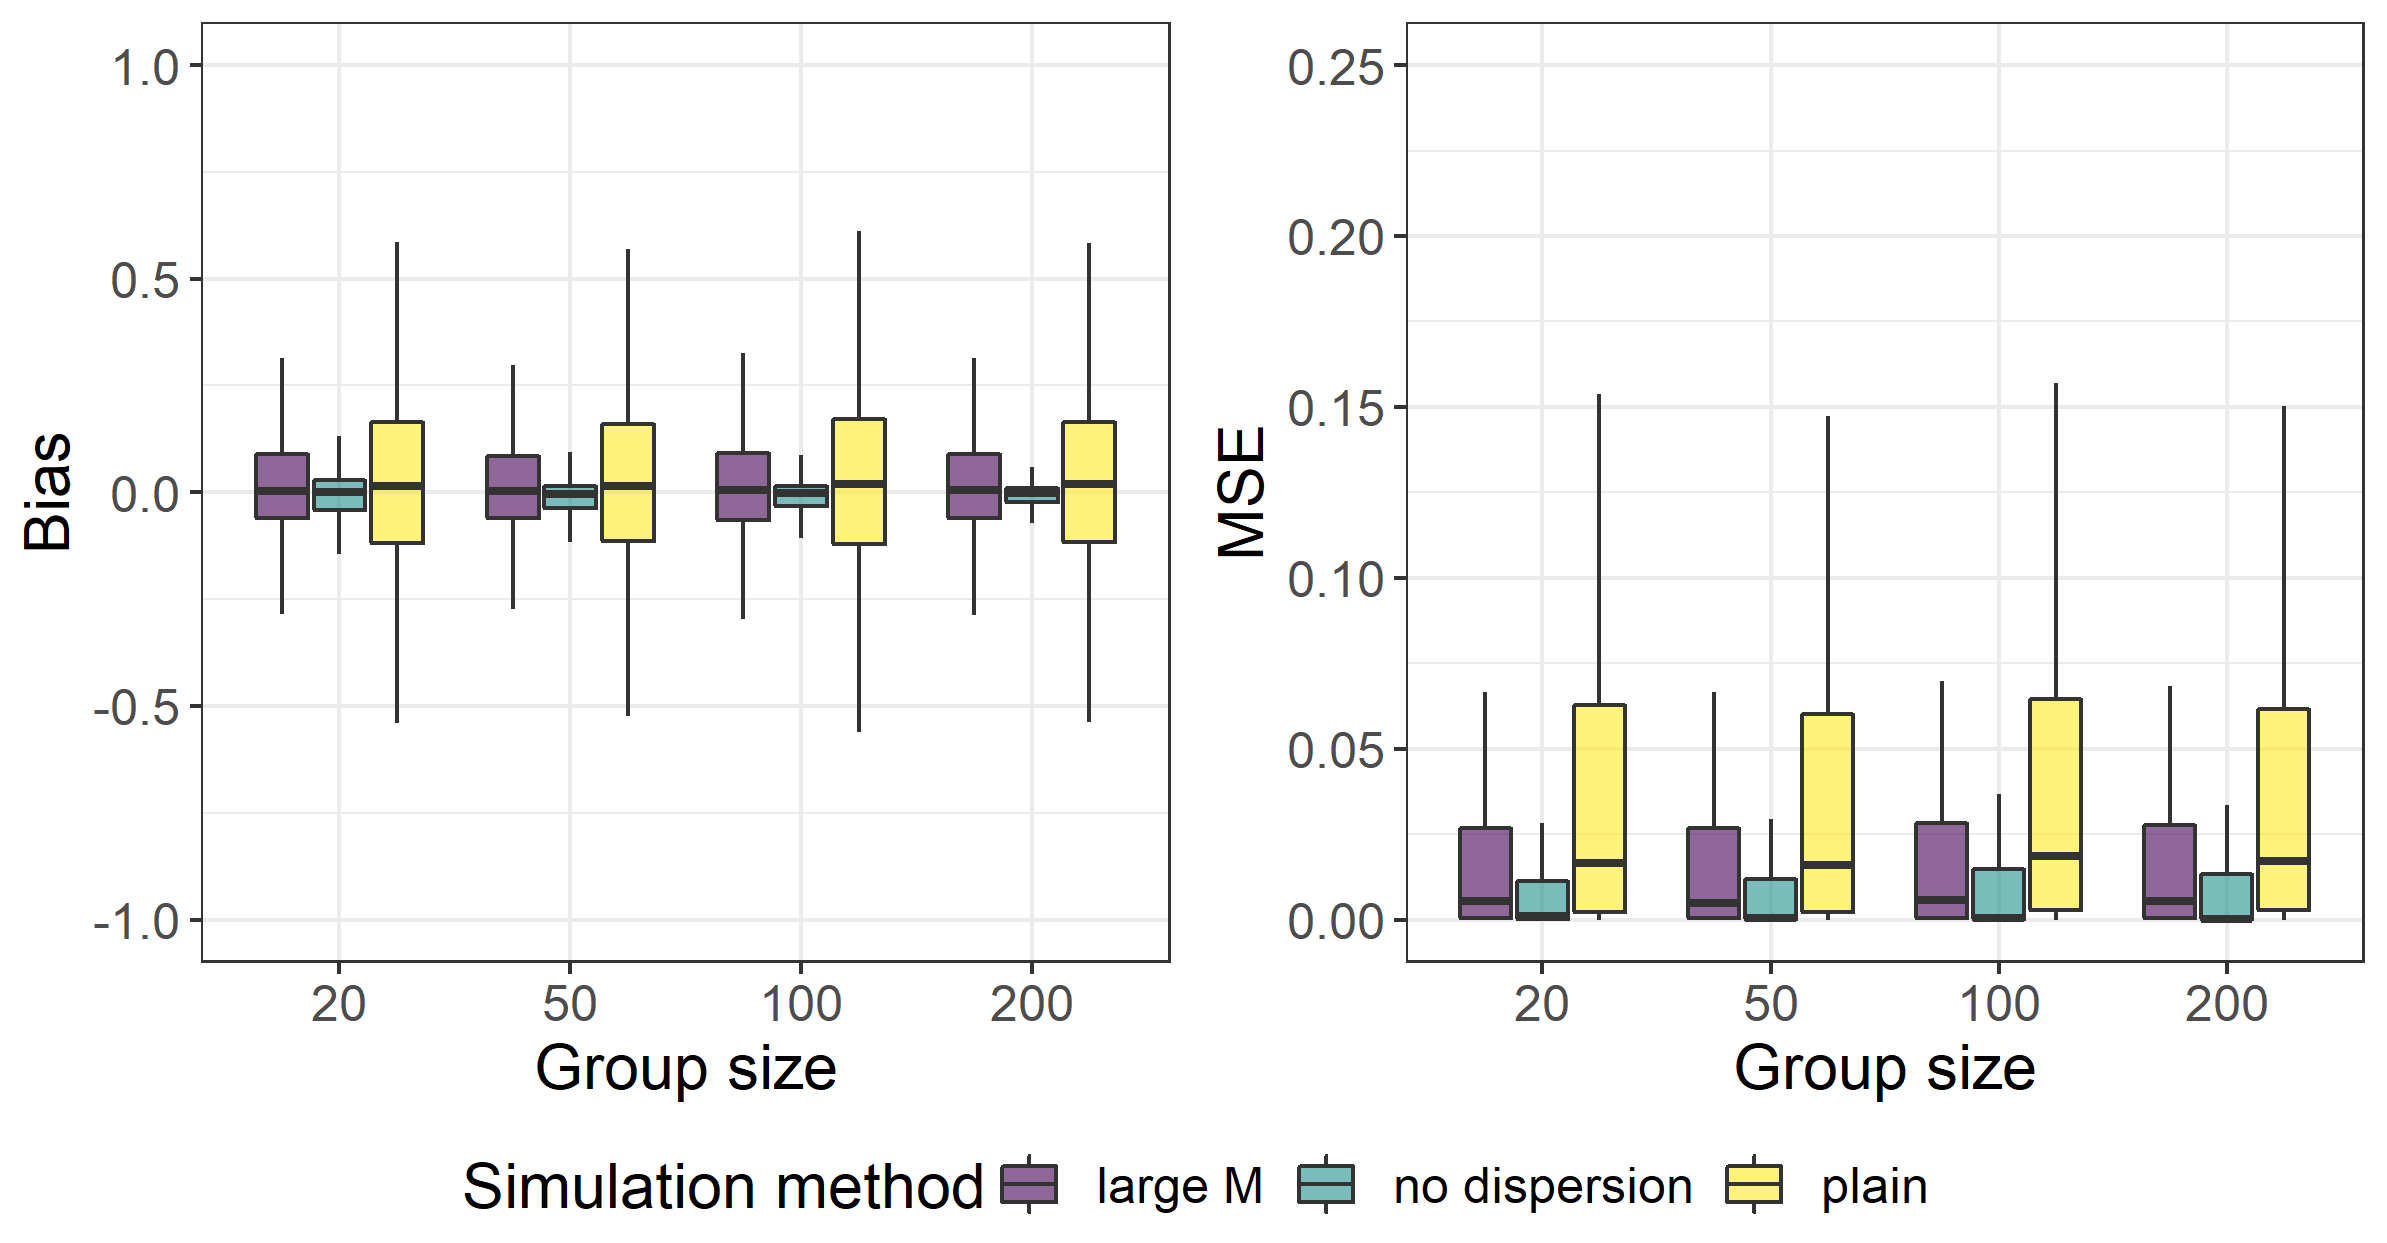
Figure 2 shows that the AE level RR estimation in zGPS.AO is also unbiased and accurate. On the AE level, zGPS.AO can also handel data with no dispersion well, and a larger group size increases the accuracy of . The AE level estimation has higher MSE than on the group level, reflecting that fact that we have less data on AE level than on group level.
Another finding is that, unlike what happens on group level, as the group size increases, the MSE of stays almost at the same level. Our best explanation to this interesting phenomena is as follow: The group level estimation is quite accurate even with a moderate group size, say 20, but the cell count of a particular AE-vaccine combination is always of large randomness. Therefore, since the borrows information from both sides, the variance of is mainly from the randomness in the particular cell count. An increasing group size only contributes to the group level accuracy, so it does not improve the accuracy of individual significantly.
4 Analysis of VAERS dataset
Process VAERS dataset. We used reports received from 2005 to 2018 and restricted the age of the vaccine recipients between 2 to 49. We investigated AEs for 10 types of vaccine of interest, including FLU (inactivated influenza vaccine; trivalent or quadrivalent), FLUN (live attenuated influenza; trivalent or quadrivalent), HEP(Hepatitis B vaccines), HEPA (Hepatitis A vaccines), HEPAB (Hepatitis A + Hepatitis B), HPV4 (human papillomavirus 4-valent vaccine), HPV9 (human papillomavirus 9-valent vaccine), MMR (measles, mumps and rubella virus vaccine, live), TDAP (tetanus toxoid, reduced diphtheria toxoid and acellular pertussis vaccine, adsorbed), and VARCEL (Varivax-Varicella Virus, live). Those vaccines were selected from 84 types of vaccine based on their high level of public attention and high report frequency in the dataset. We used the HLGT level of MedDRA to define AE groups. We filtered out spurious AEs by removing AEs with a frequency less than 20 and removing AE groups containing less than 15 AEs. The final dataset for analysis has a total of 169,538 reports and 1477 AEs, which are classified to 42 AE groups.
A traditional way to generate vaccine-AE pair data is to get all vaccine-AE combinations in each report, regardless of the number of vaccines on the report. If a report mentions both vaccine A and B, and an AE of fever, the current strategy creates two pairs of data: A-fever and B-fever. However, with the additional presence of vaccine B, the link might not exist between vaccine A and fever, and likewise for the link between vaccine B and fever. We used a simple strategy proposed in [22] to mitigate this problem. Specifically, we assign a weight to each vaccine-AE pair. If there is a single vaccine on the report, the weight is one. If there are multiple vaccines, we weight each vaccine-AE pair by the inverse of the number of vaccines mentioned in the report (i.e, ), assuming that the AE is linked to each vaccine with equal probability.
Under this method, the expected value of the vaccine-AE link is used as the weight. If a vaccine coexists with other vaccines in one report, the weight will be less than one, reflecting the uncertainty of the existence of the link, otherwise the weight will be one.
Results
We applied zGPS.AO to the final dataset to investigate AEs for the 10 types of vaccine of interest. Figure 3 shows the result of mining AE groups by zGPS.AO. By the heatmap, we found signals on two vaccines, FLUN and HEPAB. Compared to FLU, FLUN is more associated with respiratory related AE groups, and HEPAB is more risky compared to HEPA and HEP with the highlighted AE group Hepatobiliary investigations.

Influenza virus vaccine is designed to protect against influenza viruses that are most likely to spread and cause illness among people during the flu season. There are 116349 reports containing FLU and 17093 reports containing FLUN. We compared AE profiles of FLUN and FLU by defining a signaled AE group to have and . With this definition, Table 2 shows the 3 significant AE groups (all related to the respiratory system) associated with FLUN, while there are no significant AE groups associated with FLU. Relative to FLU, FLUN is associated with increased risk of the respiratory system. The signaled AE groups, Respiratory tract infections and Upper respiratory tract disorders have been reported before [23], and the individual AEs Rhinitis, Nasal congestion, Sinus disorder are also consistent with previous researches [24, 25, 26]. The newly detected AE group Respiratory tract signs and symptoms is interesting and deserves more clinical trial and validation in larger dataset.
| AE group | s (p value) | top 5 AE | |
|---|---|---|---|
| Respiratory tract infections | 4.56 (0.001) | Croup infectious | 9.52 |
| Influenza | 8.95 | ||
| Rhinitis | 6.41 | ||
| Pneumonia | 6.33 | ||
| Atypical pneumonia | 6.10 | ||
| Upper respiratory tract disorders (excl infections) | 4.26 (0.002) | Epistaxis | 8.44 |
| Nasal congestion | 7.10 | ||
| Nasal oedema | 6.19 | ||
| Paranasal sinus | 5.53 | ||
| Sinus disorder | 5.22 | ||
| Respiratory tract signs and symptoms | 3.26 (0.008) | Nasal discomfort | 9.24 |
| Rhinorrhoea | 7.29 | ||
| Sneezing | 6.48 | ||
| Sinus headache | 5.65 | ||
| Rhinalgia | 5.01 |
Another finding of this study is in identifying safety problems that are likely due to interactions of two vaccines when they are administered to an individual at the same time. Specifically, we compared AE profiles induced by the hepatitis A and B combination vaccine (“Twinrix” in VAERS) to monovalent hepatitis A and B vaccines (“Havrix” for hepatitisA and “Engerix-B” for hepatitis B in VAERS). Hepatitis Vaccines have appeared 22338, 16555, and 3545 times in the dataset with Havrix, Engerix-B, and Twinrix, respectively, and are widely used in young children and teenagers to prevent liver inflammation. With the same definition of a signaled group as in studying flu vaccines, zGPS.AO detects one signaled AE group, Hepatobiliary investigations (Shown in Table 3), highly associated with HEPAB, while there is no signaled AE group associated with HEPA and HEP. This finding implies an increasing side effect when Hepatitis A and B vaccines are combined, and needs more statistical and clinical justification.
| AE group | s (p value) | top 5 AE | |
|---|---|---|---|
| Hepatobiliary investigations | 4.76 (0.001) | Aspartate aminotransferase increased | 4.81 |
| Hepatic enzyme increased | 4.81 | ||
| Liver function test abnormal | 4.79 | ||
| Alanine aminotransferase increased | 4.78 | ||
| Bilirubin urine | 4.78 |
5 Discussion
In this article, we develop a method for detecting AE-vaccine associations. We assume a seperate Poisson model for each individual AE, and a ZINB model for a group of AEs. In this way, we incorporate the concept of RR, and extend it to the AE group level. The ZINB model allows our model to handle data with excess zero counts and over-dispersion. The Empirical Bayes framework has the special feature of borrowing information from both the group and the individual AE, which reduces the AE level noise and enhances the model performance. We have demonstrated the unbiasedness and low variance of our model on both AE and group levels. By applying zGPS.AO to VAERS data, we found that FLUN is associated higher risks compared to FLU, especially on AE groups related to the respiratory system, and the combination of hepatitis A and B vaccines may have higher side effects than monovalent hepatitis A or B vaccines.
References
- [1] F. Varricchio, J. Iskander, F. DeStefano, R. Ball, R. Pless, M. M. Braun, and R. T. Chen. Understanding vaccine safety information from the vaccine adverse event reporting system. Pediatr Infect Dis J., 23:287––294, 2004.
- [2] Tom T Shimabukuro, Michael Nguyen, David Martin, and Frank DeStefano. Safety monitoring in the vaccine adverse event reporting system (vaers). Vaccine, 33(36):4398–4405, 2015.
- [3] William DuMouchel. Bayesian data mining in large frequency tables, with an application to the fda spontaneous reporting system. The American Statistician, 53(3):177–190, 1999.
- [4] S. J. Evans, P. C. Waller, and S. Davis. Use of proportional reporting ratios (PRRs) for signal generation from spontaneous adverse drug reaction reports. Pharmacoepidemiology and Drug Safety, 10:483–486, 2001.
- [5] E. P. van Puijenbroek, A. Bate, H. G. Leufkens, M. Lindquist, R. Orre R, and A. C. Egberts. A comparison of measures of disproportionality for signal detection in spontaneous reporting systems for adverse drug reactions. Pharmacoepidemiology and Drug Safety, 11:3–10, 2002.
- [6] A. Bate, M. Lindquist, I. R. Edwards, S. Olsson, R. Orre, A. Lansner, and R. M. De Freitas. A Bayesian neural network method for adverse drug reaction signal generation. European Journal of Clinical Pharmacology, 54:315–321, 1998.
- [7] R. Orre A. Lansner, A. Bate, I. R. Edwards M. Lindquist, S. Olsson, R. Orre, A. Lansner, and R. M. De Freitas. Bayesian neural networks with confidence estimations applied to data mining. Comput Stat Data Anal, 34:473–493, 2000.
- [8] G. N. Nóren, A. Bate, R. Orre, and I. R. Edwards. Extending the methods used to screen the WHO drug safety database towards analysis of complex associations and improved accuracy for rare events. BCPNN, 25:3740–3757, 2006.
- [9] W. DuMouchel and D. Pregibon. Empirical bayes screening for multi-item associations. Proceedings of the Seventh ACM SIGKDD International Conference on Knowledge Discovery and Data Mining, San Francisco,CA, page 67–76, 2001.
- [10] A. Szarfman, S. G. Machado, and R. T. O’Neill. Use of screening algorithms and computer systems to efficiently signal higher-than-expected combinations of drugs and events in the us FDA’s spontaneous reports database. PLoS ONE, 25:381–392, 2002.
- [11] M. Kulldorff, R. L. Davis, M. Kolczak, E. Lewis, T. Lieu, and R. Platt. A maximized sequential probability ratio test for drug and vaccine safety surveillance. Sequential Analysis, 30:58–78, 2011.
- [12] R. L. Davis, M. Kolczak, E. Lewis, J. Nordin, M. Goodman, D. K. Shay, R. Platt, S. Black, H. Shinefield, and R. T Chen. Active surveillance of vaccine safety: a system to detect early signs of adverse events. Epidemiology, 16:336–341, 2005.
- [13] L. Li and M. Kulldorff. A conditional maximized sequential probability ratio test for pharmacovigilance. Statistics in Medicine, 29:284–295, 2009.
- [14] Rongxia Li, Brock Stewart, Eric Weintraub, , and Michael M. McNeil. Continuous sequential boundaries for vaccine safety surveillance. Statistics in Medicine, 33:3387–3397, 2014.
- [15] M Kulldorff, I. Dashevsky, T. R. Avery, K. A. Chan, R. L. Davis, D. Graham, R. Platt, S. E. Andrade, D. Boudreau, M. J. Gunter, L. J. Herrinton, P. Pawloski, M. A. Raebel, D. Roblin, and J. S. Brown. Drug safety data mining with a tree-based scan statistic. Pharmacoepidemiology and Drug Safety, 22:517–523, 2013.
- [16] P. Mozzicato. Meddra: an overview of the medical dictionary for regulatory activities. Pharm Med, 23:65––75, 2009.
- [17] André I. Khuri. Applications of dirac’s delta function in statistics. International Journal of Mathematical Education in Science and Technology, 35(2):185–195, 2004.
- [18] Achim Zeileis, Christian Kleiber, and Simon Jackman. Regression models for count data in r. Journal of Statistical Software, Articles, 27(8):1–25, 2008.
- [19] David Thissen, Lynne Steinberg, and Daniel Kuang. Quick and easy implementation of the benjamini-hochberg procedure for controlling the false positive rate in multiple comparisons. Journal of educational and behavioral statistics, 27(1):77–83, 2002.
- [20] Lan Huang, Jyoti Zalkikar, and Ram C. Tiwari. A likelihood ratio test based method for signal detection with application to fda’s drug safety data. Journal of the American Statistical Association, 106(496):1230–1241, 2011.
- [21] Yuxin Ding, Marianthi Markatou, and Robert Ball. An evaluation of statistical approaches to postmarketing surveillance. Statistics in Medicine, 39, 01 2020.
- [22] Lili Zhao, Sunghun Lee, Rongxia Li, Edison Ong, Yongqun He, and Gary Freed. Improvement in the analysis of vaccine adverse event reporting system database. Statistics in Biopharmaceutical Research, 12:1–14, 05 2020.
- [23] Shuoran Li and Lili Zhao. Adverse event enrichment tests using vaers. 07 2020.
- [24] Roger Baxtera, Abigail Eatona, John Hansena, Laurie Aukesa, Herve Caspardb, and Christopher S. Ambroseba. Safety of quadrivalent live attenuated influenza vaccinein subjects aged 2–49 years. Vaccine, 35:1254–1258, 2017.
- [25] Penina Haber, Pedro L. Moro, Maria Cano, Paige Lewis, Brock Stewart, and Tom T.Shimabukuro. Post-licensure surveillance of quadrivalent live attenuated influenza vaccine united states,vaccine adverse event reporting system(VAERS), july 2013–june 2014. Vaccine, 33:1987–1992, 2015.
- [26] Rob Lambkin-Williams, Colin Gelder, Richard Broughton, Corey P. Mallett, Anthony S. Gilbert, Alex Mann, David He, John S. Oxford, and David Burt. An intranasal proteosome-adjuvanted trivalent influenza vaccine is safe, immunogenic and efficacious in the human viral influenza challenge model. serum IgG and mucosal IgA are important correlates of protection against illness associated with infection. PLoS One, 11:e0163089, 2016.