Mean and Gaussian Curvature of Lipid Mesophases measured using molecular dynamicsJournal: Journal of LaTeX Templates
Abstract
The ability to measure the mean and Gaussian curvature in lipid mesophases is important in our understanding of their formation and properties, and can be achieved both experimentally and computationally. Here we present a method to measure curvature for any mesophase using Molecular Dynamics simulations. However the reliability of the results is highly dependent on the choice of fitting algorithm, the atoms within the lipid membrane that are selected for fitting and the number of atoms that are included in the fit. We compare the results of our method to the L mesophase as previously studied, and subsequently extend the method to the Q and HII mesophase, not previously studied in this way computationally, but whose curvatures are known both analytically and experimentally. By systematically comparing our results, we demonstrate a robust method which can be used in general to measure curvature.
Keywords:
Membrane curvature, molecular dynamics, lipid polymorphism1 Introduction
Membrane curvature is a fundamental property of membrane systems, and is known to play a role in membrane fusion, membrane protein activity, and lateral membrane organisation [1, 2, 3, 4, 5, 6, 7, 8]. The curvature of membranes arises from the global restraint of molecular composition, and is a key factor when considering the elasticity of membranes[9]. The mean (H) and Gaussian (K) curvatures of a surface are defined by the mean and product of the principal curvatures respectively. The Helfrich Hamiltonian, describing the energy density of membranes, is dependent on both measures, indicating that the dynamic behaviour - of both model and real membrane systems - is significantly influenced by the underlying geometry of the surface around which the lipid bilayer is formed[10].
Lipid mesophases may be characterised by their mean and Gaussian curvatures, from the flat planar lamellar (Lα, Figure 1d)), to the highly curved inverse hexagonal (HII, Figure 1f)), where cylindrical water channels are arranged in a hexagonal pattern. One of the most studied non-planar mesophases is the Diamond cubic phase (Q, Figure 1e)), based on triply periodic minimal surfaces, mathematical surfaces defined by zero mean curvature, and negative Gaussian curvature [11]. Lα mesophases have been extensively studied in silico for their physiological importance [12, 13, 14].
Experimentally in sufficiently large and simple systems, curvatures can be calculated directly, for example using microscopy or dynamic light scattering[15, 16]. For a spherical liposome, the principal curvatures are identical, and the curvature is simply the reciprocal of the radius experimentally measured. However, for mesophases with more complex topologies, such as the inverse bicontinuous cubic phases, curvatures are dependent on the dimensions of the unit cell[17].
Non-lamellar mesophases, on the other hand, have been the subject of fewer computational studies, especially in comparison to experimental studies where they have been studied extensively, particularly using small angle X-ray scattering techniques to investigate the nature of mesophase transitions[18, 19, 20, 21, 22]. However, in recent years, there has been increased interest in the simulation of non-lamellar lipid mesophases[23, 24, 25]. This has been driven by the need to understand their role in processes such as drug delivery, templating, and membrane protein crystallisation [26, 27, 28, 29, 30]. One less-studied computational aspect is the role of curvature in these processes. Yesylevskyy and Ramseyer 2014 developed a method to measure curvature from simulated mesophases based on methods from computer graphics, investigating its use on a planar lipid system containing varying quantities of cholesterol [31]. However, this method has not yet been applied to non-lamellar systems. As mentioned above, membrane curvature plays a significant role in membrane protein activity and function, with membrane proteins themselves having complex mechanisms with which to sense the curvature of the membrane in which they reside [32, 33, 34, 35, 36, 37, 38]. Moreover, the lipid composition of membranes themselves can both induce, and be sorted by curvature [39, 40, 7, 41]. Understanding the method of Yesylevskyy and Ramseyer 2014 in mesophases with non-trivial curvatures as we present here will therefore allow us to further our understanding of the effects that curvature has on intra-membrane organisation.
To examine these phenomena, here, we explore the method by evaluating its performance on three lipid mesophases. We firstly investigate how the method corroborates using different fitting methods, to ensure a high level of reproducibility. Further to that, we assess for the first time how the use and implementation of the method varies in different mesophases, measuring curvature with different system parameters. Of the mesophases used in this study, two have non-zero curvatures, the HII and the Q. The Q and the HII are formed spontaneously in water by monoolein (MO) and dioleoylphosphoethanolamine (DOPE) respectively. The third mesophase is the Lα mesophase, with both mean and Gaussian curvatures equal to zero, formed by dipalmitoylphosphatidylcholine (DPPC) (Figure 1a)). Coarse grained figures of the three molecules and the mesophases they form in water are shown in Figure 1.
2 Methods
2.1 Simulation details
|
|
|
|
| ||||||||||
|---|---|---|---|---|---|---|---|---|---|---|---|---|---|---|
| HII (DOPE) | 1328 | 300 | 0.3 | 50.3 0.3 | ||||||||||
| Lα (DPPC) | 768 | 128 | 0.37 |
| ||||||||||
| Q (MO) | 3200 | 950 | 0.4 |
|
The three mesophases in Figure 1 (Q, HII, and Lα) were simulated using the coarse-grained Martini force field version 2.1, using the standard simulation parameters for version 2, in Gromacs 2018 [42]. Coarse grained models of DOPE and DPPC were used from the standard Martini library [42]. Monoolein was modelled using the parameters of Johner et al. 2014b [25].
The composition of each initial self-assembly simulation is detailed in table 1. The simulations were carried out at a pressure of 1 bar and temperature of 300 K. For the Q mesophase, an initial equilibration simulation was necessary to ensure a well-mixed initial state before self-assembly[23, 43].
The final frame of the short initial (150ns) self-assembly simulation was periodically replicated using Ovito. The initial HII and Q unit cells were periodically replicated in the x, y, z directions 2 times for an expanded cell simulation of 2x2x2 unit cells. The initial Lα unit cell was expanded 3x3x1 times in the x,y,z directions for the final simulation cell. The expanded number of unit cells were then simulated for a further 1 s (Lα, HII) or 1 ns (Q)[44] for use to fit point clouds to. 11 (Q) or 34 (Lα, HII) equally spaced frames from the replicated cell simulations were used to measure final curvature distributions.
2.2 Measuring curvature

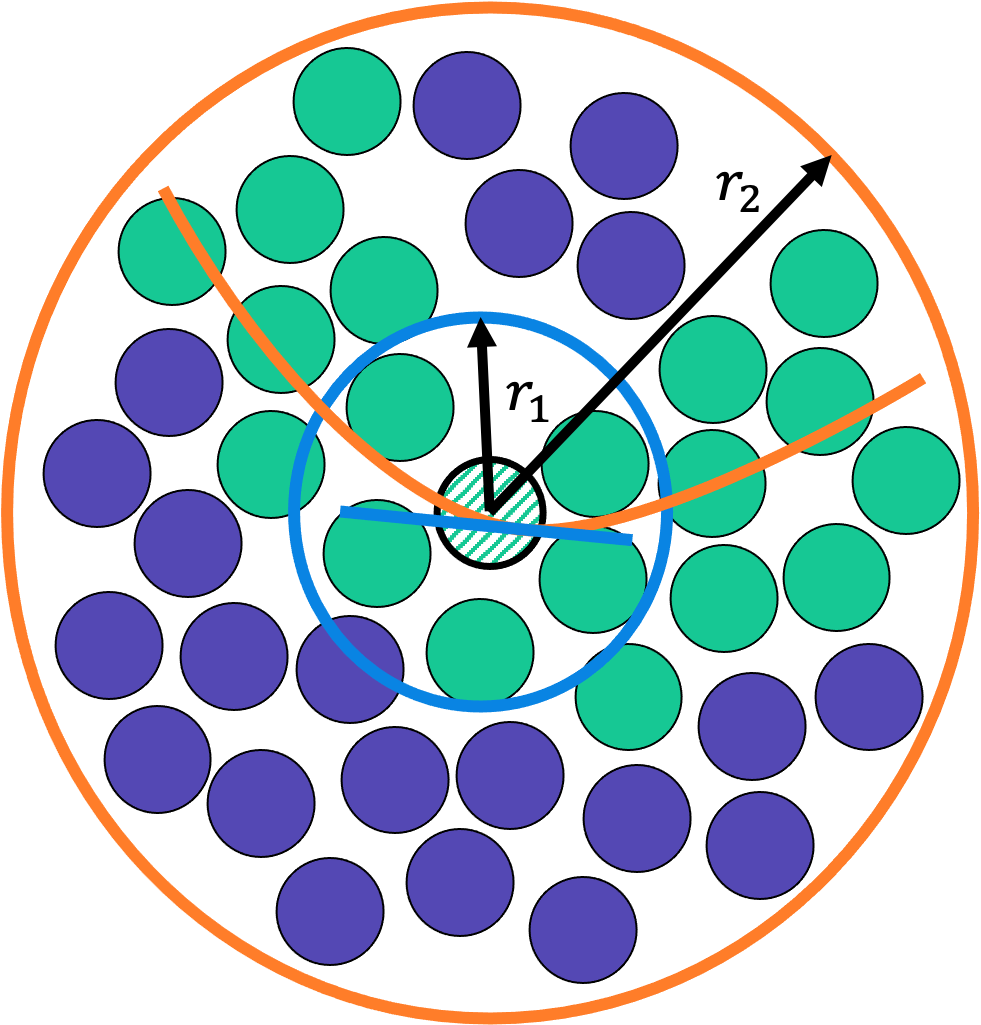
The method of Yesylevskyy and Ramseyer 2014 is illustrated in 2 dimensions in Figure 2. Point clouds of atoms are generated by a particular cutoff radius from a selected atom in the system. Subsequently, the principal components of the cloud are calculated, and the entire cloud is transformed accordingly so that the smallest principal component is directed in the z direction. The cloud is then translated so that the selected atom is at . The system is then fitted the generic quadric surface described by:
| (1) |
where are an orthogonal coordinate system and are parameters to be optimised [31]. The fitted parameters are used to calculate the mean and Gaussian curvatures according to the fundamental forms of Equation 1, as detailed in section S1 of the SI.
As the method described here uses point clouds of patches of membranes to measure curvature, it is possible to measure the curvature of a mesophase without prior knowledge or use of particular (non-Cartesian) coordinate system. This method will therefore allow the curvature properties of mesophase transitions to also be measured, and, as a local measure, has the potential to measure curvature preferences of molecules throughout simulations.
To begin this work, we used 5 frames from the initial (single cell) Lα simulation to compare the effectiveness of common fitting methods in the SciPy Python library to fit Equation 1 to point clouds. SciPy is a widely used scientific computing library in Python, which has a range of function optimisation routines[46]. The fitting methods were Least Squares, Minimize, Dual Annealing, Differential Evolution, and Simplicial Homology Global Optimisation.
Least Squares is perhaps the most common and direct method used for finding the minima of many functions. In SciPy, the most common method is a Levenberg-Marquardt (LM) method, which uses a trust-region strategy for minimization. A trust-region method defines a region around the iterate in which the model can be trusted to be a good representation of the objective function. Using this region of the parameter search space, a step and direction are simultaneously chosen to continue to reduce the value of the objective function, until a tolerance is reached[47].
Minimize uses the BFGS Quasi-Newton method to find minima, by measuring changes in the gradient of the objective function at each iteration. Unlike LM, the BFGS method uses only an approximation of the Hessian matrix at each iteration step to determine the search direction, and so reducing the cost of calculation from to , because no matrix-matrix operations are present in the method [47].
Differential Evolution (DE) and Dual Annealing (DA) are stochastic optimisation methods, able to search a large parameter space for high-dimensional problems. Stochastic methods in this way trial potential solutions from a bounded initial parameter space, and develop further iterate solutions from candidate solutions throughout the iteration routine[48, 49].
Simplicial Homology Global Optimisation (SHGO) is a recently-developed global optimisation technique, which, similarly to DE and DA works as a global optimisation algorithm, able to solve high-dimensional optimisation problems using input initial bounds on functions [50]. However, unlike DE and DA, it does not use stochastic methods for finding minima in black-box input functions. Instead, SHGO finds multiple locally convex sub-domains of the objective function, which are individually fitted at each stage. Not only does this guarantee finding the global minimum of the function, if bounds are correctly chosen, but the location of local minima can also be simultaneously determined. This represents an improvement over stochastic methods, which may still converge to the same local minima if the initial sampling of the objective function is done poorly.
Once the fitting method had been established, curvatures were measured and averaged from frames of the expanded cell simulation, systematically varying the cutoff radius and measurement location. The reference Gaussian curvature of the cubic phase was calculated from the fitting of the implicit equation for the nodal approximation of the Diamond minimal surface, and using the parameters of the fitted surface after the method of Goldman 2005 [11, 23, 51].
The fitting code is available for open source use at https://github.com/csbrasnett/lipid-md
3 Results
3.1 Effect of fitting method on curvature results


Our initial work compares the effectiveness of the 5 fitting methods described in the methods at fitting the surface described in Equation 1 to point clouds of atoms. For this, we used the terminal carbon beads (C4A and C4B as labelled in Figure 1) of the mesophase at a cutoff radius of 25 Å. As the mesophase is based on a flat plane, the results should show a distribution around 0 for both the mean and Gaussian curvature measures, by any measure of the curvature. Ideally, the surface fitted by each method would be identical, and the curvatures calculated would match exactly in every case.
An example of the outcome of comparing these results in an mesophase is seen in Figure 3, where we show the results for Gaussian and mean curvatures compared for the SHGO and Least Squares methods close to 0. For a full comparison of all the fitting methods examined here, we have plotted every pair plot comparing methods in Figure S1 of the SI. In this region there is relatively low agreement between the results, as shown by the low R2 values in Figure 3 c) and d). However, there is still a remarkably close agreement between the overall distributions of the results for the Gaussian curvature, where both distributions are very narrowly distributed about 0. The agreement between the measures for mean curvature is slightly better, but the relatively sharp peak for Least Squares centered at -1x Å-1 shows that this measure can produce a strong systematic error for even a simple mesophase. Taking Figure 3 a) and b) together for Least Squares, we can see that in general, the fit is producing cylindrical section surfaces, with K=0 and H0. Comparing these two methods demonstrates the importance of using a wide trial parameter space and careful method selection in fitting point clouds of atoms. As we further show in Figures S1 and S2 of the SI, SHGO consistently produces the narrowest distributions of both mean and Gaussian curvature in comparison to any other method tried, and has closest agreement with the two other global fitting methods. In contrast, Least Squares fitting has a very poor level of agreement with any other method, and produces the results with the most extreme outliers.
In Figure 4, we show that the choice of fitting method further effects the performance of the fitting routine. Figure 4 used 1280 fits to point clouds across a simulation of a single unit cell of an mesophase, with the number of iterations of each method limited to 500. Our results then show the time that each method takes to complete within its termination limit, with SHGO taking the shortest, and Dual Annealing taking the longest. However, more importantly, in b) and c) we compare the value of the objective function when the method terminates (regardless of successful termination), and the total number of evaluations of the objective function that took place in doing so. For an ideal fit, the value of the objective function should be 0, with the surface matching each points exactly. However, where there is agreement between 4 of the methods, the Least Squares method has a consistently higher value, indicating a poorer fit. Of the other methods, SHGO matches the final value of the objective function, while also using the fewest evaluations of the function throughout the fit, and taking the quickest time. Furthermore, as we show in both Figure 3 and S1 & S2 of the SI, the median value of the mean and Gaussian curvatures in the Lα mesophase using SHGO is the closest to zero. Therefore, the final method for fitting point clouds from any mesophase uses the SHGO method, in order to ensure the most appropriate fit to the data.
3.2 Effect of atom type on curvature measurement

Having established that SHGO was the optimal method for fitting Equation 1, we investigated the effect of varying the location in the membrane at which to measure curvature, at a range of cutoff radii. For a radius of 40 Å, we show results in Figure 5. Equivalent figures for other radii are in the SI.
For the Lα and HII trajectories, curvatures were measured at the initial (C1A, C1B) and terminal (C4A, C4B) carbons as labelled in Figure 1. For measurements of curvature in the Q simulation, we measured curvature through independent point clouds of all 5 carbon atoms. Additionally, we trialled the method of Yesylevskyy and Ramseyer 2014 in taking the positions of both the terminal carbons and headgroups, to fit a surface inbetween them.
In Figure 5, we firstly note the proportion of measured Gaussian curvature data which has been fitted in the range seen within the figure. This necessarily arises from comparison with the calibration for the Gaussian curvature in the Q mesophase, where the distribution is known from the size of the simulated cell [11]. While the proportion included in the measurements for the Lα and HII mesophases is close to 100%, there is significant variation in the Q measurements. The proportion fitted within the expected range is far greater when point clouds of atoms closer towards the centre of the bilayer are used. This data is itself plotted for cutoff radii in Figures S3-S5 of the SI, in which we also show that at shorter cutoff lengths, the proportion included in the expected range for the Q mesophase measurements is significantly reduced.
In the Lα and HII mesophases, the Gaussian curvature is expected to be 0. The mean curvature of the Lα mesophase is also 0, but in the HII phase it is non-zero, as it is measured at the (cylindrical) pivotal plane. For an HII mesophase, the pivotal plane is located around the C1A/C1B atom location in the system, with a radius of 20.1 Å for the HII system, used here[24]. The results presented in Figure 5 show that while Gaussian curvature is distributed around 0 as expected regardless of the location in the membrane it is measured, there is a more significant variation in the measurements of mean curvature. This is particularly evident in the case of the Lα mesophase, where taking the C1A/C1B beads of the system has resulted in a distribution of curvature not averaged about 0. However, for the HII mesophase, the measurement of mean curvature shows peaks close to the expected value of 0.049 Å-1 as indicated by the dashed black lines in Figure 5 f). Further, at a cutoff of 30 Å as we show in Figure S6, the distribution has peaks at the expected value.
For measurements of the Lα system, the discrepancy in mean curvature measurements is likely due to the chosen cutoff of 40 Å in Figure 5. This cutoff radius is larger than the bilayer thickness, which results in both sides of the bilayer being captured to fit, and so a non-planar fit is usually found, for example in Figure S7 of the SI. Indeed, as seen in Figure S8 of the SI, at smaller cutoff radii of 10 Å, the measurement of mean curvature in the Lα is averaged around 0, albeit with a comparatively broad distribution.
In comparison, the measurements of mean curvature in the Q mesophase are distributed around 0 regardless of the location within the membrane to fit. The Q surface is defined by the property of having zero mean curvature, so in this regard, the measurement is as expected. The measurement of Gaussian curvature in the Q mesophase varies far more significantly. While no measurement conditions perfectly resemble the theoretical distribution of Gaussian curvature, using point clouds of terminal carbon atoms closely resembles it, with the vast majority of the data within the expected range for the unit cell size. As the Q mesophase can be thought of as consisting of a lipid bilayer wrapped around an underlying minimal surface at the centre, this is expected.
Following the technique of Yesylevskyy and Ramseyer 2014, we additionally measured Gaussian curvature in the Q phase using point clouds formed of both the terminal carbon C5A atom and the GL1 headgroup atom together. As Figure 5 b) shows, this is perhaps the poorest measure of any. In this case, the first stage of the fitting routine often does not identify the principal axes of the point cloud correctly, and so Equation 1 cannot be fitted correctly to it (for example, see Figure S9 of the SI).
3.3 Effect of cutoff radius on curvature measurement

Given that curvatures vary widely with the location in the membrane where they are measured, we further systematically examined the effect of how the results vary with the cutoff radius used, which we show in Figure 6. As might reasonably be expected, the results for the Lα mesophase show that as the cutoff radius increases, and the number of terminal carbons fitted to increases, both the mean and Gaussian curvatures become increasingly tightly distributed around the expected mean of 0. Although the same expected pattern is observed for the mean curvatures in the HII mesophase, the variation in the Gaussian curvature is far more significant. At both small and large cutoff radii, the measurements are distributed around 0, without the peaks at the appropriate values for the radius of the C1A, C1B cylinder indicated by the dashed lines. The fact that these peaks only emerge at intermediate cutoff radii indicates that at smaller and larger values, the surface being fitted becomes planar. At cutoff radii of 25 and 30 Å, the peaks emerge at the expected value of H.
In comparison, the distribution of mean curvature in the Q mesophase is very consistently a sharp peak around 0 irrespective of the cutoff radius. However more than any other, Figure 6 b) demonstrates that careful consideration needs to be given to the cutoff radius used to measure curvatures. While a cutoff of 40 Å has a peak at more negative K as expected, at more extreme cutoffs, the peak completely disappears. As when varying the location in the membrane for the measurements, we also note that changing the cutoff radius has a significant effect in how much data fall within the expected range not just in the Q mesophase, but also in the Lα and HII in Figure S10 of the SI.
4 Conclusions
In this work, we have presented a general method for analysing the mean and Gaussian curvatures of simulated lipid mesophases. We have evaluated how the method works under a variety of classic and recently developed optimisation methods, showing that optimisation methods designed for global optimisation perform significantly more self-consistently, and faster, than older methods that have been used previously. In particular, we have demonstrated the efficacy of the recently-developed SHGO method for a many-parameter problem such as the one used here [50]. We subsequently showed that using the mesophase-agnostic method cannot be done naively: depending on the mesophase, the curvature distributions measured can vary significantly if improper choices are made for either the membrane location or the point cloud cutoff radius.
The validation of the mesophase independent method in this work will allow us in future to use molecular dynamics studies to inform experimental work. In particular, the study of lipid mesophase transitions is significant in the context of a number of biological processes, such as the formation of ceramide skin barriers, membrane fusion, and enzyme activity [52, 53, 54]. The method presented here will enable new understanding of the role that curvature plays in these transitions. Moreover, as a local measurement, the method will enable the tracking of individual molecules in mesophases, providing important contributions to questions around the curvature preference of different molecules.
References
- Kawamoto et al. [2015] S. Kawamoto, M. L. Klein, W. Shinoda, Coarse-grained molecular dynamics study of membrane fusion: Curvature effects on free energy barriers along the stalk mechanism, The Journal of Chemical Physics 143 (2015) 243112. URL: https://doi.org/10.1063/1.4933087. doi:10.1063/1.4933087.
- Chang-Ileto et al. [2011] B. Chang-Ileto, S. G. Frere, R. B. Chan, S. V. Voronov, A. Roux, G. D. Paolo, Synaptojanin 1-mediated PI(4, 5)p2 hydrolysis is modulated by membrane curvature and facilitates membrane fission, Developmental Cell 20 (2011) 206–18. URL: https://doi.org/10.1016/j.devcel.2010.12.008. doi:10.1016/j.devcel.2010.12.008.
- Bigay et al. [2005] J. Bigay, J.-F. Casella, G. Drin, B. Mesmin, B. Antonny, ArfGAP1 responds to membrane curvature through the folding of a lipid packing sensor motif, The EMBO Journal 24 (2005) 2244–53. URL: https://doi.org/10.1038/sj.emboj.7600714. doi:10.1038/sj.emboj.7600714.
- Lee et al. [2005] M. C. Lee, L. Orci, S. Hamamoto, E. Futai, M. Ravazzola, R. Schekman, Sar1p n-terminal helix initiates membrane curvature and completes the fission of a COPII vesicle, Cell 122 (2005) 605–17. URL: https://doi.org/10.1016/j.cell.2005.07.025. doi:10.1016/j.cell.2005.07.025.
- Lundmark et al. [2008] R. Lundmark, G. J. Doherty, Y. Vallis, B. J. Peter, H. T. McMahon, Arf family GTP loading is activated by, and generates, positive membrane curvature, Biochemical Journal 414 (2008) 189–94. URL: https://doi.org/10.1042/bj20081237. doi:10.1042/bj20081237.
- van Meer et al. [2008] G. van Meer, D. R. Voelker, G. W. Feigenson, Membrane lipids: where they are and how they behave, Nature Reviews Molecular Cell Biology 9 (2008) 112–24. URL: https://doi.org/10.1038/nrm2330. doi:10.1038/nrm2330.
- Callan-Jones and Bassereau [2013] A. Callan-Jones, P. Bassereau, Curvature-driven membrane lipid and protein distribution, Current Opinion in Solid State and Materials Science 17 (2013) 143–50. URL: https://doi.org/10.1016/j.cossms.2013.08.004. doi:10.1016/j.cossms.2013.08.004.
- Baoukina et al. [2018] S. Baoukina, H. I. Ingólfsson, S. J. Marrink, D. P. Tieleman, Curvature-induced sorting of lipids in plasma membrane tethers, Advanced Theory and Simulations 1 (2018) 1800034. URL: https://doi.org/10.1002/adts.201800034. doi:10.1002/adts.201800034.
- Hyde [1997] S. Hyde, The Language of shape : the role of curvature in condensed matter–physics, chemistry, and biology, Elsevier, Amsterdam Netherlands New York, 1997.
- Helfrich [1973] W. Helfrich, Elastic properties of lipid bilayers: Theory and possible experiments, Zeitschrift für Naturforschung C 28 (1973) 693–703. URL: https://doi.org/10.1515/znc-1973-11-1209. doi:10.1515/znc-1973-11-1209.
- Schwarz and Gompper [1999] U. S. Schwarz, G. Gompper, Systematic approach to bicontinuous cubic phases in ternary amphiphilic systems, Phys. Rev. E 59 (1999) 5528–41. URL: https://link.aps.org/doi/10.1103/PhysRevE.59.5528. doi:10.1103/PhysRevE.59.5528.
- Risselada and Marrink [2008] H. J. Risselada, S. J. Marrink, The molecular face of lipid rafts in model membranes, Proceedings of the National Academy of Sciences 105 (2008) 17367–72. URL: https://doi.org/10.1073/pnas.0807527105. doi:10.1073/pnas.0807527105.
- Carpenter et al. [2018] T. S. Carpenter, C. A. López, C. Neale, C. Montour, H. I. Ingólfsson, F. D. Natale, F. C. Lightstone, S. Gnanakaran, Capturing phase behavior of ternary lipid mixtures with a refined martini coarse-grained force field, Journal of Chemical Theory and Computation 14 (2018) 6050–62. URL: https://doi.org/10.1021/acs.jctc.8b00496. doi:10.1021/acs.jctc.8b00496.
- Bennett and Tieleman [2013] W. D. Bennett, D. P. Tieleman, Computer simulations of lipid membrane domains, Biochimica et Biophysica Acta (BBA) - Biomembranes 1828 (2013) 1765–76. URL: https://doi.org/10.1016/j.bbamem.2013.03.004. doi:10.1016/j.bbamem.2013.03.004.
- Giraldo and Kasson [2020] A. M. V. Giraldo, P. M. Kasson, Bilayer-coated nanoparticles reveal how influenza viral entry depends on membrane deformability but not curvature, The Journal of Physical Chemistry Letters 11 (2020) 7190–6. URL: https://doi.org/10.1021/acs.jpclett.0c01778. doi:10.1021/acs.jpclett.0c01778.
- Larsen et al. [2017] J. B. Larsen, C. Kennard, S. L. Pedersen, K. J. Jensen, M. J. Uline, N. S. Hatzakis, D. Stamou, Membrane curvature and lipid composition synergize to regulate n-ras anchor recruitment, Biophysical Journal 113 (2017) 1269–79. URL: https://doi.org/10.1016/j.bpj.2017.06.051. doi:10.1016/j.bpj.2017.06.051.
- Tang et al. [2014] T.-Y. D. Tang, A. M. Seddon, C. Jeworrek, R. Winter, O. Ces, J. M. Seddon, R. H. Templer, The effects of pressure and temperature on the energetics and pivotal surface in a monoacylglycerol/water gyroid inverse bicontinuous cubic phase, Soft Matter 10 (2014) 3009–15. URL: https://doi.org/10.1039/c4sm00114a. doi:10.1039/c4sm00114a.
- Seddon et al. [2006] J. M. Seddon, A. M. Squires, C. E. Conn, O. Ces, A. J. Heron, X. Mulet, G. C. Shearman, R. H. Templer, Pressure-jump x-ray studies of liquid crystal transitions in lipids, Philosophical Transactions of the Royal Society A: Mathematical, Physical and Engineering Sciences 364 (2006) 2635–55. URL: https://doi.org/10.1098/rsta.2006.1844. doi:10.1098/rsta.2006.1844.
- Seddon et al. [2014] A. M. Seddon, J. Hallett, C. Beddoes, T. S. Plivelic, A. M. Squires, Experimental confirmation of transformation pathways between inverse double diamond and gyroid cubic phases, Langmuir 30 (2014) 5705–10. URL: https://doi.org/10.1021/la5005837. doi:10.1021/la5005837.
- Squires et al. [2000] A. Squires, R. H. Templer, O. Ces, A. Gabke, J. Woenckhaus, J. M. Seddon, R. Winter, Kinetics of lyotropic phase transitions involving the inverse bicontinuous cubic phases, Langmuir 16 (2000) 3578–82. URL: https://doi.org/10.1021/la991611b. doi:10.1021/la991611b.
- van ‘t Hag et al. [2017] L. van ‘t Hag, S. L. Gras, C. E. Conn, C. J. Drummond, Lyotropic liquid crystal engineering moving beyond binary compositional space – ordered nanostructured amphiphile self-assembly materials by design, Chemical Society Reviews 46 (2017) 2705–31. URL: https://doi.org/10.1039/c6cs00663a. doi:10.1039/c6cs00663a.
- Conn et al. [2006] C. E. Conn, O. Ces, X. Mulet, S. Finet, R. Winter, J. M. Seddon, R. H. Templer, Dynamics of structural transformations between lamellar and inverse bicontinuous cubic lyotropic phases, Physical Review Letters 96 (2006). URL: https://doi.org/10.1103/physrevlett.96.108102. doi:10.1103/physrevlett.96.108102.
- Khelashvili et al. [2012] G. Khelashvili, P. B. C. Albornoz, N. Johner, S. Mondal, M. Caffrey, H. Weinstein, Why GPCRs behave differently in cubic and lamellar lipidic mesophases, Journal of the American Chemical Society 134 (2012) 15858–68. URL: https://doi.org/10.1021/ja3056485. doi:10.1021/ja3056485.
- Johner et al. [2014a] N. Johner, D. Harries, G. Khelashvili, Curvature and lipid packing modulate the elastic properties of lipid assemblies: Comparing HII and lamellar phases, The Journal of Physical Chemistry Letters 5 (2014a) 4201–6. URL: https://doi.org/10.1021/jz5022284. doi:10.1021/jz5022284.
- Johner et al. [2014b] N. Johner, S. Mondal, G. Morra, M. Caffrey, H. Weinstein, G. Khelashvili, Protein and lipid interactions driving molecular mechanisms of in meso crystallization, Journal of the American Chemical Society 136 (2014b) 3271–84. URL: https://doi.org/10.1021/ja4129839. doi:10.1021/ja4129839.
- Barriga et al. [2019] H. M. G. Barriga, M. N. Holme, M. M. Stevens, Cubosomes: The next generation of smart lipid nanoparticles?, Angewandte Chemie International Edition 58 (2019) 2958–78. URL: https://doi.org/10.1002/anie.201804067. doi:10.1002/anie.201804067.
- Zhai et al. [2019] J. Zhai, C. Fong, N. Tran, C. J. Drummond, Non-lamellar lyotropic liquid crystalline lipid nanoparticles for the next generation of nanomedicine, ACS Nano 13 (2019) 6178–206. URL: https://doi.org/10.1021/acsnano.8b07961. doi:10.1021/acsnano.8b07961.
- Richardson et al. [2017] S. J. Richardson, M. R. Burton, X. Luo, P. A. Staniec, I. S. Nandhakumar, N. J. Terrill, J. M. Elliott, A. M. Squires, Watching mesoporous metal films grow during templated electrodeposition with in situ SAXS, Nanoscale 9 (2017) 10227–32. URL: https://doi.org/10.1039/c7nr03321d. doi:10.1039/c7nr03321d.
- Zabara et al. [2018] A. Zabara, J. T. Y. Chong, I. Martiel, L. Stark, B. A. Cromer, C. Speziale, C. J. Drummond, R. Mezzenga, Design of ultra-swollen lipidic mesophases for the crystallization of membrane proteins with large extracellular domains, Nature Communications 9 (2018). URL: https://doi.org/10.1038/s41467-018-02996-5. doi:10.1038/s41467-018-02996-5.
- Caffrey [2015] M. Caffrey, A comprehensive review of the lipid cubic phase orin mesomethod for crystallizing membrane and soluble proteins and complexes, Acta Crystallographica Section F Structural Biology Communications 71 (2015) 3–18. URL: https://doi.org/10.1107/s2053230x14026843. doi:10.1107/s2053230x14026843.
- Yesylevskyy and Ramseyer [2014] S. O. Yesylevskyy, C. Ramseyer, Determination of mean and gaussian curvatures of highly curved asymmetric lipid bilayers: the case study of the influence of cholesterol on the membrane shape, Physical Chemistry Chemical Physics 16 (2014) 17052. URL: https://doi.org/10.1039/c4cp01544d. doi:10.1039/c4cp01544d.
- Tonnesen et al. [2014] A. Tonnesen, S. M. Christensen, V. Tkach, D. Stamou, Geometrical membrane curvature as an allosteric regulator of membrane protein structure and function, Biophysical Journal 106 (2014) 201–9. URL: https://doi.org/10.1016/j.bpj.2013.11.023. doi:10.1016/j.bpj.2013.11.023.
- Lundbæk et al. [2009] J. A. Lundbæk, S. A. Collingwood, H. I. Ingólfsson, R. Kapoor, O. S. Andersen, Lipid bilayer regulation of membrane protein function: gramicidin channels as molecular force probes, Journal of The Royal Society Interface 7 (2009) 373–95. URL: https://doi.org/10.1098/rsif.2009.0443. doi:10.1098/rsif.2009.0443.
- McMahon and Boucrot [2015] H. T. McMahon, E. Boucrot, Membrane curvature at a glance, Journal of Cell Science 128 (2015) 1065–70. URL: https://doi.org/10.1242/jcs.114454. doi:10.1242/jcs.114454.
- Jarsch et al. [2016] I. K. Jarsch, F. Daste, J. L. Gallop, Membrane curvature in cell biology: An integration of molecular mechanisms, Journal of Cell Biology 214 (2016) 375–87. URL: https://doi.org/10.1083/jcb.201604003. doi:10.1083/jcb.201604003.
- Gov [2018] N. S. Gov, Guided by curvature: shaping cells by coupling curved membrane proteins and cytoskeletal forces, Philosophical Transactions of the Royal Society B: Biological Sciences 373 (2018) 20170115. URL: https://doi.org/10.1098/rstb.2017.0115. doi:10.1098/rstb.2017.0115.
- Prinz and Hinshaw [2009] W. A. Prinz, J. E. Hinshaw, Membrane-bending proteins, Critical Reviews in Biochemistry and Molecular Biology 44 (2009) 278–91. URL: https://doi.org/10.1080/10409230903183472. doi:10.1080/10409230903183472.
- Zimmerberg and Kozlov [2005] J. Zimmerberg, M. M. Kozlov, How proteins produce cellular membrane curvature, Nature Reviews Molecular Cell Biology 7 (2005) 9–19. URL: https://doi.org/10.1038/nrm1784. doi:10.1038/nrm1784.
- Black et al. [2014] J. C. Black, P. P. Cheney, T. Campbell, M. K. Knowles, Membrane curvature based lipid sorting using a nanoparticle patterned substrate, Soft Matter 10 (2014) 2016–23. URL: https://doi.org/10.1039/c3sm52522h. doi:10.1039/c3sm52522h.
- Cheney et al. [2017] P. Cheney, A. Weisgerber, A. Feuerbach, M. Knowles, Single lipid molecule dynamics on supported lipid bilayers with membrane curvature, Membranes 7 (2017) 15. URL: https://doi.org/10.3390/membranes7010015. doi:10.3390/membranes7010015.
- Sorre et al. [2009] B. Sorre, A. Callan-Jones, J.-B. Manneville, P. Nassoy, J.-F. Joanny, J. Prost, B. Goud, P. Bassereau, Curvature-driven lipid sorting needs proximity to a demixing point and is aided by proteins, Proceedings of the National Academy of Sciences 106 (2009) 5622–6. URL: https://doi.org/10.1073/pnas.0811243106. doi:10.1073/pnas.0811243106.
- Marrink et al. [2007] S. J. Marrink, H. J. Risselada, S. Yefimov, D. P. Tieleman, A. H. de Vries, The MARTINI force field: coarse grained model for biomolecular simulations, The Journal of Physical Chemistry B 111 (2007) 7812–24. URL: https://doi.org/10.1021/jp071097f. doi:10.1021/jp071097f.
- Fuhrmans et al. [2009] M. Fuhrmans, V. Knecht, S. J. Marrink, A single bicontinuous cubic phase induced by fusion peptides, Journal of the American Chemical Society 131 (2009) 9166–7. URL: https://doi.org/10.1021/ja903224q. doi:10.1021/ja903224q.
- Stukowski [2010] A. Stukowski, Visualization and analysis of atomistic simulation data with OVITO-the Open Visualization Tool, MODELLING AND SIMULATION IN MATERIALS SCIENCE AND ENGINEERING 18 (2010). doi:{10.1088/0965-0393/18/1/015012}.
- Stukowski [2013] A. Stukowski, Computational analysis methods in atomistic modeling of crystals, JOM 66 (2013) 399–407. URL: https://doi.org/10.1007/s11837-013-0827-5. doi:10.1007/s11837-013-0827-5.
- Virtanen et al. [2020] P. Virtanen, R. Gommers, T. E. Oliphant, M. Haberland, T. Reddy, D. Cournapeau, E. Burovski, P. Peterson, W. Weckesser, J. Bright, S. J. van der Walt, M. Brett, J. Wilson, K. Jarrod Millman, N. Mayorov, A. R. J. Nelson, E. Jones, R. Kern, E. Larson, C. Carey, İ. Polat, Y. Feng, E. W. Moore, J. Vand erPlas, D. Laxalde, J. Perktold, R. Cimrman, I. Henriksen, E. A. Quintero, C. R. Harris, A. M. Archibald, A. H. Ribeiro, F. Pedregosa, P. van Mulbregt, S. . . Contributors, SciPy 1.0: Fundamental Algorithms for Scientific Computing in Python, Nature Methods 17 (2020) 261–72. doi:https://doi.org/10.1038/s41592-019-0686-2.
- Jorge Nocedal [2006] S. J. W. Jorge Nocedal, Quasi-newton methods, in: Springer Series in Operations Research and Financial Engineering, Springer New York, 2006. URL: https://doi.org/10.1007/978-0-387-40065-5_6. doi:10.1007/978-0-387-40065-5_6.
- Xiang et al. [1997] Y. Xiang, D. Sun, W. Fan, X. Gong, Generalized simulated annealing algorithm and its application to the thomson model, Physics Letters A 233 (1997) 216–20. URL: https://doi.org/10.1016/s0375-9601(97)00474-x. doi:10.1016/s0375-9601(97)00474-x.
- Storn and Price [1997] R. Storn, K. Price, Differential evolution – a simple and efficient heuristic for global optimization over continuous spaces, Journal of Global Optimization 11 (1997) 341–59. URL: https://doi.org/10.1023/a:1008202821328. doi:10.1023/a:1008202821328.
- Endres et al. [2018] S. C. Endres, C. Sandrock, W. W. Focke, A simplicial homology algorithm for lipschitz optimisation, Journal of Global Optimization 72 (2018) 181–217. URL: https://doi.org/10.1007/s10898-018-0645-y. doi:10.1007/s10898-018-0645-y.
- Goldman [2005] R. Goldman, Curvature formulas for implicit curves and surfaces, Computer Aided Geometric Design 22 (2005) 632–58. URL: https://doi.org/10.1016/j.cagd.2005.06.005. doi:10.1016/j.cagd.2005.06.005.
- Wennberg et al. [2018] C. L. Wennberg, A. Narangifard, M. Lundborg, L. Norlén, E. Lindahl, Structural transitions in ceramide cubic phases during formation of the human skin barrier, Biophysical Journal 114 (2018) 1116–27. URL: https://doi.org/10.1016/j.bpj.2017.12.039. doi:10.1016/j.bpj.2017.12.039.
- Narangifard et al. [2018] A. Narangifard, L. den Hollander, C. Wennberg, M. Lundborg, E. Lindahl, I. Iwai, H. Han, S. Masich, B. Daneholt, L. Norlén, Human skin barrier formation takes place via a cubic to lamellar lipid phase transition as analyzed by cryo-electron microscopy and EM-simulation, Experimental Cell Research 366 (2018) 139–51. URL: https://doi.org/10.1016/j.yexcr.2018.03.010. doi:10.1016/j.yexcr.2018.03.010.
- Siegel and Banschbach [1990] D. P. Siegel, J. L. Banschbach, Lamellar/inverted cubic (l.alpha./QII) phase transition in n-methylated-dioleoylphosphatidylethanolamine, Biochemistry 29 (1990) 5975–81. URL: https://doi.org/10.1021/bi00477a014. doi:10.1021/bi00477a014.