A review of mass concentrations of Bramblings Fringilla montifringilla: implications for assessment of
large numbers of birds
Abstract
Mass concentrations of birds, or lack of such, is a phenomenon of great ecological and domestic significance. Apart from being and indicator for e.g. food availability, ecological change and population size, it is also a source of conflict between humans and birds. Moreover, massive gatherings or colonies of birds also get the attention of the public – either as a spectacular phenomenon or as an unwelcome pest – thereby forming the public perception of birds and their abundance. In the context of the mass concentration of bramblings (Fringilla montifringilla) in Sweden the winter 2019–2020, this work reviews the literature on this striking phenomenon. Winter roosts are found to amount to on the order of one million birds per hectare of roost area, but the spread between reports is significant. Support for roosts of up to around 15 million birds was found, but much larger numbers are frequently recited in the literature. It is argued that these larger numbers are the result of overestimation or, in some cases, even completely unfounded (potentially typos). While the difficulties related to the count of large numbers of birds can explain this state, it is unfortunate that ”high numbers” sometimes displace proper numbers. Since incorrect data, and its persistence, may result in that incorrect conclusions are drawn from new observations, this matter deserves attention. As the Brambling is a well-studied species, the matter also raises concerns regarding numbers for mass concentrations of other species. It is recommended that very large numbers of birds should be recited and used with care: underlying data and methods of the original sources should be scrutinized. Analogously, reporters of large numbers of birds are advised to describe and document counting methods. In particular, number estimates based on flock volume and bird density should be avoided.
Keywords: Brambling, Fringilla montifringilla, avian communal roosting, large flocks, bird mass concentration, irruptive migration, bird migration, beech, mast year, Fagus sylvatica, bird counting
1 Introduction
The occurrence, or absence, of large flocks of birds is linked to factors such as population size, food abundance and food distribution and can therefore carry important information on the status of, and changes in, the environment Hémery & Pascaud (1981); Møller & Laursen (2019). Mass concentrations of birds is also an important source of conflicts with humans. As an example, tens of millions of red-billed quelea Quelea quelea are, due to their impact on farming, annually poisoned or blown up in Sub-Saharan Africa McWilliam & Cheke (2004). Similarly, various blackbirds – most notably the red-winged blackbird Agelaius phoeniceus – aggregate in huge flocks and are considered a major pest in North America Linz et al. (2017). The European starling Sturnus vulgaris, one of only three bird species on the IUCN list of the world’s worst invasive species Lowe et al. (2000), is yet another interesting example. Starlings are considered a serious problem in many countries over several continents, causing, for example, damage on fruit and berry farming and spread of disease Feare et al. (1992); Homan et al. (2017).
The bird species mentioned above are examples of birds that are reported to gather in millions. Such mass concentrations of birds are rare, and it is not more than around 50 of the worlds bird species that are reported to reach seven-digit numbers (see e.g. Møller & Laursen (2019)). As it is well known that counting large numbers of birds is extremely difficult, and since it matters if a bird count is 100 000 or 1 000 000 (a factor ten difference in potential crop damage or population size matters), it is well worth looking closer into how mass concentrations are counted and accounted for. This work takes a closer look at the brambling Fringilla montifringilla and its mass appearances in Europe during beech mast years. The brambling is the species in Europe that appears in largest flocks and is thus an interesting case study for discussing number estimates. The work is the result of an attempt to put the mass concentration in southern Sweden during the 2019–2020 winter into an international and historical perspective. After a description of the 2019–2020 events, a literature review is presented and counting methods discussed. The focus is on number estimation and roost density. For other aspects of the fascinating phenomenon of communal roosting of bramblings, the reader is referred to the existing literature. There are numerous ambitious studies of the topic, covering everything from relation to food abundance and snow cover Jenni & Neuschulz (1985); Jenni (1987), origin of birds and ring recoveries Schifferli (1953); Jenni (1982); Kjellén & Lindström (1993); Browne & Mead (2003), roost microclimate and communal roosting aspects Jenni (1991); Jenni (1993); Khil et al. (2011); Arizaga et al. (2012); Zabala et al. (2012) and foraging patterns and energy needs Granvik (1916); Hémery & Le Toquin (1975); Hémery & Le Toquin (1976); Francois (1978); Nardin & Brauchle (1979); Nardin & Nardin (1985); Jenni & Jenni-Eeiermann (1987); Kjellén & Lindström (1993); Khil et al. (2011) to behaviour of raptors in the vicinity of roosts Jenni (1993); Khil et al. (2011); Zuberogoitia et al. (2012).
2 Brambling ecology and behaviour
The brambling Fringilla montifringilla is one of the most numerous birds in the world. It breeds dispersed in northern forests of Europe and Asia, with a breeding range stretching all the way from Norway to eastern Siberia. The global population, which seems to be under moderate decline, is estimated to 100–200 million pairs, while the European population is limited to around 15–25 million breeding pairs (Birdlife International 2020). The species is highly migratory, but irruptive (i.e. exhibiting significant variation in migration patterns, see e.g. Newton (2006); Newton (2012)). While it is said to mainly migrate during night Newton (1972), some 100 000 bramblings are annually counted in Falsterbo, while leaving Sweden in daylight (on average almost one million finches are counted, but chaffinch Fringilla coelebs dominates and typically 5–25% are bramblings, Kjellén (2019) and Kjellén 2020, personal communication). While few ornithologists appear to have heard bramblings during the night, data from lighthouse suggests that the brambling indeed is a nocturnal migrant. Between 1886 and 1939, in an impressive and persevering Danish study, 1 568 bramblings were killed by and collected at Danish lighthouses, to be compared with e.g. 532 chaffinches Fringilla coelebs and 1 569 willow warblers Phylloscopus trochilus Hansen (1954). Alerstam (1993) has also noted bramblings leaving Sweden, heading out over the Baltic sea, at dusk.
In essence, the European bramblings moves towards the southwest until it finds satisfactory food resources Jenni (1987). Many end up in the vast beech forests of Central Europe, but the migration patterns vary significantly from year to year. In Sweden, an often mentioned example is an individual ringed when wintering in Halland (Southwest Sweden) in January 1965, just two winters after to be recovered in Caucasus Bird Ringing Centre, Swedish Museum of Natural History (2020); Kjellén & Lindström (1993). Other ringing recovery examples include a bird ringed in Blekinge (Southeast Sweden) in January 1986, the year after wintering in southwest France where it was found dead, and a bird ringed in Småland (South Sweden) in January 1955 later being killed in Spain in November the same year Bird Ringing Centre, Swedish Museum of Natural History (2020). Swiss ring recoveries shows that central Europe is also reached by bramblings with origin east of the Urals Jenni (1982). This nomadic character is considered to be a reason why the species, despite its wide breeding range, is monotypic.
When it comes to food, the brambling is an omnivore, although rather specialized. During breeding, bramblings have been found to rely on larvae of the Autumnal Moth (Epirrita autumnata), and its breeding success correlates with the strong cyclical fluctuations of this moth species Lindström et al. (2005); Newton (2007). During winters, a strong inclination for communal roosting (cf. Beauchamp (1999) makes them responsible, albeit sporadically, for one of most spectacular mass concentrations of animals in Europe. Nuts of the European beech Fagus sylvatica is their primary winter food and during beech mast years the abundance of food allows them to aggregate and form roosts of millions of birds (see e.g. Jenni (1987)). The birds typically settle in coniferous forest sections in the vicinity of large beech forests. Interestingly, in a limited period of time 1960–1980, also corn fields in France played an important role, see 4.5 and e.g. Hémery & Le Toquin (1975) and Dubois et al. (2008). The same patches can be used for months if food supplies and snow coverage allow. The distribution of beech in Europe is shown in 1, giving a rough indication of where European bramblings can be expected to winter in large numbers.

Historically, the appearance of millions of bramblings was often seen as a bad omen, as sign war, starvation or pest Holmgren (1866); Granvik (1916); Haikos (1950). Today, it is more of an attraction for nature lovers. However, it is worth keeping in mind that species for which a significant part of the population accumulates in limited areas are very vulnerable to, for example, hunting and poisoning. A contemporary example of this kind of vulnerability is the dramatic decline of the yellow-breasted bunting Emberiza aureola. Once superabundant, rampant trapping has brought the population of this species down to around 10% what is was only a few decades ago Kamp et al. (2015).
A single brambling requires some 25–30 kcal per day Hémery & Le Toquin (1975); Hémery & Le Toquin (1976); Kjellén & Lindström (1993), corresponding to around 8 g of beech seeds (around 40 seeds, or around a fourth of their body weight). This is based on published energy values for tree-seeds: the nutritive material (seed excluding coat) of a seed carries 7 kcal per g dry weight and the dry weight of nutritive material per seed is around 0.12 g Grodziński & Sawicka-Kapusta (1970); S.G. Nilsson (1979), resulting in around 0.84 kcal, or 3.5 kJ, per seed. Assuming 83% energy utilization Kjellén & Lindström (1993), this means that a single brambling requires some 40 seeds per day (27.5 kcal/day / (83%0.84 kcal/seed) 40 seeds/day). Since the fresh weight of a whole seed is around 0.2 g, this corresponds to 8 g. These energy considerations indicate that one million bramblings consume on the order of 8 tons of beech seeds per day, summing up to around 1 000 tons for a four-month wintering stay. For a mast year, the beech nut production can be well above 1 ton/ha Kjellén & Lindström (1993); Övergaard et al. (2007); Övergaard (2010). Given than bramblings can fly up to at least 40 km from a winter roost Mühlethaler (1952); Hémery & Le Toquin (1975); Francois (1978); Jenni (1984); Chalverat (2003); Khil et al. (2011), the accessible area is around 500 000 ha. The fraction of beech forest in that area can thus even be relatively low (e.g. even below a 1‰level) and still support millions of bramblings for several months.
An interesting aspect of mass roosting is the massive amount of faeces deposited in the roost area. Not only does it produce a nasty odour, it also affects the ecosystem Chalverat (2003). In 2000, as an example, a new species of fungi was found in the aftermath of a huge brambling roost and was named Pseudombrophila stercofringilla after the bird excrements Dougoud (2001). Still, the impact of brambling roosts on forest ecosystems should be small compared to the how the enormous passenger pigeon Ectopistes migratorius population – a species also specialised on tree-seeds such as beech mast affected forest ecology in North America (see e.g. Bucher (1992) and Ellsworth & McComb (2003)). In general, the knowledge of ecological functions of birds is far from complete Sekercioglu (2006) and the role bramblings have played in European beech forests, if any, is not clear.
3 The mass concentration in Sweden 2019–2020
After an extremely warm and dry summer 2018 and good conditions for beech flowering during 2019, the beech seed crop of 2019 turned out to be enormous. Although the quantitative beech mast counts, operated by Swedish University of Agricultural Sciences, unfortunately was discontinued a few years ago, there is no doubt that 2019 was an extreme mast year. Rough counting, by the author, indicated that a single large beech tree could carry on the order of 100 000 shells (cupule), corresponding to 200 000 seeds. Assuming that one hectare of beech forest is equivalent of 100 large trees, the seed production could be on the order of 20 million per hectare (i.e. around 4 tons/ha). As a comparison, highest local beech mast production during the beech mast counting 1989–2006 amounted to 14 million/ha Övergaard et al. (2007); Övergaard et al. (2007); Övergaard (2010). Furthermore, Prof. Sven Nilsson has conducted semi-quantitative monitoring of beech mast in Sweden since 1971, ranking the crop from 0 (no crop) to 5 (massive crop), and reports that there has not been a year in this series with as much beech mast as 2019 (Nilsson 2020, personal communication). Without standardized quantitative data, it is however difficult to know exactly how the 2019 mast year compares to other mast years. In addition to the rich beech crop, it is also interesting to note that the brambling seems to have had a good breeding season in Sweden. The LUVRE project (www.luvre.lu.se), monitoring birds in the northern birch forests since the 1960s, reports their highest number of ringed juvenile bramblings since the ringing start in 1983, and the third highest number in terms per juveniles per adult (Åke Lindström 2020, personal communication). That masses of Bramblings this year ended their migration in southern Sweden, taking advantage of the food abundance, became clear in November–December. Large flocks were reported from various areas of Scania (Skåne). A massive afternoon movement over the city of Båstad on December 22, witnessed by the author and Stefan Svensson (cf. Fig. 4), involved millions of birds and indicated that a roost was to be found in the area. The roost was found by the author on January 4 Svensson (2020) and was located on the south-facing slopes of the Hallandsås Horst, just north of lake Rössjön. Photos and moviews can be found at https://www.flickr.com/photos/tomas_s/albums/72157712566702823. The roost area was estimated to 5.6 ha, via night time sounds in combination with visual inspection of excrement layers and their boundaries (droppings) together with areal analysis using map tools supplied by Lantmäteriet (www.lantmateriet.se). The roost consisted of, respectively, approximately 2.6 ha of 31 year old and 3.0 ha of 39 year old plantations of European spruce Picea abies. The younger parts were dense with only around 2 m between tress while the older parts where thinned out and had 4–5 m distance between trees. Tree height ranged from 15 to 25 meters. Fig. 2 shows a view from the roost perimeter

Employing a simple square grid model on these tree spacings, and reducing the count by 10% to account for small opening and forest roads, this results in the following rough tree count estimate:
| (1) |
A map of the roost area is shown in 3.

On-site counting at the 2019–2020 site was very difficult, as it was impossible to get a good overview of the roost. Monitoring morning lifts or evening fly-in, was thus not easily done. The best number estimate is most likely that from Båstad on December 22, assuming that all of the birds passing there was headed for the same roost and that most of the roost had the same whereabouts this day. Despite being witnessed by rather experienced migration counters, the flow over Båstad was overwhelming. From analysis of photos, the front of Bramblings was over one kilometre wide at its peak intensity (determined via photographs).

Thousands of bramblings was in the binocular field of view and passed within a matter of seconds. A number estimate was thus reached only after analysis based on timing and photographs. Our field notes state that the movement occurred during around 5 minutes around 13:40, and then during 45 minutes from 14:55 to 15:40 (it was almost dark in the end, so the Bramblings seem to have been late this day – the sunset was at 15:33). Analysis of photo of a distant streak (where birds are caught from the side, simplifying analysis) showed that 1 900 birds passed per second (1 900 s-1, see Fig. 4 and its caption for details). At the peak intensity we believe that the total intensity should be two to three times of that. An analysis of a photo taken at a time where we considered the migration as ”dead”, revealed an intensity of 300 s-1 (see Fig. 5).

The numbers are breath-taking. In Falsterbo, with its annual standardised migration counts, finches are typically counted in a few thousands per minute on a good day. We (the author and Stefan Svensson) judged that the most intense period lasted around 20 minutes, and that the total amount of birds could be calculated from 30 minutes with 1000 s-1 and 20 minutes with 5 000 s-1, resulting in 7.8 million birds. As a lower bound, and since field notes are imperfect and we did not take photos systematically throughout the Brambling passage, we propose to use 40 minutes as to total duration and restricting the intense period to 10 minutes and 4000 s-1. This approximate lower bound amounts to 4.2 million birds. As an upper bound, maybe 30 minutes with 1500 s-1 and 20 minutes with 6 000 s-1 is reasonable, summing up to 9.9 million. A reasonable, albeit rough, range for the number of Bramblings involved in this movement is thus 4–10 million. As a comparison, when on-site on January 4th, the author together with Nils Kjellén and Ola Elleström very roughly estimated that we witnessed, visible from our side of the roost area, a fly-in intensity of around 2000 s-1 during 40 minutes, summing up to around 5 million birds. The sound and visual experience was stunning. Some efforts were also made to estimate the number of birds roosting per tree, but no firm conclusion could be reached. Infrared photographs indicate that ten birds easily can sit on a single twig during the night (see Fig. 6), and observations and photographs taken at dusk indicate that on the order of 1 000 birds can fit in a single spruce tree. Still, the number of birds per tree during the night remains an open question and more efforts are needed to elucidate this matter. As movements seems occur after dark, and since the bramblings are disturbed when approached, installation of infrared cameras in the roost may be an interesting approach.

Although bramblings winter in Sweden regularly, few Brambling winter roosts have been found. Prior to the roost described above, only three roosts have been located and described in detail Granvik (1916); Mathiasson (1960); Kjellén & Lindström (1993). One of these roosts was found 1993 very close to the location described above: just north of the neighboring lake Västersjön, on the same south-facing slopes Kjellén & Lindström (1993). Another roost was found was found some 36 km south from these locations during the 1915–1916 winter Granvik (1916). This part of Scania has vast beech forests and is relatively sparsely populated. It is therefore likely that even rather large roost can be overlooked. As an example, during the research for this article, the author stumbled across a YouTube-video filmed by fishermen in February 2012 showing enormous flocks of bramblings flying over lake Västersjön Hafström (2012). No roost was found this year. There are also years when ornithologists have reported million level flocks in various parts in southern Sweden, still without any roosts having been located.
Given the climate change that is upon us, it can be expected that bramblings will winter in southern Sweden in increasing numbers. The winter 2019–2020 was in fact, according to standard meteorological definitions, not a winter season at all and the average temperature was four degrees above normal Swedish Meteorological and Hydrological Institute (2020). Scania is rarely covered in snow nowadays and the frequency of beech mast years have increased in recent years Övergaard et al. (2007), although long-term variability also must be considered Drobyshev et al. (2014).
4 A review of mass concentration reports
It is sometimes argued that the brambling is the bird that gathers in the largest numbers of all (Newton 1998). A better guess is perhaps the red-billed quelea Quelea quelea which is reported to occur in numbers up to 100 million Hancock & Weiersbye (2015). There are also several other bird species are potential “records holders” (see e.g. Møller & Laursen (2019)), but given the difficulties in bird counting, it appears very difficult to get such a question settled. If including extinct species, the passenger pigeon Ectopistes migratorius will make settlement easier: the species has even been claimed to occur in billion level flocks (a sad but important reminder that what is common today may be go extinct more rapidly than we expect, cf. Murray et al. (2017)).
Turning back to bramblings, gatherings of millions are far from being reported annually. This is expected, since very large roosts appear to form only during beech mast years. Throughout the years, however, numerous accounts of the phenomenon are available thanks to authors from several European countries. Unfortunately, many reports neither provide details on how numbers were estimated, nor details regarding roost area. Many authors express how difficult it was to count properly and there is in many cases massive disagreements regarding the actual number of birds involved. This review aims at elucidating this matter and the main focus is therefore on reports that gives details on number estimations and roost area.
4.1 Approaches for number estimation
Three different approaches to number estimation was encountered during this work:
- A.
Stream intensity and time,
- B.
Flock volume and density,
- C.
Tree count and birds per tree,
In method A, the number of birds is reached by estimating the intensity of birds, , passing an observer (birds/s) in combination with time duration of the passage of that intensity (since intensity will fluctuate, new estimates should ideally be done continuously). The intensity can either be estimated directly (instantaneously) by the observer, or it can be done afterwards via analysis of photographs. Method B, on the other hand, focusses on flock volume (width , height and length ) and bird density (birds/m3), where flock length is reached by assuming a certain ground speed . Many works assume bramblings fly at 60 km/h 16.7 m/s, while radar measurements indicate that their ground speed is 15 m/s 54 km/h Alerstam et al. (2007). This inherent overestimation of 10% should of course be avoided, even though it in most cases will be negligible compared to other uncertainties. Method C is very different: instead of counting flying birds, the focus is on roost parameters. The number is reached by multiplying the number of trees in the roost by the average number of birds per tree.
Making any general statement on the accuracy of the different methods, and how they compare, is difficult since it depends on how the individual parameters are estimated. However, as various studies are discussed in subsequent sections, it will be argued that choosing to go via flock volume and density should be avoided. In many works, width and height in method B is set without proper motivation (keep in mind that difficulty of estimating distances by eye is widely recognised). In addition, there is far from any agreement on the average bird density in streams of bramblings. In fact, it should be expected that this varies significantly from roost to roost, and even from day to day at a single roost (depending on e.g. weather and foraging patterns). This means that method B is most likely far more error-prone than other methods. If width and height is estimated from photos (from size variations of birds in the picture, see Fig. 8 for an example), method B can become more accurate, albeit at the same time essentially turning into a complicated version of method A.
In the future, new approaches may help in reaching better number estimates. Airborne thermography was proposed by already 40 years ago Hémery & Pascaud (1981), and with the increasing availability of infrared and thermal cameras (or even normal video cameras) roosts will likely be studied in more detail in the future. Approaches based on quantitative monitoring of sound or droppings is also conceivable. In addition, increasing availability of counting software, for example based on artificial intelligence, will simplify counting based on films or photographs.
4.2 Reports with details on number and roost area
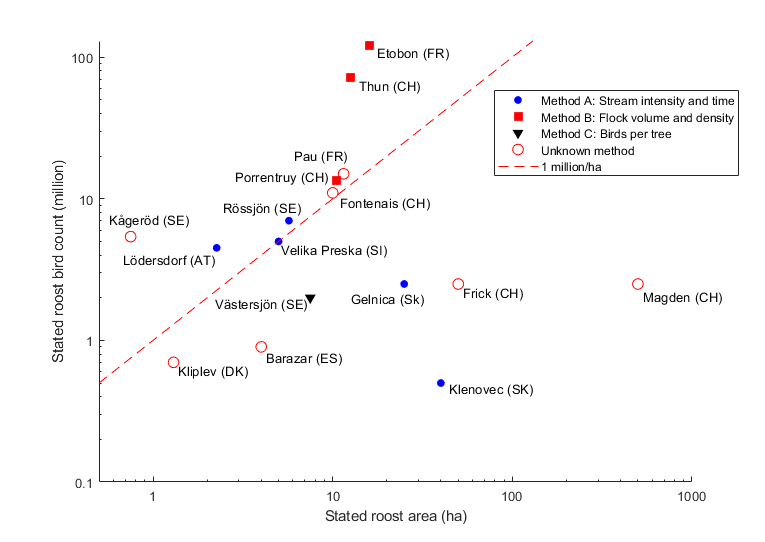
Reports that provide details on number and roost areas are listed and briefly summarised and commented a in Table 1 . The spread in reported numbers and roost areas are significant, and both number estimation and roost area definitions seem to vary greatly (cf. Fig. 7). When disregarding works that seem to have a too wide definition of roost area, the roost density (birds per area) varies from some 0.3 million/ha all the way up to 7.5 million/ha. This corresponds to a factor 25 between lowest and highest estimate of bird per roost area, a spread that motivated further scrutiny. It turns out to be very difficult to condense this material into any simple rule of thumb, but based on careful reading of the material, I come to the conclusion that the number of birds per roost area is on the order of one million/ha. There are a few works where much larger roost densities are reported, but a closer look reveals the underlying numbers lack adequate motivation. There are also some reports where densities are much lower Fulín & Olekšák (2017); Kestenholz & Schaffner (1993), but this is likely related to overestimation of actual roost area used during the night (see comments in Table 1 ). In the end, however, it should be expected that the density per roost area will vary significantly with, for example, age, size and density of trees, temperature, local variation of microclimate, total suitable area in relation to the number of bramblings accumulated during the winter etc. As an example, the large Slovenian roost in 2018–2019 comprised large, older trees (Mihelič 2020, personal communication) while the Swiss roost in 1946–1947 was situation in an area with young trees, most below 8 m in height Guéniat (1948). It should not be expected that the birds roost will have similar densities when the vegetation can differ that much.
|
Location
Year |
Roost area | Count method | Number estimate and remarks | Reference |
|
Kågeröd
Skåne Sweden 1915–1916 |
0.5–1 ha | ? | 5.4 million, based on 45 min fly-in at a presumed intensity of 2000 s-1 (without further motivation). The roost area is stated to be något tunnland in Swedish, i.e. around one barrel of land (0.5 ha). | Granvik, 1916 |
|
Porrentruy
Ajoie Switzerland 1946–1947 |
10.5 ha** | B | 11–16 million, based on 45 min morning lift-off in a stream 100 m wide and 5–7 m high, a ground speed of 60 km/h and 0.512 birds/m3 (corresponding to an average intensity of 4000–6000 s-1 ). | Guéniat, 1948 |
|
Hünibach
Thun Switzerland 1950–1951 |
12.6 ha*
(26.8) |
B | 72 million, based on 45 min fly-in in a 200 m wide and 4 m high stream, a ground speed of 60 km/h and 1 bird/m3, thereafter doubled since there were two similar adjacent roost areas (corresponding to an intensity of 13 300 s-1 per roost). Other assessors propose far lower numbers (Jenni & Neuschulz (1985)). |
Mühlethaler, 1952
Schifferli, 1953 |
|
Pau
Pyrénées-Atl. France 1964–1965 |
10–13 ha | ? | 15 million stated without further details. | Alberny, 1965 |
|
Etobon
Haute-Saône France 1977–1978 |
16.1 ha | B (A) | 121 or 12 million, based on two different calculations. The lower number is based on an analysis of a photo with 5 565 birds over a width of 32 m in combination with 70 min fly-in at 60km/h (i.e. 2 900 s-1). The larger (unreasonable) number, which is the one stated in the conclusion, is reached after arguing that the stream was 250 m wide and 50 m high and contained 0.138 birds/m3 (i.e. 29 000 s-1). | Nardin, 1979 |
|
Magden
Switzerland 1990–1991 |
5 km2
(500 ha) |
? | 2–3 million, stated without any further detail. Compared to other roosts, the area appears to be unreasonably large. | Kestenholz, 1993 |
|
Frick
Switzerland 1992–1993 |
0.5 km2
(50 ha) |
? | 2–3 million, stated without any further detail. Compared to other roosts, the area appears to be unreasonably large. | Kestenholz, 1993 |
|
Västersjön
Skåne Sweden 1992–1993 |
7.5 ha | C | 2 million, stated as a minimum based on around 7 500 trees and 200–500 birds per tree. Large number of dead and dying birds at the site. A similar number was reached in a fly-in count (Lithner (1995)). | Kjellén, 1993 |
|
Fontenais
Ajoie Switzerland 2001–2002 |
10 ha** | ? | 10–12 million. Not exactly clear how this span was inferred. The estimation was based on a 32 min fly-in of a stream estimated to be 50 m wide, 15 m high and moving at 60 km/h. An intensity of 5000 s-1 is stated as a minimum. The given 10–12 million range would correspond to calculation on the stream estimate and using 0.4–0.5 birds/m3. Area description and map not in perfect agreement. | Chalverat, 2003 |
|
Gelnica
Slovakia 2008–2009 |
25–30 ha | A | 1.5–3.5 million, based on photo analysis. Roost area not given in the article but from Fulin (2020) in personal communication. Compared to other roosts, this estimate seems unreasonably large (but Fulin also mentioned that the area included several hectares of lake). |
Fulin, 2017
Fulin, 2020 |
|
Lödersdorf
Austria 2008–2009 |
2.26 ha | A | 4–5 million, based on photo analysis on several locations around the roost. | Khil, 2011 |
|
Barazar
Basque Spain 2010–2011 |
3–5 ha | ? | 0.9 million. Droppings very unevenly distributed in the 50 ha large area mention in the article. Actual roost much smaller, and limited to patches of Lawson cypress (Chamaecyparis lawsoniana), but not discussed explicity. In personal communication, Zabala (2020) guessed that perhaps 3–5 ha may have been used for actual roosting and that the number may have been in the span 0.7–12 million birds. |
Zabala, 2012
Zabala, 2020 |
|
Klenovec
Slovakia 2016–2017 |
40 ha | A | 0.5 million, based on photo analysis. Compared to other roost, the area seems unreasonably large. | Fulin, 2017 |
|
Velika Preska
Slovenia 2018–2019 |
5 ha | A | 5 million, based on photo analysis. Series of photos were taken during morning lift-offs (ground speed estimated by measuring how long it took for birds to pass the camera field of view, done by following individual birds and marking start and stop times using a voice recording). In personal communication Mihelič (2020) states that the roost area may have been up to around 9 ha. |
Tout (2019)
Mihelič, 2020 |
|
Kliplev
Denmark 2019–2020 |
1.3 ha** | ? | 0.2–1.2 millions. Various number estimates from several observers, typically based on estimates of volume and bird density of flocks flying over the roost area. Roost area well covered by excrements measured to 1.3 ha on February 2 (Hansen, DOF-basen 2020), and in the Facebook forum “Feltornitologen” there is a map showing marking a roost area comprising of 2–2.5 ha (Martinek 2020). |
DOF-basen (2020)
Feltornitologen, 2020 |
|
Rössjön
Skåne Sweden 2019–2020 |
5.7 ha** | A | 4–10 million based on photo analysis from a fly-in around 20 km from the roost. More details in Section 3. | This study, 2020 |
4.3 Regarding the alleged 70 million roost in Thun 1950–1951
The famous and frequently recited 72 million roost from Thun, Switzerland 1950–1951 Mühlethaler (1952), often recited as 70 million, deserves a closer look. The number comes from a doubling of an estimate of birds arriving to one of two adjacent roost areas separated by around 300 m. The stream of birds was estimated to be 200 m wide and 4 m high, and the duration of the fly-in was 45 min. Assuming a ground speed of 60 km/h, the length of the stream was estimated to 45 000 m. Mühlethaler believes that 1 bird/m3 (1 m-3) is a reasonable lower limit for the bird density and thus reach 200 m 4 m 45 000 1 birds/m3 = 36 million birds. This corresponds to an average intensity of 13 000 birds per second, per roost. Along with some 30 million birds in other parts of Switzerland this winter, this roughly corresponds to the complete European post-breeding population. Although this number estimate received some support from Schifferli (1953), it has been rejected by others. Lukas Jenni, most likely the ornithologist who has spent most time studying the winter habits of bramblings in Europe, argues that the estimate even may be more than a factor ten too high Jenni (1984); Jenni & Neuschulz (1985). The main objection is that the bird density is overestimated, and that it is very difficult to accurately determine width and height of a bird stream. While Mühlethaler suggested that a flock density of 1 m-3 should be an underestimation, Jenni argues that 0.04–0.1 m-3 is more reasonable which would bring down the number from 72 million to 2.8–7 million. Jenni refers to that stereo photography on brambling flocks during autumn migration exhibited density in the 0.05–0.7 m-3 range, and that Nardin & Brauchle (1979) in their analysis of photographs estimated density to around 0.1 m-3 in dense regions, and 0.04 m-3 on average. The author of the present work, however, finds the analysis of Nardin & Brauchle rather confusing and suspect that the range 0.04–0.1 m-3 underestimates how dense bramblings can fly at the roost. Jenni recites that measurements of density during autumn migration resulted in values up to 0.7 m-3, and my personal experience is that the bramblings sometimes flew denser in connection to the winter roost than what the do, for example, during autumn migration in Falsterbo (Sweden). To evaluate this further, I evaluated two photos from occasions at the Swedish 2019–2020 roost where I found the bramblings to fly particularly dense. In these photos, the width of the stream was estimated from the variation in size (in pixels) of the photographed birds. The two photos were rather different in character (one photo of a smaller and well-defined flock, and one capturing part of a longer stream). The resulting density estimate was in both cases 1–3 m-3 (details of this analysis, for one of the photos, is found in Fig. 8). It is of course purely coincidental that the density estimates ended up this close together, but it still shows that bramblings can fly much denser that 0.04–0.1 m-3. Schifferli (1953) made a similar exercise: he studied photos of a stream, taken from below, somewhat arbitrarily assumed a stream height of 4 m and counted 87 finches in 20 m2. This results in a density of 1.1 m-3. Having this said, based on observations at the Swedish roost, I would still say that bramblings not always fly this dense.

In general, I fully agree with Jenni that (i) number estimates via flock volume and density should be avoided, especially if these quantities are not carefully measured, and (ii) number estimates are much better done by estimating the intensity of birds passing an observer, preferably with the help of photographs.
So, how many birds could there have been in Thun? Here it is worth mentioning that there are other assessors than Jenni that has proposed lower numbers than Mühlethaler. Egli (1951), for example, states that it was impossible to make any proper count but that 5 million should not be an overestimation. Moreover, according to Jenni & Neuschulz (1985), a certain Frutiger reached the number 1–2 million after analysis of photos. That numbers disagree is one thing – they often seem to do in the context of large flocks – but the question is who made the least inaccurate estimate. It should be noted that the lower numbers presented are also rather poorly founded. There is, however, yet another aspect to consider: the roost area. Mühlethaler specified the area to in total 13.6 ha, and that it comprised trees of Europan spruce Picea abies and European silver fir Abies alba at the age of 20–50 years. Compared to other roosts, many carefully studied, the resulting density of 5.3 million/ha appears surprisingly large. Although impossible to prove, I suspect that an overestimation has been caused by overestimation of both stream width and density. That the stream was 200 m wide and as dense as 1 m-3 continuously for 45 min sounds rather extreme (around 13 000 bird per second, for each roost).
4.4 Regarding the claim of 120 million
As can be seen in Table 1, it is rather common with number estimates based on flock volume and density (method B). In fact, the 72 million in Thun is not the highest number reached in this manner. Nardin & Brauchle (1979) concluded that the roost in Etobon 1977–1978 comprised 100–120 million bramblings. Their analysis is somewhat difficult to follow, even for a physicist, but their argument behind setting the flock width and height to 250 m and 50 m, respectively, is not convincing. It is interesting to note that, along with this volume/density calculation (method B), they also present an intensity-analysis along the lines of method A. There, an analysis of a photo resulted in a total number of 12 million. 12 million seems reasonable for this 16 ha roost, and it can be noted that Francois (1978) in his description on this roost mentions, without any motivation however, the number 10 million. It can perhaps have been more birds than that, but based on the discussion above, I agree with Jenni & Neuschulz (1985) that the range 100–120 million is unrealistic. This may be an example of how previous overestimations drive new overestimations. In fact, Nardin & Brauchle (1979) explicitly states that they consider their analysis more restrained than Mühlethaler (1952), arguing that if they would use his density of 1 birds/m3 their estimate would increase to 875 million. While they may have been more careful in terms of bird density assumption, their values for the height of their stream, which they set to 50 m, is less conservative. Again, in my opinion, an example of how difficult it is to set flock dimensions correctly.
4.5 Annual mass concentrations in corn districts in France 1960–1980
In previous sections it has been argued that the largest published values for brambling roosts should be regarded as overestimations. Clearly, it is not easy to answer the question of how many birds that the largest bramblings roosts has contained. The largest number mentioned in the review by Jenni (1987) is 20 million from a roost in Pau, Pyrénées-Atlantiques in France. The roost in Pau is not just another large roost – it represents fascinating brambling history. Corn production increased in France during the twentieth century and bramblings adapted to this new and abundant source of food . The roost in Pau was likely established in early 1960s and was occupied annually for several years Alberny et al. (1965). This is itself an interesting contrast to other very large roosts which are formed during beech mast years and therefore used in isolated years (never several years in a row). This interesting adaption to changes in human farming was studied Hémery and Le Toquin, focussing on the energy needs of bramblings and the supply offered by the losses in corn farming Hémery & Le Toquin (1975); Hémery & Le Toquin (1976). Changes in corn farming around 1980 (early burial of stubble) deprived the bramblings of this abundant food resources Dubois et al. (2008).
Regarding the specific value of 20 million, the most common source for this value is an article on the energy expenditure of bramblings by Georges Hémery and Alain Le Toquin Hémery & Le Toquin (1975). For example, the reference work Nouvel inventaire des oiseaux de France by Dubois et al. (2008) also refers to this work when stating 20 million as the peak of the roost numbers in Pau11 1 Note that the reference given by Dubois et al. (2008) is incorrect: the cited article is titled Determinisme energetique des concentrations de Pinsons du Nord…, not Determinisme des concentrations de Pinsons du Nord…. The missing word energetique constitutes an unfortunate typo, as it indicates that the focus is on determining concentration rather than energy expenditure. The typo may simply come from the winter atlas of France, as this work contains the very same typo Hémery (1991). Indeed, Hémery’s article contain a datapoint in a scatterplot that corresponds to a roost number of 20 million. The value is, however, not commented further. According to Hémery & Le Toquin (1976), the number 20 million refers to the number in December 1967, but I have not found any work in which the number estimate is elaborated. Sadly, the ornithologist and brambling enthusiast Georges Hémery, passed away in 2013 Yésou et al. (2014) and could not give his view on these numbers. His colleauge Alain Le Toquin believes that the value 20 million comes from Jean-Claude Alberny (Le Toquin 2020, personal communication). However, Jean-Claude Alberny does not recall any other number than 15 million, a number he published in 1965 in an intriguing article describing the roost in Pau Alberny et al. (1965). The roost, in 1965 covering around 10–13 ha, was shared with starlings Sturnus vulgaris. While most roosts has been located to conifers such as European spruce Picea abies, European silver fir Abies alba or Lawson cypresses Chamaecyparis lawsoniana, birds here perched in Holly Ilex aquifolium, an evergreen, and stunted oaks Quercus with retained dead leaves (marcescence). The bramblings were popular among hunters (not only in Pau) and served as food, and ringing revealed that many bird were injured:
Le baguage a appris également l’important pourcentage d’oiseaux blessés, près de 5% en janvier, chiffre diminuant par la suite. En effet les chasseurs apprécient cette espèce, aussi bien dans les Landes, le Gers et les Basses-Pyrénées où l’on peut trouver des brochettes entières de ces ”ortolans”.
Alberny also reported that some birds suffered from some kind of disease. Regarding the number of birds Alberny suggests 15 million, as also stated in 1. This is, however, a rough estimate. Birds came from all directions and proper counting seemed impossible. Alberny, believing it to be an underestimation, writes:
Une éévaluation parait impossible, les oiseaux arrivant de tous cô̂téés à la fois. De plus la configuration du relief ne permet pas de voir le dortoir en entier. Les Pinsons sont de très loin plus nombreux que les Etourneaux. On peut affirmer sans crainte qu’il y en a au moins 15 MILLIONS… Probablement plus…
It seems unlikely that Hémery studied the numbers in Pau as early as 1967. In an ambitious article from 1981, he elaborates on the difficulties of counting large numbers of birds, and explores whether infrared thermography can be of assistance Hémery & Pascaud (1981). However, in this work Hémery writes that proper counting at a roost requires multiple competent observers and argues that uncertainties may be as high as 50% when dealing with gatherings of birds on the order of ten millions. Hémery also presents the results of two visual counts made in Pau in February 1979: million on February 5 and later, when most birds had abandoned the roost, on February 14. The work does not contain any comparison with earlier numbers from Pau, nor details on how and by whom the counting was conducted in 1967 when 20 million was reported.
To conclude, it is difficult to confirm that there was as much as 20 million in a single roost in Pau. Given its large area (9–13 ha), the roost in Pau is without doubt one of the largest ever registered. As can be seen it Table 1, there are a few roost that has been of similar size. Which one of these that held the highest number of bramblings remains unknown.
4.6 The classic 1915–1916 roost in Sweden
Another interesting example is the internationally renowned winter roost in Kågeröd, Sweden 1915–1916, studied in detail by Hugo Granvik Granvik (1916); Granvik (1916); R. Nilsson (1983). In an otherwise detailed and careful study of a brambling roost, the number 5.4 million given by Granvik lacks detailed justification. Granvik states 5.4 million is reached if assuming that 2 000 birds per second arrive at the roost during the observed 45-minute fly-in duration. The number in itself is not sensational, given what we know today, but as the roost area appears to have been rather small the number appears surprisingly high. Granvik specifies that roost area to ”något tunnland” in Swedish, literally meaning around one barrel of land, i.e. 0.5 ha. That the roost area was rather small is also supported by sketches made by R. Nilsson (1983). It cannot, of course, be ruled out that the accumulation of bramblings at this site as the winter progressed – in relation to available area – made this roost extraordinary dense. In fact, Granvik (1916) writes that the bramblings utilized birch-trees in the border of the coniferous roost area. It is however not clear whether it was confirmed that these trees were populated also in the middle of the night. In the 2019–2020 roost in Sweden, I noted movements from beech trees into the actual roost also after dusk.
4.7 Counting trees and birds per tree
The study by Kjellén & Lindström (1993) is, to the best of my knowledge, the only previous work that have conducted number estimation by estimating the number of trees and birds per tree (method C). The work concerns a roost in Sweden located in January 1993, comprising approximately 7.5 ha (500 m by 150 m) of plantations of European spruce of different ages and heights between 10 and 20 m. Furthermore, it was estimated that there on average was one tree per 10 m2, resulting in a total tree count on 7 500. The authors estimated that at least 200 birds sat in each tree, and perhaps 500 in the larger ones, and conclude that the total number of bramblings at the very least should be 2 million. A fly-in count (method B, but without photos) by Lithner (1995) also estimated the number of birds to at least 2 million. Since the stated roost area is rather large, the number may appear somewhat low. It is, however, worth noting that this particular roost seems to have suffered from some kind of deadly disease (large numbers of dead birds were found within the roost area). As described in Section 3, observations at the Swedish 2019–2020 roost suggest that a single tree can host on the order of 1000 finches. A similar number was suggested for larger trees in the well-studied roost in Switzerland 1916–1947 Guéniat (1948). More studies on how many birds that roost per tree would be enlightening.
4.8 High numbers from nowhere
Around 100 texts on bramblings were read as a part of this review and on a few occasions I came across very high numbers that I could not track: the cited articles did not, as far as I can see, contain the claimed information. Unless other researchers have better luck in finding support in original sources, these numbers should not be recited. To facilitate future works on the topic, I have decided to explicity mention these oddities in the vast literature on brambling mass concentrations. The perhaps most important case is a claim in the standard reference Finches by Newton (1972). Referring to Guéniat (1948) and Sutter (1948), Newton writes that there was a roost of 50 million bramblings in Switzerland during the 1946–1947 winter. None of these articles contain such a number (perhaps a referral in Guéniat (1948) to an older roost and the number 5 million was misinterpreted as 51–52 million and rounded to 50 million?). Referring to Newtons text, this numbers is unfortunately recited in other important works. Another large number that lacks support is the 61 million that Møller & Laursen (2019) recites, referring to Géroudet (1952). Finally, it should be noted that Chalverat (2003) incorrectly refers to the PhD thesis of Jenni Jenni (1984) when stating that the roost in Röserental 1977–1978 comprised 28 million birds. Instead, the thesis argues (p. 40–41) that the roost contained around 6 million birds (the range 2–9 million is also given). This estimation has also been published in journals Jenni & Neuschulz (1985); Jenni (1991)
5 Conclusions and discussion
The literature review presented in this work suggest that there is support for bramblings roost involving up to around 15 million bramblings. In terms of areal density of birds, a roost may hold on the order of one million birds/ha. As large variations in roost density can be expected, this should be seen as an utterly rough estimate in need of further verification. As a comparison, the passenger pigeon with its tenfold mass has been estimated to roost in densitites of around 100 000 birds/ha Ellsworth & McComb (2003) and the red-billed quelea has been claimed to roost at densities of 2.5 million/ha Manikowski (1988). Claims of higher numbers, or densitites, such as the 70 million bramblings from Switzerland 1951–1952, is based on questionable methods and does not fit well the overall picture that emerges from collection of reports on mass concentrations of bramblings that has been built up throughout the years. Unfortunately, despite that the number 70 million has been rejected earlier Jenni & Neuschulz (1985), it keeps being recited without reservations in new works on mass appearances of birds. A main reason for this is perhaps that important reference books, like Finches by Newton (1972) and Bird Migration by Alerstam (1993), presents these values without reservations or discussions of uncertainties (in later works such as Population Limitation in Birds, however, Newton (1998) adheres to Jenni’s more restrictive view that values above 20 million lack proper support).
Given the difficulty in counting large numbers of birds, reports of very large numbers should always be used and recited with great care, regardless of whether it concerns bramblings, starlings, blackbirds, queleas or passenger pigeons. The large ecological and economical significance of large flocks of birds motivates further studies. Clearly, much can be done to improve our knowledge on the number in which flocks of our most abundant birds appear. This includes bramblings, despite all the efforts made so far. For example, there is no publication with a solid analysis and presentation of uncertainties in the number estimation conducted. In addition, roost areas are often not well investigated (demarcation in map missing). Just as for example vagrancy and taxonomy gets a lot of attention in ornithological journals, it would be very valuable to see also more work on accurate estimation of flock and roost sizes. From a critical point of view, millions should only be interpreted as many unless carefully motivated. While Hémery argued that, even with multiple competent observers, uncertainties may be 50% when numbers are in the ten million range Hémery & Pascaud (1981), the discussion on the 70 million and 120 million numbers Mühlethaler (1952); Nardin & Brauchle (1979); Jenni & Neuschulz (1985) indicates that uncertainties also can be a factor ten, depending on count method.
5.1 Roost characterization: a short checklist
- •
Counting. Try to monitor morning lift or evening fly-in from a spot with good overview. Make careful notes on timing (start and end of movements) and estimate the intensity of birds streams preferably by taking systematic series of photographs (or film). Avoid estimating numbers from flock volumes (width, height and length) and bird densities (birds per m3).
- •
Roost area. Determine roost boundaries via studies of excrement layers. Although zones around the roost, where birds gather before flying in, will show a lot of droppings, the actual roost area will be completely covered in excrements. Use the demarcation to estimate the roost area carefully using map tool (i.e. Google Maps).
- •
Document trees. Document trees in the roost (species, age, height and distance between trees) and try to estimate the total number of trees.
- •
Birds per tree. Try to estimate the number of birds per tree, preferably during the night using thermal cameras.
- •
Roosting in bare trees. If there are indications that bird sleeps also in non-conferious trees (e.g. in beech or other deciduous trees), confirm this with e.g. a thermal (infrared) camera in the middle of the night. The bramblings move also after dusk, and evidence of roosting in, for example, peripheral deciduous trees would be interesting (cf. Granvik (1916)).
6 Acknowledgement
First of all, I would like to thank Hanna, Siri och Vera for letting our family include also bramblings for quite some months. There are also many that have contributed more directly to the work, for example by engaging in interesting discussions, supplying complementary information, assisting in my hunt for obscure references, lending me equipment or reviewing and providing feedback on the manuscript. In particular, I would like to acknowledge the help from Thomas Alerstam, Johnny Jönsson, Nils Kjellén, Åke Lindström, Cecilia Nilsson, Lars Rippe & Roine Strandberg (Lunds Universitet), Sara Agrup, Roland & Jean-Claude Alberny, Janne Dahlén (Ecogain), Igor Drobyshev & Rolf Övergaard (SLU), Miro Fulín, Mats Hellmark (Sveriges Natur), Nicole Hémery, Alain Le Touqin, Lukas Jenni & Hans Schmidt (Schweizerische Vogelwarte, Schweiz), Tomaž Mihelič (Birdlife Slovenia), Yves Muller (Ligue pour la protection des oiseaux, LPO, Frankrike), Karin Persson (Falsterbo Fågelstation), Jean-Marc Pons & Jean-Pierre Siblet (Muséum national d’Histoire naturelle, Paris), Fritz Rosenörn (Rössjöholms gods), Sissel Sjöberg (University of Copenhagen), my brother Stefan Svensson, Jean-Marc Thiollay, Raffael Winkler (Naturhistorisches Museum Basel, Schweiz), Hasti Yavari (Axis Communications), Pierre Yésou and Jabi Zabala.
References
- Alberny et al. ((1965)) Alberny, J., Gac, J.T.L. & Venant, H. (1965). Quelques observations sur un dortoir de Pinsons du Nord. Oiseaux de France 44 18–25.
- Alerstam ((1993)) Alerstam, T. (1993). Bird migration. : Cambridge University Press.
- Alerstam et al. ((2007)) Alerstam, T., Rosén, M., Bäckman, J., Ericson, P.G.P. & Hellgren, O. (2007). Flight speeds among bird species: allometric and phylogenetic effects. PLoS Biol 5 8 e197.
- Arizaga et al. ((2012)) Arizaga, J., Zuberogoitia, I., Zabala, J., Crespo, A., Iraeta, A. & Belamendia, G. (2012). Seasonal patterns of age and sex ratios, morphology and body mass of bramblings fringilla montifringilla at a large winter roost in southern europe. Ringing & Migration 27 1 1–6.
- Beauchamp ((1999)) Beauchamp, G. (1999). The evolution of communal roosting in birds: origin and secondary losses. Behavioral Ecology 10 6 675–687.
- Bird Ringing Centre, Swedish Museum of Natural History ((2020)) Bird Ringing Centre, Swedish Museum of Natural History. (2020). Ring recovery database. https://birdrecoveries.nrm.se
- Browne & Mead ((2003)) Browne, S.J. & Mead, C.J. (2003). Age and sex composition, biometrics, site fidelity and origin of brambling Fringilla montifringilla wintering in norfolk, england. Ringing & Migration 21 3 145–153.
- Bucher ((1992)) Bucher, E.H. (1992). The causes of extinction of the passenger pigeon. In Current ornithology ( 1–36). : Springer.
- Chalverat ((2003)) Chalverat, J. (2003). Le Pinson du Nord Fringilla montifringilla L.: un visiteur d’exception dans les forêts d’Ajoie durant l’hiver 2001–2002. Schweizerische Zeitschrift fur Forstwesen 154 11 449–445.
- DOF-basen ((2020)) DOF-basen. (2020). Dansk ornitologisk forenings (dof) databas över observationer av fåglar. https://dofbasen.dk/
- Dougoud ((2001)) Dougoud, R. (2001). Pseudombrophila stercofringilla sp. nov. Mycologia helvetica 11 2 145–152.
- Drobyshev et al. ((2014)) Drobyshev, I., Niklasson, M., Mazerolle, M.J. & Bergeron, Y. (2014). Reconstruction of a 253-year long mast record of european beech reveals its association with large scale temperature variability and no long-term trend in mast frequencies. Agricultural and Forest Meteorology 192 9–17.
- Dubois et al. ((2008)) Dubois, P., Maréchal, P.L., Olioso, G. & Yésou, P. (2008). Nouvel inventaire des oiseaux de France. : Delachaux et Niestlé.
- Egli ((1951)) Egli, W. (1951). Beobachtungen am Schlafplatz eines Riesen-Bergfinkenzuges. Vögel der Heimat 21 113–115.
- Ellsworth & McComb ((2003)) Ellsworth, J.W. & McComb, B.C. (2003). Potential effects of passenger pigeon flocks on the structure and composition of presettlement forests of eastern north america. Conservation Biology 17 6 1548–1558.
- EUFORGEN ((2009)) EUFORGEN. (2009). Distribution map of Beech (Fagus sylvatica). www.euforgen.org
- Feare et al. ((1992)) Feare, C.J., Douville de Franssu, P. & Peris, S.J. (1992). The starling in europe: multiple approaches to a problem species. In Proceedings of the Vertebrate Pest Conference ( 15).
- Francois ((1978)) Francois, J. (1978). Pinsons du Nord en Franche-Comté. Falco 13 43–46.
- Fulín & Olekšák ((2017)) Fulín, M. & Olekšák, M. (2017). K migrácii a zimnỳm nocoviskám piniek severskỳch (Fringilla montifringilla) na Slovensku. Tichodroma 29 16–24.
- Géroudet ((1952)) Géroudet, P. (1952). Notes sur les Pinsons du Nord en Suisse romande (hiver 1950–1951). Nos Oiseaux 21 160–168.
- Granvik ((1916)) Granvik, H. (19161). Bergfinkinvasionen i Skåne vintern 1915–1916. Fauna och Flora 11 49–62.
- Granvik ((1916)) Granvik, H. (19162). Zur Frage des zurückbleibens der Bergfinken in Schweden während des Winters 1915–1916. Journal für Ornithologie 64 3 371–378.
- Grodziński & Sawicka-Kapusta ((1970)) Grodziński, W. & Sawicka-Kapusta, K. (1970). Energy values of tree-seeds eaten by small mammals. Oikos 52–58.
- Guéniat ((1948)) Guéniat, E. (1948). Beobachtungen an einem Massenschlafplatz von Bergfinken in der Ajoie im Winter 1946/47. Ornithologischer Beobachter 45 81–98.
- Hafström ((2012)) Hafström, M. (2012). Bergfinkar över Västersjön. YouTube. https://www.youtube.com/watch?v=xY6B61dRaVM
- Haikos ((1950)) Haikos, A. (1950). Ein Einfall von Bergfinken nach zwei Berichten aus den 17. Jahrhundert. Ornithologischer Beobachter 47 176–177.
- Hancock & Weiersbye ((2015)) Hancock, P. & Weiersbye, I. (2015). Birds of Botswana ( 101). : Princeton University Press.
- Hansen ((1954)) Hansen, L. (1954). Birds killed at lights in Denmark 1886–1939. Vidensk. Medd. Naturh. Foren., Kopenhagen 116 269–368.
- Hémery ((1991)) Hémery, G. (1991). Atlas des oiseaux de France en hiver. In D. Yeatman-Berthelot (Ed.), ( 458–459). : Société Ornithologique De France.
- Hémery & Le Toquin ((1975)) Hémery, G. & Le Toquin, A. (19751). Déterminisme énergétique des concentrations de Pinsons du Nord (Fringilla montifringilla) en relation avec l’évolution de la culture du Maïs (Zea mais) en France de 1955 à 1973. Comptes Rendus de l’Academie des Sciences 281 835–838.
- Hémery & Le Toquin ((1975)) Hémery, G. & Le Toquin, A. (19752). Utilisation de la méthode des modèles pour l’étude des dépenses énergétiques des populations de Pinsons du Nord (Fringilla montifringilla) en période internuptiale. Comptes Rendus de l’Academie des Sciences 280 1153–1156.
- Hémery & Le Toquin ((1976)) Hémery, G. & Le Toquin, A. (1976). Dépenses énergétiques des populations hivernantes de pinsons du nord (Fringilla montifringilla) en relation avec leur milieu. La Terre et la Vie 30 52–58 .
- Hémery & Pascaud ((1981)) Hémery, G. & Pascaud, P-N. (1981). Estimation de l’effectif de rassemblements d’oiseaux par thermographie infrarouge. Applicat·ion á un dortoir de Pinsons du Nord (Fringilla montifringilla). L’Oiseau et la Revue francaise d’ornithologie 51 1–16.
- Holmgren ((1866)) Holmgren, E. (1866). Handbok i zoologi for landtbrukare, skogshushållare, fiskeriidkare och jägare, II. delen: Skandinaviens foglar. : P. A. Norstedt & Söner, Stockholm.
- Homan et al. ((2017)) Homan, H., Johnson, R., Thiele, J. & Linz., G. (2017). European starlings. : Wildlife Damage Management Technical Series. USDA, APHIS, WS National Wildlife Research Center. Ft. Collins, Colorado.
- Jenni ((1982)) Jenni, L. (1982). Schweizerische Ringfunde von Bergfinken Fringilla montifringilla: Ein Beitrag zum Problem der Masseneinflüge. Ornithologischer Beobachter 79 265–272.
- Jenni ((1984)) Jenni, L. (1984). Die Bedeutung der Masseneinflüge und Massenschlafplätze in der Winterökologie des Bergfinken: Fringilla montifringilla . : Universität Basel.
- Jenni ((1987)) Jenni, L. (1987). Mass concentrations of bramblings Fringilla montifringilla in Europe 1900-1983: their dependence upon beech mast and the effect of snow-cover. Ornis Scandinavica 18 84–94.
- Jenni ((1991)) Jenni, L. (1991). Microclimate of roost sites selected by wintering Bramblings Fringilla montifringilla. Ornis Scandinavica 22 327–334.
- Jenni ((1993)) Jenni, L. (1993). Structure of a Brambling Fringilla montifringilla roost according to sex, age and body-mass. Ibis 135 1 85–90.
- Jenni & Jenni-Eeiermann ((1987)) Jenni, L. & Jenni-Eeiermann, S. (1987). Body-weight and energy reserves of bramblings in winter. Ardea 75 2 271–284.
- Jenni & Neuschulz ((1985)) Jenni, L. & Neuschulz, F. (1985). Die Masseneinflüge von Bergfinken, Fringilla montifringilla, 1977/1978 und 1982/1983 in der Schweiz: Abhängigkeit von der Schneedecke und vom Nahrungsangebot. Ornithologischer Beobachter 82 85–106.
- Kamp et al. ((2015)) Kamp, J., Oppel, S., Ananin, A.A., Durnev, Y.A., Gashev, S.N., Hölzel, N.Chan, S. (2015). Global population collapse in a superabundant migratory bird and illegal trapping in China. Conservation biology 29 6 1684–1694.
- Kestenholz & Schaffner ((1993)) Kestenholz, M. & Schaffner, W. (1993). Masseneinflüge von Bergfinken Fringilla montifringilla ins Fricktal. Ornitologischer Beobachter 90 297–299.
- Khil et al. ((2011)) Khil, L., Samwald, O., Tiefenbach, A., Tiefenbach, M. & Pacher, H. (2011). Der Massenschlafplatz von Bergfinken Fringilla montifringilla in österreich im Winter 2008/2009. Limicola 25 81–100.
- Kjellén ((2019)) Kjellén, N. (2019). Sträckfågelräkningar vid Falsterbo hösten 2018 / Migration counts at Falsterbo in the autumn of 2018. Meddelande nr. 322 från Falsterbo Fågelstation. In Fåglar i Skåne 2018. : Skånes Ornitologiska Förening.
- Kjellén & Lindström ((1993)) Kjellén, N. & Lindström, Å. (1993). Bergfinkens övervintringsstrategier samt några iakttagelser från en skånsk sovplats i januari–februari 1993. Anser 32 187–199.
- Lindström et al. ((2005)) Lindström, Å., Enemar, A., Andersson, G., Proschwitz, T.v. & Nyholm, N.E.I. (2005). Density-dependent reproductive output in relation to a drastically varying food supply: getting the density measure right. Oikos 110 1 155–163.
- Linz et al. ((2017)) Linz, G.M., Avery, M.L. & Dolbeer, R.A. (2017). Ecology and Management of Blackbirds (Icteridae) in North america. : CRC Press.
- Lithner ((1995)) Lithner, S. (1995). Två miljoner bergfink. Fåglar i Nordvästskåne 1995 6–7.
- Lowe et al. ((2000)) Lowe, S., Browne, M., Boudjelas, S. & De Poorter, M. (2000). 100 of the world’s worst invasive alien species: a selection from the global invasive species database ( 12). : Published by The Invasive Species Specialist Group (ISSG) a specialist group of the Species Survival Commission (SSC) of the World Conservation Union (IUCN), 12pp. First published as special lift-out in Aliens 12, December 2000. Updated and reprinted version: November 2004.
- Manikowski ((1988)) Manikowski, S. (1988). Aerial spraying of quelea. Tropical Pest Management 34 2 133–140.
- Mathiasson ((1960)) Mathiasson, S. (1960). Skånsk fågelvinter. Sveriges Natur 51 2–8.
- McWilliam & Cheke ((2004)) McWilliam, A.N. & Cheke, R.A. (2004). A review of the impacts of control operations against the red-billed quelea ( Quelea quelea) on non-target organisms. Environmental Conservation 130–137.
- Møller & Laursen ((2019)) Møller, A.P. & Laursen, K. (2019). The ecological significance of extremely large flocks of birds. Ecology and Evolution 9 11 6559–6567.
- Mühlethaler ((1952)) Mühlethaler, F. (1952). Beobachtungen am Bergfinken-Schlafplatz bei Thun 1950/51. Ornithologischer Beobachter 49 173–181.
- Murray et al. ((2017)) Murray, G.G., Soares, A.E., Novak, B.J., Schaefer, N.K., Cahill, J.A., Baker, A.J.others (2017). Natural selection shaped the rise and fall of passenger pigeon genomic diversity. Science 358 6365 951–954.
- Nardin & Brauchle ((1979)) Nardin, C. & Brauchle, G. (1979). Un dortoir de Pinsons du Nord. Bull. See. Hist. Nat. Pays de Montbäliard 1979 89–111.
- Nardin & Nardin ((1985)) Nardin, C. & Nardin, G. (1985). Comportements alimentaires chez les Pinsons du Nord, Fringilla montifringilla, en hiver. Nos Oiseaux 38 113–120.
- Newton ((1972)) Newton, I. (1972). Finches ( 55). : Collins.
- Newton ((1998)) Newton, I. (1998). Population limitation in birds. : Academic Press.
- Newton ((2006)) Newton, I. (2006). Advances in the study of irruptive migration. Ardea 94 3 433.
- Newton ((2007)) Newton, I. (2007). The migration ecology of birds. : Elsevier.
- Newton ((2012)) Newton, I. (2012). Obligate and facultative migration in birds: ecological aspects. Journal of Ornithology 153 1 171–180.
- R. Nilsson ((1983)) Nilsson, R. (1983). Om bergfinkens massbesök i kågeröd vintern 1915 - 1916. Anser 22 163–166.
- S.G. Nilsson ((1979)) Nilsson, S.G. (1979). Seed density, cover, predation and the distribution of birds in a beech wood in southern Sweden. Ibis 121 2 177–185.
- Övergaard ((2010)) Övergaard, R. (2010). Seed production and natural regeneration of beech (Fagus sylvatica L.) in southern Sweden . Alnarp: Swedish University of Agricultural Sciences.
- Övergaard et al. ((2007)) Övergaard, R., Gemmel, P. & Karlsson, M. (20071). Effects of weather conditions on mast year frequency in beech (Fagus sylvatica L.) in Sweden. Forestry 80 5 555–565.
- Övergaard et al. ((2007)) Övergaard, R., Gemmel, P. & Karlsson, M. (20072). Tätare och rikligare ollonår ökar chansen för lyckade bokföryngringar. Fakta skog 13 .
- Schifferli ((1953)) Schifferli, A. (1953). Der Bergfinken-Masseneinfall (Fringilla montifringilla) 1950/51 in der Schweiz. Ornithologischer Beobachter 50 3 65–89.
- Sekercioglu ((2006)) Sekercioglu, C.H. (2006). Increasing awareness of avian ecological function. Trends in Ecology & Evolution 21 8 464–471.
- Sutter ((1948)) Sutter, E. (1948). Der Bergfinken-Masseneinfall im Winter 1946/47 in der Schweiz und in Südwestdeutschland. Ornitologischer Beobachter 45 98–106.
- Svensson ((2020)) Svensson, T. (2020). Bibliska mängder bergfink – en berättelse om bokollon, barrträd, bajs och beräkningar. Anser 2020:3 .
- Swedish Meteorological and Hydrological Institute ((2020)) Swedish Meteorological and Hydrological Institute. (2020). Vintern 2020 – Ovanligt rekordrik vinter. Web publication. https://www.smhi.se/klimat/klimatet-da-och-nu/arets-vader/vintern-2020-ovanligt-rekordrik-vinter-1.155690
- Tout ((2019)) Tout, P. (2019). Mega flock of 5 million Brambling in Slovenia. Rare Bird Alert web publication. https://rarebirdalert.co.uk/v2/Content/Mega_flock_of_5_Million_Brambling_in_Slovenia.aspx?s_id=717786275
- Yésou et al. ((2014)) Yésou, P., Debout, G., Erard, C., Pons, J-M. & Thibault, J-C. (2014). Georges Hémery (1952–2013). Disparition d’un éminent biologiste des populations. Revue d’écologie .
- Zabala et al. ((2012)) Zabala, J., Zuberogoitia, I., Belamendia, G. & Arizaga, J. (2012). Micro-habitat use by bramblings Fringilla montifringilla within a winter roosting site: influence of microclimate and human disturbance. Acta Ornithologica 47 2 176–181.
- Zuberogoitia et al. ((2012)) Zuberogoitia, I., Martínez, J.E., Zabala, J., Belamendia, G. & Calvo, J.F. (2012). Solitary hunters sharing an abundant trophic resource: simultaneous hunting by raptors at a brambling winter roost. Journal of Raptor Research 46 3 318–322.