Data Loss Detector: Automatically Revealing Data Loss Bugs in Android AppsConference: Proceedings of the 29th ACM SIGSOFT International Symposium on Software Testing and Analysis; July 18–22, 2020; Virtual Event, USAProceedings of the 29th ACM SIGSOFT International Symposium on Software Testing and Analysis (ISSTA ’20), July 18–22, 2020, Virtual Event, USACCS: Software and its engineering Software testing and debugging
Abstract.
Android apps must work correctly even if their execution is interrupted by external events. For instance, an app must work properly even if a phone call is received, or after its layout is redrawn because the smartphone has been rotated. Since these events may require destroying, when the execution is interrupted, and recreating, when the execution is resumed, the foreground activity of the app, the only way to prevent the loss of state information is to save and restore it. This behavior must be explicitly implemented by app developers, who often miss to implement it properly, releasing apps affected by data loss problems, that is, apps that may lose state information when their execution is interrupted.
Although several techniques can be used to automatically generate test cases for Android apps, the obtained test cases seldom include the interactions and the checks necessary to exercise and reveal data loss faults. To address this problem, this paper presents Data Loss Detector (DLD), a test case generation technique that integrates an exploration strategy, data-loss-revealing actions, and two customized oracle strategies for the detection of data loss failures.
DLD revealed 75% of the faults in a benchmark of 54 Android app releases affected by 110 known data loss faults, and also revealed unknown data loss problems, outperforming competing approaches.
Keywords:
Android, data loss, test case generation, validation, mobile apps.1. Introduction
In the last decade, mobile apps have increasingly gained importance and popularity. Recent studies revealed that people spend more than 3h per day on their smartphones on average (RescueTime:blog 2019) and that 90% of this time is typically devoted to the use of mobile apps (Mobilloud 2019). Indeed, people use mobile apps to perform a huge variety of tasks, including reading e-mails, listening to music, making orders and payments, and playing games.
Among the available ecosystems for the distribution of mobile apps, the Android ecosystem is the largest and most used one: its market share is almost 75% (Statcounter 2020) and its official store, the Google Play Store, includes almost 3.0 millions of apps (Statista 2020).
Android apps consist of components, such as activities, fragments, and services, whose behavior must comply with well-defined lifecycles (Developers [n.d.]e; Developers [n.d.]a; Developers [n.d.]c). For instance, activities can be in states such as created, paused, resumed, and stopped, and transitions between these states produce callbacks that must be handled by the activities.
Interestingly, some of these callbacks might be particularly tricky to implement. This is the case of the callbacks produced by stop-start events, which are system events that may force the destruction and then the (re-)instantiation of a running activity. Stop-start events occur every time the execution of an app is stopped and then resumed. Typical cases include answering a phone call, switching between apps, and rotating the smartphone to change its layout.
When a stop-start event occurs, the difficult task for the app is to handle the destruction of the current activity in a way that is later possible to resume the execution at the same point it was interrupted. This is done by saving the values of all the relevant state variables before the activity is destroyed, and retrieving these values when the execution is resumed. With the exception of some specific cases (e.g., the widgets with a non-empty android:id property), it is a responsibility of the developer to implement this behavior. In particular, developers have to implement both the logic necessary to save the state of an activity in the onSaveInstanceState() callback method and the logic to resume its state in the onRestoreInstanceState() callback method (Developers [n.d.]b). Unfortunately, this implementation might be wrong and might introduce misbehaviors in the apps (Hu and Neamtiu 2011).
When a stop-start event is not properly handled, the Android app is said to be affected by a data loss fault, that is, a fault that causes one or more state variables to lose their values. Data loss faults may affect the correctness of the apps in many different ways. In the best cases, they force the users to enter again inputs that had already been entered, deteriorating the quality of the user experience. In the worst cases, they generate activities with an inconsistent state, which causes the apps to produce wrong outputs or even crashes.
Data loss faults can be extremely pervasive. Adamsen et al. (Adamsen et al. 2015) considered the execution of system events jointly with test suites and reported that all the four apps used in their evaluation were affected by data loss faults. Riganelli et al. (Riganelli et al. 2019) analyzed 428 Android apps and found that at least 82 (19.6%) of the apps were affected by data loss faults. Finally, Amalfitano et al. (Amalfitano et al. 2018) studied 68 open source apps reporting data loss faults in 60 of them (88.2%).
Test case generation techniques could be potentially used to reveal data loss faults. Indeed, a number of automatic test case generation techniques are available for Android apps. For instance, Monkey can generate test cases randomly (Developers [n.d.]d), A3E can generate tests systematically using a depth-first strategy (Azim and Neamtiu 2013), DroidBot (Li et al. 2017) and Stoat (Su et al. 2017) exploit a model-based approach, and Sapienz uses evolutionary algorithms (Mao et al. 2016). While these approaches are able to reveal several interesting faults, they are ineffective against data loss problems for two reasons: (i) they do not include operations that cause stop-start events, and (ii) they are not equipped with oracles strong enough to detect non-crashing data loss failures.
Some techniques have been designed to extend the fault discovery capability of existing test suites to data loss problems. For instance, Thor systematically injects neutral event sequences, including stop-start events, into existing test cases to augment their failure detection capability (Adamsen et al. 2015). Quantum behaves similarly but it starts from a GUI model of the app (Zaeem et al. 2014). Although useful, their applicability is limited to apps equipped with comprehensive test suites or GUI models. ALARic randomly generates test cases that include stop-start events and detects data loss problems by comparing the state of the app under test before and after a stop-start event is generated (Riccio et al. 2018). ALARic can successfully reveal data loss faults, but the adopted exploration strategy and oracles have limited effectiveness, as reported in our evaluation.
In this paper, we present Data Loss Detector (DLD), an automatic testing technique that can reveal data loss problems in Android apps. DLD integrates three capabilities to effectively reveal data loss problems: (i) a biased model-based exploration strategy that steers the exploration towards (new) app states that may be affected by data loss problems, (ii) data-loss-revealing actions that increase the likelihood to expose data loss problems, and (iii) two state-based oracles, a snapshot-based oracle and a property-based oracle, that have a high data loss detection accuracy, especially if used jointly.
Compared to Thor (Adamsen et al. 2015) and Quantum (Zaeem et al. 2014), DLD does not require a pre-existing test suite or a pre-existing GUI model, neither requires an initial ripping phase, but iteratively and continuously generates test cases according to the allocated time budget. Finally, the biased model-based exploration and the data-loss-revealing actions exploited in DLD allow a more effective data loss detection than the strategy implemented in Alaric (Riccio et al. 2018).
We empirically evaluated DLD using the benchmark by Riganelli et al. (Riganelli et al. 2019), which includes 110 data loss problems affecting 54 app releases. DLD automatically detected 83 of the 110 (75%) data loss problems. DLD also revealed 35 data loss faults that were not part of the benchmark, but were reported online in bug reports, and 232 previously unknown data loss faults. Overall DLD revealed three times the data loss faults revealed by competing approaches. We finally submitted the data loss faults that still affect apps nowadays online to app developers who positively reacted to our bug reports.
In a nutshell, this paper makes the following contributions.
- •
It describes an exploration strategy, data-loss-revealing actions, and two state-based oracles that can be incorporated in testing techniques to reveal data loss problems,
- •
It delivers the Data Loss Detector (DLD) technique, which is implemented as an extension of the DroidBot (Li et al. 2017) test case generation tool for Android,
- •
It reports the largest empirical evaluation about data loss detection available so far, considering hundreds of data loss faults,
- •
It delivers the tool and the experimental material freely available online at the following url: https://bit.ly/30XLygW
This paper is organized as follows. Section 2 discusses data loss faults and exemplifies typical failures that can be experienced with Android apps. Section 3 describes the main technical contributions of this paper, including the biased model-based exploration strategy, the data-loss-revealing actions, and the automatic oracles. Section 4 reports empirical results. Section 5 discusses related work. Finally, Section 6 provides final remarks.
2. Data Loss Faults
In this section we describe data loss faults and the Android components that can be affected by these faults: activities and fragments.
An Android activity is a component that implements a screen of an app and the logic to handle that screen. To partition a screen into smaller units, activities can contain a number of fragments, each one containing both some graphical elements and the logic to handle them. Both activities and fragments have their own lifecycle (Developers [n.d.]e; Developers [n.d.]a).


Specific sequences of system events may have a direct impact on the lifecycle of activities and fragments.
Definition 2.0.
A stop-start event is a sequence of system events that may cause a running activity (or fragment) to be destroyed and then recreated11 1 In the rest of the paper we refer only to activities for simplicity, but all the concepts apply to both activities and fragments..
Stop-start events are generated when the execution of an activity must be temporarily suspended. There are many common situations that produce stop-start events. For instance, answering a phone call requires suspending the execution of the app, and thus also of the current activity, until the call ends. Moving an app to the background may cause its activities to be destroyed. When the app is moved again to the foreground, the status of the foreground activity has to be recreated. The rotation of the screen finally causes the destruction of the current activity that must be redrawn with a new layout.
Note that all these situations are neutral from the user’s perspective, that is, they are not expected to change the status of the app: users expect to find the status of an app unchanged after they have answered a phone call, after the app has been moved to the background and then to the foreground, and after the screen has been rotated. However, this behavior is not provided for free by Android, but it must be guaranteed by developers who have to implement the logic to save and retrieve the status of the activities. If this piece of logic is not implemented correctly, stop-start events are no longer neutral and state information might be lost, causing a data loss problem.
Definition 2.0.
A data loss problem occurs when data is accidentally deleted or state variables are accidentally assigned with default or initial values.
Data loss faults can be the source of diverse failures (Jha et al. 2019). Indeed, the initialization of some program variables with wrong values (e.g., to the default value) can be the cause of unpredictable behaviors. Based on our evaluation, we isolated five main failure patterns which are exemplified in Figure 2:
- •
crashes: the app may simply crash. This is exemplified in Figure 2 (a) where the Easy xkcd app crashes after a rotation of the screen.
- •
destroyed GUI elements: some graphical elements may disappear forcing the user to repeat operations. This is exemplified in Figure 2 (b) where the calendar dialog in the Diary app disappears after a rotation of the screen.
- •
phantom GUI elements: some graphical elements may erroneously appear, forcing the user to perform unwanted and unclear interactions. This is exemplified in Figure 2 (c) where a dialog appears in the CycleStreets app after a rotation of the screen.
- •
modified values: some elements may unexpectedly change their values, resulting in misbehaviors of the app. This is exemplified in Figure 2 (d) where multiple text fields change to 0 in the BeeCount app after a rotation of the screen.
- •
compromised internal state: the internal state of the app might be compromised causing visible misbehaviors in the interactions that follow the activation of the data loss. This is exemplified in Figure 2 (e). The initial rotations of the screen compromise the status of the Taskbar app without producing any visibile misbehavior, until the last rotation causes a crash.
3. Data Loss Detector
Data Loss Detector addresses data loss faults combining three key ingredients: (i) a biased model-based exploration strategy, which increases the likelihood to explore states that may expose data loss faults; (ii) data-loss-revealing actions, which interact with the app under test stimulating behaviors that are prone to data loss, and (iii) data loss oracles, which analyze the behavior of the app under test to detect data loss failures.
3.1. Biased Model-Based Exploration
The test case generation strategy implemented in DLD consists in visiting as many states as possible and incrementally testing the newly discovered states to detect data loss faults. To this end, the strategy builds a GUI model that represents the visited states and the executed actions. The model serves two main purposes: to distinguish the already visited (and tested) states from the new ones, and to bias the exploration towards the execution of actions that may potentially lead to states never visited before.
Definition 3.0.
A GUI model is a non-deterministic finite state automaton (, , , ), where is a finite set of abstract states; is the finite set of events that can be triggered from such abstract states, such as clicks, swipes, or stop-start events; is the initial abstract state; is the transition function, which, given and , returns the set of abstract states reachable from by executing .
To effectively test an app, it is important to represent states at an appropriate abstraction level. A too abstract representation would collapse many concrete states into a single abstract state causing several relevant states not being tested for data loss. A too concrete representation would cause an enormous waste of time, testing for data loss states with irrelevant differences. The abstraction level used by DLD derives from the following two observations.
- •
Concrete values do not matter: a GUI state representation might include all the widgets with their properties and values. As a consequence, two concrete states that differ for a single value assigned to a label or to an input field would produce different abstract states that would be tested for data loss. This is a waste of resources, because as long as some values are assigned to the various GUI elements, the data loss is likely to show up regardless of the concrete values assigned to these elements.
- •
Totally ignoring the content of screens is too inaccurate: a GUI state representation might be so abstract to only consider the name of the current Android activity as identifier of the abstract state, that is, the number of abstract states matches with the number of Android activities implemented in the tested app. This strategy totally ignores the content of the screens and is likely to miss all those data loss faults that can be exercised only in a specific state of an activity.
Based on these two observations, DLD uses an abstraction that ignores the concrete values, but still discriminates the relevant distinct states associated with a same Android activity. To this end, it uses the enabledeness abstraction, which has already been used in other contexts to distinguish the states of software applications (De Caso et al. 2011; De Caso et al. 2013), and preliminary experienced in Quantum to reveal GUI interaction faults (Zaeem et al. 2014). In this case, the idea is to distinguish states not based on the content of the screen, but based on the set of actions (i.e., events) that are allowed. Intuitively, it is worth distinguishing states that enable a different set of behaviors for the software. For instance, two different values in an input field produce two different abstract states only if one of the two values enables operations that are otherwise disabled.
Definition 3.0.
An abstract state associated with a concrete state is a pair , where is the name of the current activity in and is the set of events enabled in .
The test case generation strategy is biased towards the execution of new actions that may lead to new (abstract) states potentially affected by data loss. In particular, every time an action is executed, DLD has a probability to choose an event at random, and a probability to choose an event that has never been executed in the current abstract state based on the available GUI model.
DLD can generate five types of actions during the exploration (four actions inherited from DroidBot plus a scroll action added to reach every view in a window), in addition to the data-loss-revealing actions described in next section:
- •
TouchEvent, which executes a tap on an clickable view;
- •
LongTouchEvent, which executes a long tap on a clickable view;
- •
SetTextEvent, which writes text inside an editable view;
- •
KeyEvent, which presses a navigation button (e.g. “Home”).
- •
ScrollEvent, which executes a swipe on a scrollable view;
DLD incrementally updates the GUI model after the execution of every event. The testing activity stops after a budget that can be expressed as a number of actions to be performed or as an amount of time to be allocated for testing.
3.2. Data-Loss-Revealing Actions
The exploration activity described in Section 3.1 is combined with the execution of data-loss-revealing actions that have the objective to reveal data loss problems, if present.
DLD includes two data-loss-revealing actions: one is executed systematically every time a new abstract state is reached (systematic data-loss-revealing action), while the other is executed probabilistically at every abstract state (probabilistic data-loss-revealing action).
The systematic data-loss-revealing action is composed of the following sequence of steps:
- (1)
fill-in: DLD interacts with all the input views (e.g., text field, combo box, check box) entering non-empty values different from the default values,
- (2)
save state: the current GUI state is saved to later check if any data loss occurred. The way the state is saved depends on the oracle strategy adopted (see Section 3.3),
- (3)
double screen rotation: the screen rotation is a stop-start event. It is executed twice to reach a state that should be exactly the same that was saved, if no data loss occurred,
- (4)
check state: the current GUI state is compared to the saved state to determine if any data loss occurred. The way the comparison is performed depends on the oracle strategy (see Section 3.3),
- (5)
scroll down: some Android activities may include visual elements that span over the size of the screen. To make sure the reached abstract state is fully tested for data loss, including the elements that might be outside the screen, if the check state step has not revealed a data loss, DLD executes a scroll down action that may make new elements appear. If this happens, a new abstract state might be reached, which would be again systematically tested for data loss.
The systematic data-loss-revealing action already guarantees an accurate validation of the state space, as defined by our abstraction strategy. However, there might be certain data loss faults that depend on internal state information that does not produce any difference in the GUI state of the app. For instance, the window for setting a timer in the AntennaPod app generates a data loss only if a podcast has been loaded before from another window. The fact that a podcast was loaded does not result in any visible difference in the timer window, and thus the abstraction strategy cannot capture the difference between the state that exposes the data loss fault and the one that does not. To address these cases, when an already visited state is encountered, DLD enables the probabilistic data-loss-revealing action that has the same probability of the other actions to be selected. The probabilistic data-loss-revealing action performs the sequence of events from step 2 to 4 of the systematic data-loss-revealing action.
In a nutshell, the exploration works as follows. When a new abstract state is encountered, DLD executes the systematic data-loss-revealing action. Otherwise, DLD identifies the set of actions that can be executed on the current GUI state based on the five types of supported actions (see Section 3.1). Namely a subset of them, , has already been executed based on the GUI model, while the others, , have not been executed yet. DLD executes with probability a random action, that is, an action in the set , and with probability an action that has not been executed yet, that is, an action in .
3.3. Data Loss Oracles
Data loss problems do not always cause crashes. On the contrary, apps can present a range of misbehaviors as discussed in Section 2. DLD uses oracles based on the fact that the operations that exercise the data loss faults are expected to be neutral, thus leaving the status of the app unchanged. As anticipated in Section 3.2, the basic DLD strategy is to collect the GUI state of the app before and after the execution of actions that may have triggered a data loss failure and compare the states to detect it.
DLD defines two oracle strategies, which can be used either independently or jointly: the snapshot-based oracle and the property-based oracle. The snapshot-based oracle takes a screenshot of the app before and after a data loss might have occurred and compares the images to detect failures. The property-based oracle analyzes the GUI state and collects all the views and all their properties, and compares these two sets of properties to detect failures. Figure 3 shows the state information captured by the snapshot-based and the property-based oracles for a same GUI state of the OpenVPN app. The former oracle stores a screenshot of the app, as shown in Figure 3 (a), while the latter oracle stores the properties of the views in Python dictionary format, as shown in Figure 3 (b).

More rigorously, the two oracle strategies collect and compare state information as follows.
- Snapshot-based oracle:
-
State Information: DLD first takes a screenshot of the device. The recorded image is then converted into a grayscale image, which is faster to compare than a colourful image. Finally, DLD crops the header and the footer of the image because it contains information that changes over time regardless of data loss, such as the current time and the battery level. The resulting image is the retrieved representation of the current state.
State Comparison: DLD compares the two states by comparing the two corresponding images pixel by pixel. Since a blinking cursor might cause a small level of noise in the representation of the images, the comparison fails only if more than 15 pixels every 10,000 pixels are different. - Property-based oracle:
-
State Information: DLD retrieves all the views, including their properties and their hierarchical organization. The retrieved values are represented in a Python dictionary format.
State Comparison: DLD compares the two states by comparing their Python-based representation. The comparison fails if one of the attribute values is different or the hierarchical structure of the views is not preserved.
Note that although the two strategies may seem redundant, they are not, as confirmed by our experiments. In particular, there are a number of data loss problems that can only be detected by one strategy. For instance, Figure 4 shows the case of a data loss failure that has been detected by the property-based oracle only. In fact, the two snapshots of the MALP app are visually identical, but actually the content descriptor has changed its value. On the other hand, Figure 5 shows the case of a data loss failure that has only been detected by the snapshot-based oracle. The set of properties, not shown in the figure, are exactly the same for the two states, but the app has lost the zoom, as clearly visible from the snapshots.
Interestingly, the two oracles can be combined, so that a failure is reported if just one of the two oracle strategies reports a failure.


4. Evaluation
This section presents the empirical results obtained by experimenting DLD with a benchmark of 110 data loss faults, in comparison to the ALARic (Riccio et al. 2018) and Quantum (Zaeem et al. 2014) test case generation techniques. We first describe our implementation of DLD, we then introduce the research questions and the subject applications. We finally present the results obtained for each research question in details, and discuss threats to validity.
4.1. Implementation
We implemented DLD as an extension of DroidBot (Li et al. 2017), which is a state-of-the-art test case generator for Android that does not implement features for the detection of data loss faults. DLD inherits from DroidBot the capability to perform a specific sequence of actions before testing a target app. This feature can be used to setup the initial state of the app under test. In our evaluation, we used this capability to: authenticate into the apps that require a log in, setup an initial project in MGit, and grant permissions in QuickLyric.
As outcome of the testing process, DLD generates both a report with the revealed data loss faults and reproducible test cases. Each data loss is described in terms of the screenshots and the set of GUI properties collected before and after the data loss is observed. DLD is available at https://bit.ly/30XLygW.
4.2. Research Questions
We evaluate DLD by studying the following five research questions.
- •
RQ0 - What is the that provides the best exploration? This research question studies the impact of the parameter on the effectiveness of the exploration. The result of this research question is used to configure DLD to address the other research questions.
- •
RQ1 - How effective is DLD with data loss problems? This research question investigates the effectiveness of DLD considering two perspectives captured by the following sub-RQs.
- –
RQ1.1 - What is the data loss discovery capability of DLD?
- –
RQ1.2 - What is the rate of the spurious oracle violations reported by DLD?
- –
- •
RQ2 - Is DLD more effective than state-of-the-art techniques? This research question is decomposed into the following sub-RQs.
- –
RQ2.1 - What is the relative effectiveness of DLD, ALARic, and Quantum? This sub-RQ compares DLD to ALARic and Quantum.
- –
RQ2.2 - What are the main factors that determine the effectiveness of DLD? This sub-RQ investigates the factors that allow DLD to reveal more data loss faults than competing techniques.
- –
- •
RQ3 - What is the tradeoff between the snapshot- and property-based oracles? This research question investigates the tradeoff between the two oracle strategies, measuring the data loss faults revealed by the snapshot-based oracle only, by the property-based oracle only, and by both.
- •
RQ4 - Are data loss faults relevant to developers? This research question studies how app developers react to the presence of data loss problems in their apps.
4.3. Subject Applications
In our empirical evaluation we used the benchmark by Riganelli et al. (Riganelli et al. 2019), which includes 110 data loss problems affecting a total of 48 Android apps and 54 app releases. Each data loss fault is equipped with an Appium test case (Foundation [n.d.]) that can be executed to reproduce the problem. All the experiments have been conducted with the Genymotion v3.0.2 Android emulator using an emulated Google Nexus 5 device equipped with Android 6.0 API 23 and 2 GB of RAM. In the evaluation, we followed the practice of other studies (Wang et al. 2018) performing three runs of 3 hours each per tested app for both DLD and ALARic, for a total of 42 days of uninterrupted computation.
4.4. RQ0 - What is the that provides the best exploration?
This research question investigates the impact of the parameter on the effectiveness of the approach. To perform this initial study we selected 3 apps from the benchmark. To cover the range of situations that might be faced with the full benchmark, we selected the apps with the smallest, medium, and highest number of activities, which are Equate (2 activities), Calendar Notification (13 activities), and Twidere (52 activities), respectively.
To assess the capability to explore the app and potentially reveal data loss problems we measured activity coverage, which is the percentage of activities covered in a test session. We started with , which consists of a strategy that always privileges the execution of actions that have not been executed before, based on the incrementally constructed GUI model. We then increased the parameter by 0.1 to study its impact on the results. We stopped with , which produced a significant decrease on the effectiveness of the exploration. Results are summarized in Table 1. We finally selected to address the other research questions.
| Activity Coverage | |
|---|---|
| (always new actions) | 52% |
| (random actions with probability 0.1) | 60% |
| (random actions with probability 0.2) | 44% |
4.5. RQ1 - How effective is DLD with data loss problems?
This research question investigates the capability of DLD to reveal the data loss problems in the benchmark. To answer this research question, we manually analyzed every report produced by DLD to distinguish the actual data loss problems from the irrelevant spurious violations. In particular, we classified a reported data loss as spurious if one of the two following conditions holds: (i) the state of the app after the double screen rotation is taken too early, while the activity is still recreating, making the oracle to fail its check or (ii) the difference reported by the oracle cannot be considered a data loss (e.g., because the tested app shows the current time which obviously changes after the screen has been rotated twice). In the vast majority of the cases the reports were enough to classify data loss problems. We reproduced the problem in the unclear cases. For this research question, we detected data loss problems using both the snapshot-based and the property-based oracles. We analyze their relative fault detection ability with RQ3.
We checked each data loss problem revealed by DLD, distinguishing if it is a benchmark data loss, that is, a problem that is part of the benchmark we used; an online data loss, that is, a problem already reported online that is not part of the benchmark (for all the apps in the benchmark we searched online for additional data loss faults, and we used the snapshots, the activity name and the fields reported to lose their values to determine if a discovered data loss matches with the online data loss), or a new data loss, that is, an unknown data loss problem (to the best of our ability to search for reported problems). We refer to the union of the benchmark and online data loss faults as the known data loss faults.
We report the number of activities affected by a data loss problem found by DLD. They intuitively correspond to different faults and different fixes to be implemented in different activities. The only exception is with the known data loss faults. Since some of the data loss faults in the benchmark affect the same activity, we actually report the precise number of faults in the benchmark that have been revealed. Finally, when only spurious violations are detected for an activity, we report it as a spurious data loss.
| DLD | ALARic | |||||||||||||||||||||||||||||||||||||||||||
| App name | Release | # Activities |
|
|
|
|
|
|
Crashes |
|
|
|
|
| ||||||||||||||||||||||||||||||
| Amaze File Manager | v3.1.0-beta.1 | 4 | 100% (100%) | 3 | 3 (3)/5 | 2 (2)/2 | 1(1) | 0 (0) | 1 | 1 | 1 (1)/5 | 0 (0)/2 | 0 (0) | 0 (0) | ||||||||||||||||||||||||||||||
| AntennaPod | v1.5.2.0 | 16 | 33% (44%) | 5 | 5 (5)/7 | 2 (2)/11 | 3 (3) | 1 (1) | 1 | 1 | 0 (0)/7 | 1 (1)/11 | 0 (0) | 0 (0) | ||||||||||||||||||||||||||||||
| BeeCount | v2.4.7 | 8 | 96% (100%) | 7 | 1 (1)/3 | 1 (1)/5 | 5 (5) | 1 (1) | 0 | 5 | 0 (0)/3 | 0 (0)/5 | 5 (5) | 1 (1) | ||||||||||||||||||||||||||||||
| BookCatalogue | v5.2.0-RC3a | 35 | 66% (71%) | 21 | 5 (6)/7 | - | 12 (15) | 0 (0) | 1 | 7 | 2 (2)/7 | - | 4 (5) | 6 (7) | ||||||||||||||||||||||||||||||
| Calendar Notification | v3.14.159 | 13 | 67% (69%) | 8 | 3 (3)/3 | 1 (1)/1 | 4 (5) | 0 (0) | 1 | 2 | 1 (1)/3 | 0 (0)/1 | 1 (1) | 0 (0) | ||||||||||||||||||||||||||||||
| CycleStreets | v3.5 | 11 | 55% (55%) | 6 | 1 (1)/1 | - | 5 (5) | 0 (0) | 0 | 1 | 1 (1)/1 | - | 0 (0) | 0 (0) | ||||||||||||||||||||||||||||||
| Diary | v1.26 | 3 | 100% (100%) | 3 | 1 (2)/2 | - | 2 (2) | 0 (0) | 0 | 2 | 1 (1)/2 | - | 1 (1) | 0 (0) | ||||||||||||||||||||||||||||||
| DNS66 | v0.3.3 | 5 | 100% (100%) | 3 | 1 (1)/1 | - | 2 (2) | 0 (0) | 0 | 1 | 0 (0)/1 | - | 1 (1) | 2 (2) | ||||||||||||||||||||||||||||||
| Document Viewer | v2.7.9 | 9 | 48% (56%) | 2 | 1 (1)/1 | - | 2 (2) | 1 (1) | 0 | 1 | 1 (1)/1 | - | 0 (0) | 4 (4) | ||||||||||||||||||||||||||||||
| Easy xkcd | v6.0.4 | 9 | 74% (78%) | 4 | 1 (1)/1 | - | 3 (3) | 0 (0) | 3 | 1 | 0 (0)/1 | - | 1 (1) | 1 (1) | ||||||||||||||||||||||||||||||
| Equate | v1.6 | 2 | 100% (100%) | 2 | 2 (2)/2 | 1 (1)/1 | 1 (1) | 0 (0) | 1 | 1 | 2 (2)/2 | 1 (1)/1 | 0 (0) | 0 (0) | ||||||||||||||||||||||||||||||
| Etar Calendar | v1.0.10 | 12 | 42% (42%) | 3 | 4 (4)/5 | 2 (3)/5 | 1 (1) | 0 (0) | 0 | 0 | 0 (0)/5 | 0 (0)/5 | 0 (0) | 0 (0) | ||||||||||||||||||||||||||||||
| Firefox Focus | v4.0 | 6 | 44% (50%) | 3 | 0 (0)/1 | - | 3 (3) | 0 (0) | 0 | 2 | 0 (0)/1 | - | 2 (2) | 0 (0) | ||||||||||||||||||||||||||||||
| Flym | v1.3.4 | 6 | 83% (83%) | 4 | 0 (0)/1 | - | 4 (4) | 0 (0) | 0 | 3 | 0 (0)/1 | - | 3 (3) | 0 (0) | ||||||||||||||||||||||||||||||
| Gadgetbridge | v0.25.1 | 20 | 28% (30%) | 4 | 1 (1)/1 | - | 2 (3) | 2 (2) | 2 | 0 | 0 (0)/1 | - | 0 (0) | 0 (0) | ||||||||||||||||||||||||||||||
| KISS Launcher | v2.25.0 | 2 | 100% (100%) | 1 | 1 (1)/1 | - | 0 (0) | 1 (1) | 0 | 1 | 0 (0)/1 | - | 1 (1) | 0 (0) | ||||||||||||||||||||||||||||||
| Loop Habit Tracker | v1.6.2 | 7 | 71% (71%) | 4 | 2 (2)/6 | - | 1 (2) | 1 (1) | 0 | 2 | 0 (0)/6 | - | 2 (2) | 2 (2) | ||||||||||||||||||||||||||||||
| MALP | 3d31062 | 2 | 100% (100%) | 1 | 1 (1)/1 | - | 0 (0) | 0 (0) | 1 | 0 | 0 (0)/1 | - | 0 (0) | 0 (0) | ||||||||||||||||||||||||||||||
| MALP | v1.1.0 | 4 | 33% (50%) | 2 | 2 (3)/4 | - | 1 (1) | 0 (0) | 1 | 1 | 0 (0)/4 | - | 1 (1) | 0 (0) | ||||||||||||||||||||||||||||||
| MTG Familiar | v3.5.5 | 2 | 50% (50%) | 1 | 1 (1)/1 | - | 0 (0) | 0 (0) | 0 | 1 | 0 (0)/1 | - | 1 (1) | 0 (0) | ||||||||||||||||||||||||||||||
| Notepad | v2.3 | 3 | 67% (67%) | 2 | 1 (1)/1 | - | 1 (1) | 0 (0) | 0 | 1 | 1 (1)/1 | - | 0 (0) | 0 (0) | ||||||||||||||||||||||||||||||
| Omni Notes | v5.4.3 | 17 | 29% (35%) | 4 | 0 (0)/1 | - | 4 (4) | 0 (0) | 0 | 1 | 0 (0)/1 | - | 1 (1) | 1 (1) | ||||||||||||||||||||||||||||||
| OpenTasks | v1.1.13 | 9 | 78% (78%) | 7 | 1 (1)/1 | - | 6 (6) | 0 (0) | 0 | 3 | 0 (0)/1 | - | 3 (3) | 1 (1) | ||||||||||||||||||||||||||||||
| OpenVPN for Android | v0.7.5 | 13 | 46% (46%) | 5 | 1 (1)/1 | - | 4 (4) | 0 (0) | 1 | 4 | 0 (0)/1 | - | 3 (4) | 1 (1) | ||||||||||||||||||||||||||||||
| PassAndroid | v3.3.3 | 14 | 36% (36%) | 4 | 2 (3)/3 | 8 (8)/8 | 1 (1) | 0 (0) | 1 | 3 | 1 (1)/3 | 4 (4)/8 | 1 (1) | 1 (1) | ||||||||||||||||||||||||||||||
| Periodic Table | v1.1.1 | 3 | 100% (100%) | 3 | 2 (2)/2 | - | 1 (1) | 0 (0) | 0 | 0 | 0 (0)/2 | - | 0 (0) | 2 (2) | ||||||||||||||||||||||||||||||
| Port Knocker | v1.0.8 | 6 | 50% (50%) | 2 | 2 (2)/3 | 0 (0)/1 | 0 (0) | 0 (0) | 0 | 2 | 0 (0)/3 | 0 (0)/1 | 2 (2) | 1 (1) | ||||||||||||||||||||||||||||||
| Prayer Times | v3.6.6 | 22 | 32% (36%) | 8 | 3 (6)/7 | 1 (1)/2 | 4 (5) | 0 (0) | 1 | 5 | 1 (1)/7 | 0 (0)/2 | 3 (4) | 0 (0) | ||||||||||||||||||||||||||||||
| QuasselDroid | v0.11.5 | 5 | 40% (40%) | 2 | 1 (1)/1 | - | 1 (1) | 0 (0) | 1 | 0 | 0 (0)/1 | - | 0 (0) | 1 (1) | ||||||||||||||||||||||||||||||
| Simple Draw | v3.1.5 | 7 | 86% (86%) | 3 | 0 (0)/1 | - | 3 (3) | 0 (0) | 0 | 0 | 0 (0)/1 | - | 0 (0) | 1 (1) | ||||||||||||||||||||||||||||||
| Simple File Manager | v2.6.0 | 8 | 88% (88%) | 5 | 1 (1)/1 | - | 3 (4) | 0 (0) | 2 | 1 | 1 (1)/1 | - | 0 (0) | 1 (1) | ||||||||||||||||||||||||||||||
| Simple File Manager | v3.2.0 | 8 | 75% (75%) | 5 | 1 (1)/1 | - | 3 (4) | 0 (0) | 1 | 1 | 1 (1)/1 | - | 0 (0) | 0 (0) | ||||||||||||||||||||||||||||||
| Simple Gallery | v1.50 | 11 | 48% (55%) | 5 | 1 (2)/4 | 1 (1)/7 | 3 (3) | 0 (0) | 0 | 1 | 1 (1)/4 | 0 (0)/7 | 0 (0) | 1 (1) | ||||||||||||||||||||||||||||||
| Simple Solitaire | v2.0.1 | 7 | 93% (100%) | 2 | 1 (1)/1 | - | 1 (1) | 0 (0) | 1 | 1 | 0 (0)/1 | - | 1 (1) | 2 (2) | ||||||||||||||||||||||||||||||
| Simpletask | v10.0.7 | 11 | 67% (73%) | 7 | 1 (1)/1 | - | 6 (6) | 0 (0) | 1 | 4 | 1 (1)/1 | - | 3 (3) | 0 (0) | ||||||||||||||||||||||||||||||
| Syncthing | v0.9.5 | 9 | 93% (100%) | 8 | 3 (4)/5 | 2 (2)/2 | 4 (5) | 1 (1) | 2 | 2 | 1 (1)/5 | 1 (1)/2 | 0 (0) | 0 (0) | ||||||||||||||||||||||||||||||
| Taskbar | v3.0.3 | 21 | 26% (29%) | 3 | 2 (2)/2 | 12 (13)/13 | 2 (2) | 1 (1) | 1 | 1 | 1 (1)/2 | 1 (1)/13 | 0 (0) | 0 (0) | ||||||||||||||||||||||||||||||
| Tasks Astrid To-Do List Clone | v6.0.6 | 45 | 19% (27%) | 10 | 0 (0)/1 | - | 7 (10) | 1 (1) | 2 | 1 | 0 (0)/1 | - | 1 (1) | 0 (0) | ||||||||||||||||||||||||||||||
| Vespucci Osm Editor | v10.2 | 19 | 42% (47%) | 7 | 1 (1)/1 | - | 5 (6) | 1 (1) | 0 | 5 | 1 (1)/1 | - | 4 (4) | 0 (0) | ||||||||||||||||||||||||||||||
| Vlille Checker | v4.4.0 | 6 | 67% (67%) | 3 | 1 (1)/1 | - | 2 (2) | 0 (0) | 0 | 1 | 0 (0)/1 | - | 1 (1) | 0 (0) | ||||||||||||||||||||||||||||||
| WiFiAnalyzer | 1.9.2 | 4 | 75% (75%) | 3 | 3 (3)/3 | - | 1 (1) | 0 (0) | 0 | 0 | 0 (0)/3 | - | 0 (0) | 0 (0) | ||||||||||||||||||||||||||||||
| World Clock & Weather | v1.8.6 | 4 | 100% (100%) | 4 | 0 (0)/1 | - | 4 (4) | 0 (0) | 0 | 1 | 0 (0)/1 | - | 1 (1) | 1 (1) | ||||||||||||||||||||||||||||||
| TOTAL | 428 | 65% (68%) | 189 | 73/97 | 35/58 | 132 | 0.26 (11) | 26 | 71 | 19/97 | 8/58 | 50 | 0.74 (31) | |||||||||||||||||||||||||||||||
| Apps tested after initial setup actions | ||||||||||||||||||||||||||||||||||||||||||||
| Conversations | v1.14.0 | 21 | 41% (57%) | 6 | 0 (0)/1 | - | 5 (6) | 0 (0) | 1 | |||||||||||||||||||||||||||||||||||
| Conversations | v1.23.8 | 23 | 40% (57%) | 10 | 1 (1)/1 | - | 6 (9) | 0 (0) | 0 | |||||||||||||||||||||||||||||||||||
| K-9 Mail | v5.010 | 28 | 41% (46%) | 8 | 0 (0)/1 | - | 6 (8) | 0 (0) | 1 | |||||||||||||||||||||||||||||||||||
| K-9 Mail | v5.207 | 27 | 51% (63%) | 7 | 1 (1)/1 | - | 5 (7) | 0 (0) | 1 | |||||||||||||||||||||||||||||||||||
| K-9 Mail | v5.401 | 29 | 54% (59%) | 8 | 1 (1)/1 | - | 6 (7) | 0 (0) | 1 | |||||||||||||||||||||||||||||||||||
| Mgit | v1.5.0 | 10 | 97% (100%) | 9 | 1 (1)/1 | - | 7 (8) | 1 (1) | 2 | |||||||||||||||||||||||||||||||||||
| OctoDroid | v4.0.3 | 44 | 56% (66%) | 21 | 2 (2)/2 | - | 16 (19) | 0 (0) | 3 | |||||||||||||||||||||||||||||||||||
| OctoDroid | v4.2.0 | 46 | 44% (57%) | 22 | 1 (1)/1 | - | 17 (21) | 1 (2) | 0 | |||||||||||||||||||||||||||||||||||
| QuickLyric | v2.1 | 4 | 75% (75%) | 3 | 1 (1)/1 | - | 2 (2) | 0 (0) | 0 | |||||||||||||||||||||||||||||||||||
| SMS Backup Plus | v1.5.11-Beta18 | 7 | 14% (14%) | 1 | 1 (1)/1 | - | 0 (0) | 0 (0) | 0 | |||||||||||||||||||||||||||||||||||
| Tusky for Mastodon | v1.0.3 | 12 | 78% (83%) | 8 | 1 (1)/1 | - | 7 (7) | 0 (0) | 3 | |||||||||||||||||||||||||||||||||||
| Twidere | v3.7.3 | 52 | 14% (17%) | 6 | 0 (0)/1 | - | 6 (6) | 0 (0) | 0 | |||||||||||||||||||||||||||||||||||
| TOTAL (all apps) | 731 | 62% (66%) | 298 | 83/110 | 35/58 | 232 | 0.26 (14) | 38 | ||||||||||||||||||||||||||||||||||||
Table 2 column DLD (left part of the table) shows the results that DLD obtained for all the app releases considered in the study. Since every row represents the outcome of three runs, when applicable, we report both average values and total values. Column # Activities indicates the total number of activities in each app. Column Activity Coverage avg (total) reports the activity coverage achieved in average and in total in the three executions. Column Activities with Data Loss indicates the number of activities affected by at least a data loss revealed by DLD. Column Benchmark Data Loss avg (total)/existing indicates the average and total number of data loss faults that have been revealed by DLD out of the ones present in the benchmark. For example in the BookCatalogue app, DLD revealed 5 data loss faults of the benchmark on average, achieved a total of 6 data loss faults revealed across the three runs, out of a total of 7 data loss faults present in the benchmark. Similarly, column Online Data Loss avg (total)/existing indicates the average and total number of data loss faults reported online revealed by DLD. Column New Data Loss avg (total) indicates the average and total number of previously unknown data loss faults revealed. Column Spurious Data Loss avg (total) indicates the average and total number of activities that originated spurious violations only. Column Crashes reports the total number of activities that crashed due to data loss faults. The top part of the table lists the apps where no initial setup has been necessary, while the bottom part of the table lists the apps that have been addressed as discussed in Section 4.1.
4.5.1. RQ1.1 - What is the data loss discovery capability of DLD?
In terms of exploration, DLD managed to visit 66% of the activities, revealing 298 activities affected by data loss faults (41% of the total number of activities). It detected 83 of the 110 faults in the benchmark (75%), 35 out of the 58 (60%) additional data loss faults that we found online, and revealed 232 new data loss faults (an average of 4.3 new data loss faults revealed per app). In total, DLD revealed 350 data loss problems in 54 app releases, demonstrating a significant capability to detect data loss problems. Note that we started the empirical investigation knowing that less than 110 activities were affected by data loss problems and we ended up discovering 298 activities affected by data loss problems. Interestingly, the probabilistic data-loss-revealing action contributed revealing data loss in 158 activities already reported by the systematic action and in 17 activities not reported by the systematic data-loss-revealing action.
We manually investigated the 50 cases of known data loss faults that have not been revealed by DLD (27 cases in the benchmark and 23 cases retrieved online). We isolated three main reasons why data loss problems have been missed.
- •
Low probability sequences: revealing these data loss failures requires the generation of an event sequence that has a low probability to be generated, due to the length of the sequence and/or the large number of actions that can be generated at every step of the testing process.
- •
Environment setup: the detection of these data loss problems requires a specific set up of the environment. For instance, a data loss affecting the Document Viewer app requires the presence of a document to be revealed. These faults could be potentially revealed with additional effort in the setup of the app under test.
- •
Unsupported actions: these data loss failures are impossible to reveal with DLD because they require the execution of operations that are outside the scope of DLD. For instance, detecting one of the data loss faults in the Tasks Astrid To-Do List Clone app requires to temporarily exit from the app and take a picture with the device camera, which cannot be done with DLD.
Overall, we found 41 data loss problems that simply have low probability to be revealed, 4 data loss problems that require a proper environment setup, and 5 data loss problems that require a more extensive exploration ability to be revealed. Interestingly, several faults might be potentially revealed by just executing DLD for a longer time, or by refining the DLD exploration strategy, so that specific combinations of actions are generated. However, generating complex and long combinations of actions can be challenging.
Finally, only 38 out of 298 activities affected by data loss faults produced crashes, which confirms the need of specific oracles to deal with these problems.
4.5.2. RQ1.2 - What is the rate of the spurious oracle violations reported by DLD?
DLD performed well in terms of spurious oracle violations: it reported only 1 activity with spurious data loss only every 4 tested apps, which indicates that DLD is precise and seldom annoys testers with false alarms.
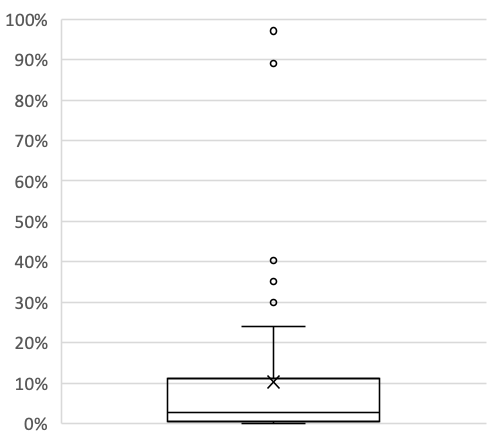
Figure 6 shows the percentage of spurious oracle violations returned per app. The percentage ranges between a min of 0% and a max of 24%, with a mean value of 10.4% and a median value of 2.7%. Indeed, DLD produces a limited percentage of spurious violations (less than 11% for 75% of the apps) that can be feasibly inspected by engineers when analyzing the output produced by the technique. The 5 outliers reported in Figure 5 correspond to apps with elements difficult to handle, such as timers and progress bars, that can be the source of an abnormal number of spurious violations due to spontaneous changes happening concurrently with the double rotations. We discuss the source of these spurious violations in RQ3.
4.6. RQ2 - Is DLD more effective than state-of-the-art techniques?
This research question compares DLD to both ALARic (Riccio et al. 2018) and Quantum (Zaeem et al. 2014). ALARic represents the case of an alternative automated approach to reveal data loss faults, while Quantum represents the case of an approach that can benefit from a manually generated model to generate data loss-revealing test cases.
4.6.1. RQ2.1 - What is the relative effectiveness of DLD, ALARic, and Quantum?
The comparison to ALARic studies the effectiveness of the test generation strategy defined in DLD, as described in Section 3, to ALARic, which uses a random (non-biased) exploration and a concrete states representation.
We executed ALARic three times for 3 hours each time, as done for DLD, and reported the results in Table 2 (column ALARic). Note that we excluded from the comparison the apps that have been tested with DLD exploiting an ad-hoc setup, since it would lead to an unfair comparison to ALARic, which does not implement this feature. Table 2 shows with grey background the cases where a technique outperforms the other.
DLD significantly outperformed ALARic in terms of data loss discovery capability. In fact, ALARic revealed 71 activities affected by data loss faults, while DLD revealed 189 faulty activities, releasing a 2.7X factor of improvement. ALARic found 19 data loss faults of the benchmark, 8 online data loss faults, and 50 new data loss faults. While DLD revealed 73 of the data loss faults in the benchmark (3.8X improvement factor), 35 online data loss faults (4.4X improvement factor), and 132 new data loss (2.6X improvement factor). Overall, DLD revealed significantly more data loss faults than ALARic.
DLD performed better than ALARic also in terms of spurious data loss. In fact, DLD produced spurious data loss only for 11 activities, while ALARic produced spurious data loss for 31 of the activities.
In summary, DLD has been significantly more effective than ALARic with the studied apps.
Since Quantum is not publicly available, we could not compare Quantum to DLD on our set of apps. We thus executed DLD for 3 hours on the same apps used in the evaluation of Quantum (Zaeem et al. 2014) and compared the results. We limited the experiment to 4 of the 6 apps used to evaluate Quantum since for 2 apps it was impossible to retrieve the same version used in the original study.
Since we do not know the manual effort that was necessary to manually define the models used by Quantum, it is hard to setup a fair comparison among the two approaches. However, the obtained results can still offer useful insights about the relative effectiveness of the two approaches.
| Quantum | DLD | |||
|---|---|---|---|---|
| App (Version) | (with manual model) | (automatic) | ||
| data | spurious | data | spurious | |
| loss | violation | loss | violation | |
| OpenSudoku (1.1.5) | 3 | 2 | 5 | 1 |
| Nexes Manager (2.1.8) | 7 | 2 | 11 | 1 |
| VuDroid (1.4) | 2 | 0 | 2 | 0 |
| K9Mail (4.317) | 4 | 1 | 15 | 2 |
Table 3 shows the distinct data loss and spurious violations reported by Quantum and DLD. Although DLD cannot benefit from a manual model, its activity has been more effective in revealing a number of data loss faults compared to Quantum. Of course, we do not know if the data loss faults revealed by DLD include all the data loss faults revealed by Quantum. It might be the case that DLD cannot reach some areas of the app under test that can be reached with the manual model. However, the results suggest that DLD is quite effective even compared to techniques exploiting manual models.
4.6.2. RQ2.2-What are the main factors that determine the effectiveness of DLD?
To investigate the reason of the difference in the performance between DLD and ALARic, we studied the reason why ALARic failed to reveal faults revealed by DLD. In particular, we counted the number of faulty activities not reached by ALARic and the number of faulty activities reached by ALARic without revealing the data loss fault. This produced the following results:
- •
ALARic does not reach 52% of the faulty activities revealed by DLD only, that is, approximatively half of the additional data loss faults revealed by DLD are due to a better exploration strategy,
- •
ALARic reaches the faulty activity without revealing the data loss for 48% of the faulty activities revealed by DLD only. In a nutshell, the systematic fine-grained testing of the states implemented in DLD is more effective than Alaric’s strategy,
- •
12 of the faulty activities missed by Alaric require a snapshot-based oracle to be revealed, but only 4 of them are reached by ALARic.
4.7. RQ3 - What is the tradeoff between the snapshot- and property-based oracles?
This research question investigates the complementarity between the snapshot-based and the property-based oracles. We already discussed in Section 3.3 the qualitative differences between these two types of oracles, and reported examples of data loss faults that could be detected by one type of oracle only. Here, we assess quantitatively the impact of each class of oracles, on both the revealed data loss faults and the spurious oracle violations.
Figure 7 shows the percentage of data loss faults detected and the number of spurious oracle violations produced by one-strategy only, either snapshot-based or property-based, or both of them. In the case of the spurious violations we have an additional category that is the violations caused by slow activity recreation after screen rotation, as anticipated in the Section discussing RQ1.
None of the two approaches have been able to reveal every data loss problem. A large proportion of the failures (73.1%) have been detected by both oracles, which implies that most of the data loss faults cause both properties that lose their values and visible issues on the app. However, there are yet 26.9% of the faults that require a specific type of oracle to be revealed.
In terms of absolute failure discovery ability, both oracles have been effective, with the property-based and snapshot-based oracles revealing 90.9% and 82.3% of the failures, respectively.
A small number of the spurious oracle violations (5.3%) is caused by a slow activity recreation, which causes the oracles to retrieve incorrect state information. This percentage can be reduced or eliminated by carefully tuning the timing of the oracles.
Interestingly, the property-based oracle is also more effective in terms of spurious violations reported. In fact, only 0.1% of the spurious violations are produced uniquely by the property-based oracle, while 21.1% of the spurious violations are produced uniquely by the snapshot-based oracle. The largest proportion of the spurious violations (73.6%) are produced by both the strategies.
Although the snapshot-based oracle produces more spurious violations than the property-based oracle, these violations seldom cause correct activities to be reported to the tester (1 activity every 4 apps), thus it is relatively detrimental to use it in the testing process. On the contrary, including it in the analysis increases the number of revealed data loss faults by 9.2%, which is a non-trivial increase of the failure discovery ability of DLD.
4.8. RQ4 - Are data loss faults relevant to developers?
Finally, we investigated if data loss faults are relevant to app developers. To this end, for each app in the benchmark, we identified and downloaded the latest version of the same app. We executed again DLD for 9 hours (three 3-hours runs) on each app and revealed 195 data loss faults that still affect these apps nowadays. We finally submitted a bug report online for each revealed data loss.
Up to the time of the conference deadline, we received feedback for 98 of the reports submitted online. Developers confirmed the bugs for 88 reports (90% of the reports with a feedback). Only in 10 cases developers rejected the report advocating that the fault was a framework fault, claiming the fault was not reproducible, or giving no explanation. We can thus conclude that the revealed data loss faults are significant to the developers.
In 33 of 88 cases developers claimed that the cost of fixing these bugs might be too high compared to their impact on the app. This decision of course depends on the specific consequence of the data loss and the complexity of the activity that is affected by the fault. This also suggests that the definition of an automatic repair strategy (Gazzola et al. 2019) that can address data loss faults could be extremely beneficial to improve the cost-effectiveness of the bug fixing process.
4.9. Threats to Validity
The main internal threats to validity about our study is the manual work done to identify the spurious violations among the data loss faults reported in the evaluation. Distinguishing a genuine data loss from a spurious one is however quite simple, as also confirmed by the bug reports submitted online to developers that have been almost all accepted, with rejections due to faults that were considered outside the boundary of the tested app or behaviors that could be considered acceptable although not ideal.
The main external threats to validity concerns with the generalization of the results. The significant number of faults and apps considered mitigates this threat. The fact that we repeated the evaluation with the most recent versions of the apps revealing again many data loss faults is a further mitigation factor.
Concerning the comparison between DLD and ALARic, the consistency of the results across every app that has been tested is a strong factor in favour of the generality of the results. The results of the comparison between DLD and Quantum cannot be generalized due to the limited size and the setup of the experiment, however they still provide useful insights about the effectiveness of DLD.
5. Related Work
Several techniques covering a wide range of approaches are available to generate test cases for Android apps. For instance, Monkey generates test inputs fully randomly without interpreting the GUI of the app under test (Developers [n.d.]d). A3E systematically generates test inputs following a depth-first strategy (Azim and Neamtiu 2013). DroidBot (Li et al. 2017) and Stoat (Su et al. 2017) build a state-based model of the system under test and generate test cases exploiting information about the events already tested in the visited states. Sapienz uses evolutionary algorithms to generate test cases (Mao et al. 2016). While these approaches revealed several interesting faults in both open source (Choudhary et al. 2015) and industrial applications (Wang et al. 2018), they are ineffective against data loss problems (and also against most non-crashing failures (Zaeem et al. 2014)). In fact, they neither include operations that cause stop-start events nor they are equipped with oracles that can detect non-crashing data loss failures, which account for the majority of the failures as reported in our evaluation.
Thor (Adamsen et al. 2015) can augment existing test suites with neutral sequences of operations to reveal additional failures. The injected sequences concern with the audio service, the connectivity, and the lifecycle of the activities, which may reveal data loss faults. Similarly, when a user-generated model of the app under test is available, Quantum (Zaeem et al. 2014) can generate tests that may reveal data loss, as reported in a small-scale evaluation. Differently from these approaches, DLD directly generates the test cases and requires neither an initial test suite nor a model of the app under test, retaining a high effectiveness as demonstrated in the comparison to ALARic and Quantum.
CrashScope (Moran et al. 2016) and AppDoctor (Hu et al. 2014) can generate tests that may reveal data loss problems, but their effectiveness is limited to crashing faults, which represent the minority of the cases.
ALARic (Amalfitano et al. 2018) is a mostly random test case generation technique that similarly to DLD exploits double screen rotations to reveal data loss faults. However, the biased exploration strategy, the enabledeness state abstraction, and the ad-hoc data-loss-revealing actions used by DLD outperformed ALARic in our evaluation.
When the source code of the app is available, a static analysis technique such as KREfinder (Shan et al. 2016) can be used to reveal data loss problems. However, as most static analysis techniques, KREfinder suffers scalability issues and is likely to report many spurious violations. On the contrary, the effectiveness of DLD does not depend on the complexity and size of the source code and seldom reports spurious data loss.
The oracle strategies presented in this paper relate to the work on metamorphic testing (Segura et al. 2016). Metamorphic testing exploits metamorphic relations, which are relations on multiple executions of the software, to check the correctness of the observed behavior. The neutral sequences of operations that DLD uses to reveal data loss problems can be seen as a specific class of metamorphic relations that relate executions with and without these sequences.
Relations between executions, like the ones used in this paper to reveal data loss problems, have been also used to heal executions, for instance to produce automatic workarounds (Carzaniga et al. 2015). Although neutral sequences of events can be potentially used to obtain workarounds, the ones used in this paper can be hardly used to heal executions since they are often the cause of faults, as reported in the evaluation.
Finally, faults in Android apps, including data loss faults, could be addressed with healing techniques. However, not many healing approaches can work in the Android environment. Azim et al. defined a technique that can disable functionalities that are not working properly (Azim et al. 2014). While this approach might be exploited to prevent data loss failures, it also reduces the set of functionalities available to users. DataLossHealer is a healing solution designed to mitigate the impact of data loss faults in the field (Riganelli et al. 2016). Although it might prevent some data loss faults, it has various drawbacks. For instance, it introduces overhead to save and restore data in presence of data loss faults, it can address only some data loss, and it requires rooting the device. DLD delivers a more effective solution revealing data loss faults upfront before the app is released.
6. Conclusions
Android apps must be designed to deal with stop-start events, which are external events that may interrupt the execution of the running activity. When one of these events is generated, the foreground Android activity might be destroyed and later recreated. To avoid losing useful data during this process, apps must explicitly implement the logic necessary to save the data, when the activity is destroyed, and restore the saved data, when the activity is recreated. Unfortunately, this logic is often faulty (Riganelli et al. 2019; Adamsen et al. 2015; Amalfitano et al. 2018; Riccio et al. 2018).
This paper presents Data Loss Detector (DLD), an automatic test case generation technique designed to reveal data loss faults. DLD exploits an exploration strategy biased towards the discovery of new app states, data-loss-revealing actions, and two dedicated oracle-based strategies to automatically reveal data loss problems.
In our evaluation with 110 data loss faults affecting 54 app releases, DLD outperformed ALARic (Riccio et al. 2018) and performed well in comparison to Quantum when instructed with a manual model of the app under test. Overall, DLD revealed 298 activities affected by data loss faults, which is a clear indicator of the effectiveness of the approach and pervasiveness of the problem.
We are now working on the definition of automatic program repair solutions for data loss faults.
Acknowledgments
We would like to thank Vincenzo Riccio, Domenico Amalfitano and Anna Rita Fasolino for sharing their implementation of ALARic with us.
References
- (1)
- Adamsen et al. (2015) Christoffer Quist Adamsen, Gianluca Mezzetti, and Anders Møller. 2015. Systematic Execution of Android Test Suites in Adverse Conditions. In Proceedings of the International Symposium on Software Testing and Analysis (ISSTA).
- Amalfitano et al. (2018) Domenico Amalfitano, Vincenzo Riccio, Ana C. R. Paiva, and Anna Rita Fasolino. 2018. Why does the orientation change mess up my Android application? From GUI failures to code faults. Software Testing, Verification and Reliability 28, 1 (2018), e1654.
- Azim and Neamtiu (2013) Md. Tanzirul Azim and Iulian Neamtiu. 2013. Targeted and Depth-first Exploration for Systematic Testing of Android Apps. In Proceedings of the ACM SIGPLAN International Conference on Object Oriented Programming Systems Languages & Applications (OOPSLA).
- Azim et al. (2014) Md. Tanzirul Azim, Iulian Neamtiu, and Lisa M. Marvel. 2014. Towards Self-healing Smartphone Software via Automated Patching. In Proceedings of the ACM/IEEE International Conference on Automated Software Engineering (ASE).
- Carzaniga et al. (2015) Antonio Carzaniga, Alessandra Gorla, Nicolò Perino, and Mauro Pezzè. 2015. Automatic Workarounds: Exploiting the Intrinsic Redundancy of Web Applications. ACM Transactions on Software Engineering and Methodologies (TOSEM) 24, 3 (2015).
- Choudhary et al. (2015) Shauvik Roy Choudhary, Alessandra Gorla, and Alessandro Orso. 2015. Automated Test Input Generation for Android: Are We There Yet? (E). In Proceedings of the IEEE/ACM International Conference on Automated Software Engineering (ASE).
- De Caso et al. (2011) Guido De Caso, Víctor Braberman, Diego Garbervetsky, and Sebastián Uchitel. 2011. Program Abstractions for Behaviour Validation. In Proceedings of the International Conference on Software Engineering (ICSE).
- De Caso et al. (2013) Guido De Caso, Victor Braberman, Diego Garbervetsky, and Sebastian Uchitel. 2013. Enabledness-based Program Abstractions for Behavior Validation. ACM Trans. Softw. Eng. Methodol. 22, 3 (2013), 25:1–25:46.
- Developers ([n.d.]a) Android Developers. [n.d.]a. Fragments. https://developer.android.com/guide/components/fragments
- Developers ([n.d.]b) Android Developers. [n.d.]b. Saving UI States. https://developer.android.com/topic/libraries/architecture/saving-states.html
- Developers ([n.d.]c) Android Developers. [n.d.]c. Services overview. https://developer.android.com/guide/components/services
- Developers ([n.d.]d) Android Developers. [n.d.]d. UI/Application Exerciser Monkey. https://developer.android.com/studio/test/monkey
- Developers ([n.d.]e) Android Developers. [n.d.]e. Understand the Activity Lifecycle. https://developer.android.com/guide/components/activities/activity-lifecycle
- Foundation ([n.d.]) JS Foundation. [n.d.]. Appium. http://appium.io/
- Gazzola et al. (2019) Luca Gazzola, Daniela Micucci, and Leonardo Mariani. 2019. Automatic Software Repair: A Survey. IEEE Transactions on Software Engineering (TSE) 45, 1 (2019), 34–67.
- Hu and Neamtiu (2011) Cuixiong Hu and Iulian Neamtiu. 2011. Automating GUI Testing for Android Applications. In Proceedings of the 6th International Workshop on Automation of Software Test (AST).
- Hu et al. (2014) Gang Hu, Xinhao Yuan, Yang Tang, and Junfeng Yang. 2014. Efficiently, Effectively Detecting Mobile App Bugs with AppDoctor. In Proceedings of the Ninth European Conference on Computer Systems (EuroSys).
- Jha et al. (2019) Ajay Kumar Jha, Sunghee Lee, and Woo Jin Lee. 2019. Characterizing Android-specific Crash Bugs. In Proceedings of the International Conference on Mobile Software Engineering and Systems (MOBILESoft).
- Li et al. (2017) Yuanchun Li, Yang Ziyue, Guo Yao, and Chen Xiangqun. 2017. DroidBot: A Lightweight UI-guided Test Input Generator for Android. In Proceedings of the International Conference on Software Engineering Companion (ICSE).
- Mao et al. (2016) Ke Mao, Mark Harman, and Yue Jia. 2016. Sapienz: Multi-objective Automated Testing for Android Applications. In Proceedings of the International Symposium on Software Testing and Analysis (ISSTA).
- Mobilloud (2019) Mobilloud. 2019. People Spent 90% of Their Mobile Time Using Apps in 2019. https://www.mobiloud.com/blog/mobile-apps-vs-the-mobile-web/. [Online; accessed January 2020].
- Moran et al. (2016) K. Moran, M. Linares-Vásquez, C. Bernal-Cárdenas, C. Vendome, and D. Poshyvanyk. 2016. Automatically Discovering, Reporting and Reproducing Android Application Crashes. In Proceedings of the International Conference on Software Testing, Verification and Validation (ICST).
- RescueTime:blog (2019) RescueTime:blog. 2019. Screen time stats 2019: Here’s how much you use your phone during the workday. https://blog.rescuetime.com/screen-time-stats-2018/. [Online; accessed January 2020].
- Riccio et al. (2018) Vincenzo Riccio, Domenico Amalfitano, and Anna Rita Fasolino. 2018. Is this the lifecycle we really want?: an automated black-box testing approach for Android activities. In Proceedings of the International Workshop on User Interface Test Automation, and Workshop on TESting Techniques for event BasED Software (ISSTA/ECOOPWorkshops).
- Riganelli et al. (2016) Oliviero Riganelli, Daniela Micucci, and Leonardo Mariani. 2016. Healing Data Loss Problems in Android Apps. In Proceedings of the IEEE International Symposium on Software Reliability Engineering Workshops (ISSREW).
- Riganelli et al. (2019) Oliviero Riganelli, Marco Mobilio, Daniela Micucci, and Leonardo Mariani. 2019. A Benchmark of Data Loss Bugs for Android Apps. In Proceedings of the International Conference on Mining Software Repositories (MSR).
- Segura et al. (2016) Sergio Segura, Gordon Fraser, Ana B. Sanchez, and Antonio Ruiz-Cortes. 2016. A Survey on Metamorphic Testing. IEEE Transactions on Software Engineering (TSE) 42, 9 (2016), 805–824.
- Shan et al. (2016) Z. Shan, T. Azim, and I Neamtiu. 2016. Finding Resume and Restart Errors in Android Applications. In Proceedings of the ACM SIGPLAN International Conference on Object-Oriented Programming, Systems, Languages, and Applications (OOPSLA).
- Statcounter (2020) Statcounter. 2020. Mobile Operating System Market Share Worldwide - December 2019. http://gs.statcounter.com/os-market-share/mobile/worldwide. [Online; accessed January 2020].
- Statista (2020) Statista. 2020. Number of available applications in the Google Play Store from December 2009 to December 2019. https://www.statista.com/statistics/266210/number-of-available-applications-in-the-google-play-store/
- Su et al. (2017) Ting Su, Guozhu Meng, Yuting Chen, Ke Wu, Weiming Yang, Yao Yao, Geguang Pu, Yang Liu, and Zhendong Su. 2017. Guided, Stochastic Model-based GUI Testing of Android Apps. In Proceedings of the Joint Meeting on Foundations of Software Engineering (FSE).
- Wang et al. (2018) Wenyu Wang, Dengfeng Li, Wei Yang, Yurui Cao, Zhenwen Zhang, Yuetang Deng, and Tao Xie. 2018. An empirical study of Android test generation tools in industrial cases. In Proceedings of the ACM/IEEE International Conference on Automated Software Engineering (ASE).
- Zaeem et al. (2014) Razieh Nokhbeh Zaeem, Mukul R. Prasad, and Sarfraz Khurshid. 2014. Automated Generation of Oracles for Testing User-Interaction Features of Mobile Apps. In Proceedings of the International Conference on Software Testing, Verification and Validation (ICST).