Attention Model Enhanced Network for Classification
of Breast Cancer Image
Abstract
Breast cancer classification remains a challenging task due to inter-class ambiguity and intra-class variability. Existing deep learning-based methods try to confront this challenge by utilizing complex nonlinear projections. However, these methods typically extract global features from entire images, neglecting the fact that the subtle detail information can be crucial in extracting discriminative features. In this study, we propose a novel method named Attention Model Enhanced Network (AMEN), which is formulated in a multi-branch fashion with pixel-wised attention model and classification submodular. Specifically, the feature learning part in AMEN can generate pixel-wised attention map, while the classification submodular are utilized to classify the samples. To focus more on subtle detail information, the sample image is enhanced by the pixel-wised attention map generated from former branch. Furthermore, boosting strategy are adopted to fuse classification results from different branches for better performance. Experiments conducted on three benchmark datasets demonstrate the superiority of the proposed method under various scenarios.
Index Terms:
Breast cancer classification, Deep learning, Multi-branch fashion, Pixel-wised attention, Boosting2School of Computer Science and Technology, Shandong Jianzhu University , Jinan, P.R. China
{sckx,sclxb}@mail.sdu.edu.cn, niexsh@hotmail.com, fyzq10@126.com, ylyin@sdu.edu.cn
1 Introduction
Breast cancer is the fifth most fatal disease and the second leading cause of death for women around the world [1]. The cause of this disease remains unknown, making prevention tricky. Thus, early detection and diagnosis, which can increase the success of treatment, reduce cost and even save lives, are strongly advocated. During the early diagnosis, radiologists prefer safer and more convenient imaging procedures, such as digital mammography and ultrasound-imaging, to detect tumors. However, medical image recognition is a specialized and burdensome task depended on the experience of the pathologists. With the development of machine learning and medical imaging technology, computer-assisted diagnosis, which can provide significant assistance for clinicians, attracts extensive attention in breast cancer classification field.
Differing from general coarse-grained natural image recognition, breast cancer classification suffers form huge inter-class ambiguity and intra-class variability [2, 3, 4, 5, 6, 7, 8, 9, 10]. In addition, the training samples is rather insufficient due to the increasing cost of data collection and data privacy issues, hindering further improvement of computer-assisted diagnosis. Therefore, it is momentous to acquire discriminative features in such a depressing condition. Previously, methods based on shallow features[11, 12] and handcraft features [13, 14] have been extensively investigated. By designing manual features, Huang et al.[13] demonstrate that breast cancer recognition highly relative to exquisite information such as shape, orientation, margin integrality and so on. Although this method can gain satisfactory performance, it is considerably labor-intensive and extremely referred to the experience of the domain experts.
Recently, deep neural network has shown convincing efficacy in feature extraction, thus increasing works based on deep learning have been proposed in the field of medical image processing. Existing methods usually extract features from the entire image [15, 16, 17], which may lose subtle detail information of the lesion. To tackle this problem, Kaushiki et al. [17] propose a patch-based classifier, which divides images into small patches and learns the features of each patch utilizing deep neural networks separately. Nevertheless, many patches seem not to have sufficient representational ability owing to intra-class variability of medical images. In other words, similar patches tend to appear in different categories, making it arbitrary to assign the given semantic label to all patches [18].
To address the aforementioned issues, we propose a multi-branch method for breast cancer classification named Attention Model Enhanced Network (AMEN) in this study. Two mutual tasks, i.e. pixel-wised attention and classification, are realized in each branch. To capture more detail information, pixel-wised attention map is utilized to reinforce the original images. Benefited by the iterative framework and boosting strategy, the proposed method can achieve state-of-the-art performance on three benchmark datasets. The main contributions of this work are three-fold:
- •
Pixel-wised attention model. Pixel-wised attention map generated from the feature learning part is supposed to indicate the importance of image pixels and capture the subtle detail information.
- •
Iterative framework and boosting strategy. The iterative process and boosting strategy are conducive to achieve more stable and satisfactory precision.
- •
Experiments conducted on three benchmark datasets verify the superiority of the proposed method under various scenarios.
2 The Proposed Method
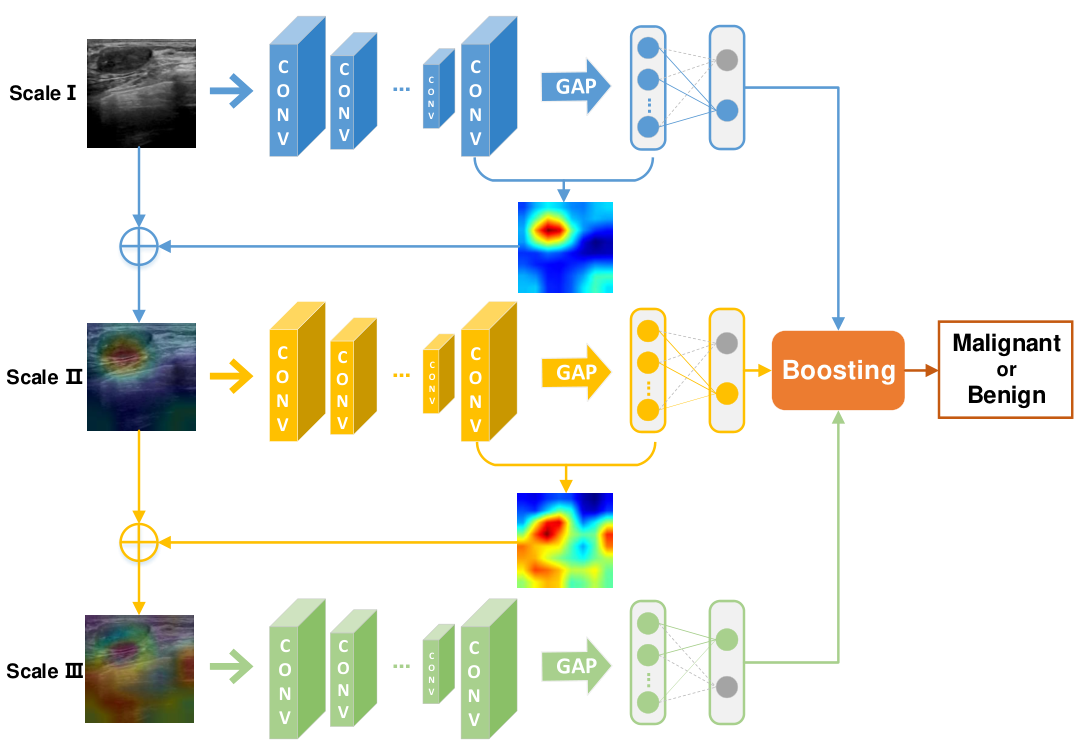
This section elaborates the proposed method form several aspects, i.e. feature learning, classification submodular, pixel-wised attention model, iterative process and prediction strategy. Fig. 1 shows the flowchart of the proposed AMEN.
2.1 Feature Extraction and Classification Network
Assume that there is a training set consisting of images, i.e., , with being the image. Additionally, the semantic label is available, where is the number of categories. Specifically, if belongs to class and 0 otherwise.
To get the feature map of the given image , deep neural network is utilized to preform feature extraction, and this process can be formulated as
| (1) |
where , , and denote width, height and channel of the feature map, respectively. is the parameter of deep neural network while is the combination of convolution, pooling and activation layers. The feature map can be utilized in the following two imperative parts of this study, i.e. pixel-wised attention model and classification submodular.
To obtain reliable classification performance, we minimize the cross-entropy loss between the label vector and predicted probability generated from classification network, which can be formalized as
| (2) |
is the parameters for classification submodular, while represents fully-connected layers. Moreover, the softmax function is adopted to transform the outputs to classification probabilities.
| Method | BCU | BreaKHis 100X | BreaKHis 200X | |||||||||
|---|---|---|---|---|---|---|---|---|---|---|---|---|
| OA | Sen | PPV | F1 | OA | Sen | PPV | F1 | OA | Sen | PPV | F1 | |
| VGG16 | 0.7667 | 0.9333 | 0.7000 | 0.8000 | 0.6728 | 0.5517 | 0.6337 | 0.5899 | 0.6690 | 0.6406 | 0.6357 | 0.6381 |
| VGG19 | 0.7667 | 0.8667 | 0.7222 | 0.7879 | 0.6728 | 0.6724 | 0.6047 | 0.6367 | 0.6963 | 0.6406 | 0.6949 | 0.6667 |
| GoogLeNet | 0.7667 | 0.8000 | 0.7500 | 0.7742 | 0.8823 | 0.8321 | 0.9268 | 0.8769 | 0.9087 | 0.8915 | 0.9349 | 0.9127 |
| Inception-v3 | 0.7333 | 0.7333 | 0.7333 | 0.7333 | 0.6765 | 0.5508 | 0.6500 | 0.5963 | 0.7469 | 0.6774 | 0.8000 | 0.7336 |
| DenseNet121 | 0.8000 | 0.8000 | 0.8000 | 0.8000 | 0.8419 | 0.8456 | 0.8342 | 0.8425 | 0.8548 | 0.8682 | 0.8615 | 0.8649 |
| ResNet50 | 0.7333 | 0.7333 | 0.7333 | 0.7333 | 0.8419 | 0.7794 | 0.8908 | 0.8314 | 0.8921 | 0.8702 | 0.9268 | 0.8976 |
| ResNet101 | 0.7667 | 0.7333 | 0.7857 | 0.7586 | 0.8272 | 0.7481 | 0.8860 | 0.8112 | 0.8963 | 0.8906 | 0.9120 | 0.9012 |
| 0.8333 | 0.8667 | 0.8125 | 0.8387 | 0.8897 | 0.8686 | 0.9084 | 0.8881 | 0.9294 | 0.9153 | 0.9520 | 0.9333 | |
| 0.8667 | 0.8667 | 0.8667 | 0.8667 | 0.8860 | 0.8815 | 0.8881 | 0.8848 | 0.9170 | 0.9448 | 0.9022 | 0.9230 | |
2.2 Pixel-wised Attention Model
Attention model, inspired by region detection [19], can calculate pixel-wised attention map where high values indicate the essential pixels as far as classification is concerned. It is worth noting that this model are same in each branch.
Taking Scale I in Fig. 1 as an example, pixel-wised attention map is calculated by
| (3) |
where means the element with coordinate (, , ) in feature map . denotes global average pooling [19], which can transform feature map to attention map .
Attention map formulated in Eq. 3, has the same size with original image, with each value in indicating the importance of the pixel corresponding to original image. Compared with [17], the attention map in this study is pixel-wised, making the subtle detail information more flexible and accurate. Intuitively, regions with high values can be identified as discriminative parts that are vital for classification task.
2.3 Overall Structure
In this section, we will introduce the overall structure of the proposed AMEN by taking a three-branch framework in Fig. 1 for example. In detail, the classification process consists of the following three steps:
Step 1: we initialize the network in first branch (i.e. Scale I) by the pretrained backbone from ImageNet [20]. Then, we train the feature extraction network and classification submodule simultaneously with the provided dataset by back propagation. Next, pixel-wised attention map is generated from feature learning part. And prediction results are saved for boosting strategy.
Step 2: we initialize network of next branch by the parameters in previous scale. To capture more detail information, we enhance the original image with the learned pixel-wised attention map. We adopt a plain but effective weighted superposition strategy in this study, and this process can be formalized as
| (4) |
where denotes the input image of branch, and is a hyperparameter which balances original image and attention map. Then the feature extraction network and classification submodule are trained with the enhanced dataset by back propagation. By this iterative strategy, we can stack more branches to get better performance, which will be shown in the experimental results. In conclusion, the loss function in each branch can be defined as
| (5) |
where , , and .
Step 3: Enhanced by the learned pixel-wised attention map, the subsequent branches are supposed to achieve more distinguishing classification ability. Even so, to get more stable and practical classification performance, a simple but effective boosting strategy, i.e. majority voting, is adopted to fuse the prediction results in each branch.
By utilizing the above three steps, the proposed method can be considered as a multi-branch boosting framework. It is noted that each independent branch can be seamlessly integrated by pixel-wised attention model and boosting strategy.
| Method | BCU | BreaKHis 100X | BreaKHis 200X | |||||||||
|---|---|---|---|---|---|---|---|---|---|---|---|---|
| OA | Sen | PPV | F1 | OA | Sen | PPV | F1 | OA | Sen | PPV | F1 | |
| Average | 0.7444 | 0.7556 | 0.7389 | 0.7470 | 0.8767 | 0.8415 | 0.9082 | 0.8734 | 0.9030 | 0.8977 | 0.9148 | 0.9071 |
| Boosting | 0.7667 | 0.8000 | 0.7500 | 0.7742 | 0.8823 | 0.8321 | 0.9268 | 0.8769 | 0.9129 | 0.9206 | 0.9134 | 0.9170 |
| Scale I | 0.7667 | 0.8000 | 0.7500 | 0.7742 | 0.8713 | 0.8248 | 0.9262 | 0.8726 | 0.9087 | 0.8915 | 0.9349 | 0.9127 |
| Scale II | 0.8000 | 0.8667 | 0.7647 | 0.8125 | 0.8787 | 0.8540 | 0.9000 | 0.8764 | 0.9129 | 0.9008 | 0.9365 | 0.9183 |
| Scale III | 0.8000 | 0.8667 | 0.7647 | 0.8125 | 0.8823 | 0.8321 | 0.9268 | 0.8769 | 0.9212 | 0.9077 | 0.9440 | 0.9255 |
| 0.8333 | 0.8667 | 0.8125 | 0.8387 | 0.8897 | 0.8686 | 0.9084 | 0.8881 | 0.9294 | 0.9153 | 0.9520 | 0.9333 | |
| Average | 0.7667 | 0.7778 | 0.7611 | 0.7692 | 0.8368 | 0.8391 | 0.8280 | 0.8343 | 0.8562 | 0.8574 | 0.8668 | 0.8620 |
| Boosting | 0.8000 | 0.8667 | 0.7647 | 0.8125 | 0.8548 | 0.8793 | 0.8293 | 0.8536 | 0.8631 | 0.8571 | 0.8780 | 0.8675 |
| Scale I | 0.8000 | 0.8000 | 0.8000 | 0.8000 | 0.8419 | 0.8456 | 0.8342 | 0.8425 | 0.8548 | 0.8682 | 0.8615 | 0.8649 |
| Scale II | 0.8333 | 0.8000 | 0.8571 | 0.8276 | 0.8529 | 0.8129 | 0.8898 | 0.8496 | 0.8755 | 0.8837 | 0.8837 | 0.8837 |
| Scale III | 0.8333 | 0.8000 | 0.8571 | 0.8276 | 0.8713 | 0.8322 | 0.9048 | 0.8669 | 0.9087 | 0.9077 | 0.9219 | 0.9147 |
| 0.8667 | 0.8667 | 0.8667 | 0.8667 | 0.8860 | 0.8815 | 0.8881 | 0.8848 | 0.9170 | 0.9448 | 0.9022 | 0.9230 | |
3 EXPERIMENT
3.1 Experimental Settings
To confirm the superiority of the proposed method, we conduct experiments on three benchmark datasets, Breast Cancer Ultrasound (BCU)[21], BreaKHis 100X and BreaKHis 200X[22]. The BCU dataset is a ultrasound image dataset while BreaKHis 100X and BreaKHis 200X are histology image datasets. In this study, we compare the proposed AMEN with Visual Geometry Group Network (VGG16 and VGG19) [23], Inception-v3 [24], Deep Residual Network (ResNet50 and ResNet101) [4], GoogLeNet [2], and Dense Convolutional Network (DenseNet121) [3]. Overall accuracy, Sensitivity, Positive predictive value, and F1-Score [25] are adopted to evaluate the performance of these methods on the three datasets.
The number of scales is set to 3 empirically in this study and more can be stacked in a similar way. For the hyperparameter in the Eq. 4, we set it as in each scale for simplicity. Empirically, values of epoch, learning rate, momentum and weight decay are set to 100, , 0.99 and , respectively. The images of three benchmark datasets are resized to 256 256. Pytorch are used as the code-base, and all the models are trained on 4 TITAN X GPUs. More details to our code is presented in https://github.com/……
3.2 Experimental Results and Analysis
According to the performance on different backbone, we take the classification network with better accuracy, i.e., GoogLeNet and DenseNet121, as backbones of the proposed AMEN. As shown in Table 1, the proposed AMEN1 (AMEN with GoogLeNet) and AMEN2 (AMEN with DenseNet121) are superior to the compared methods in nearly all of the evaluation criterion with an improvement of around 3%.
Table 2 presents the results of ablation experiments. We run the backbones for three times and list the average performance (shown as Average). In addition, we fuse the three results using the same boosting strategy (shown as Boosting). Furthermore, we exhibit the performance of the proposed AMEN with three branches (shown as Scale I, Scale II and Scale III). We have a primary observation that methods based on boosting strategy can achieve better performance. Furthermore, the branches which take pixel-wised attention map into consideration are more discriminative for classification. Additionally, the performance seems to be improved as the number of scales increasing. Last but not least, the proposed method with both pixel-wised attention and boosting strategy outperforms on the three benchmark datasets, verifying the efficiency and superiority.
Fig. 2 exhibits the performance in terms of four evaluation matrices when utilizing four backbones, ResNet50, ResNet101, GoogLeNet and DenseNet121. The proposed AMEN with GoogLeNet and DenseNet121 can gain better performances compared with their counterparts. In addition, Fig. 3 shows the performance in terms of four evaluation matrices when ranging form to . The proposed method exhibit acceptable stability with different granularity of , saving lots of time for parameter tuning.
4 CONCLUSION
In this study, we propose a deep learning-based method for breast cancer classification called Attention Model Enhanced Network, which integrates pixel-wised attention and multi-branch boosting in an iterative fashion. The pixel-wised attention can remedy the intractable lost of subtle detail information by a simple but effective weighted superposition strategy. Furthermore, the multi-branch boosting is conducive to achieve more stable and compelling performance. Experiments conducted on three benchmark datasets validate the superiority of the proposed method under various scenarios.
5 ACKNOWLEDGEMENTS
This work was supported in part by the National Natural Science Foundation of China (61876098, 61671274, 61573219), National Key RD Program of China (2018YFC0830100, 2018YFC0830102) and special funds for distinguished professors of Shandong Jianzhu University.
References
- [1] Antonio Brunetti, Leonarda Carnimeo, Gianpaolo Francesco Trotta, and Vitoantonio Bevilacqua, “Computer-assisted frameworks for classification of liver, breast and blood neoplasias via neural networks: A survey based on medical images,” Neurocomputing, vol. 335, pp. 274–298, 2019.
- [2] Christian Szegedy, Wei Liu, Yangqing Jia, Pierre Sermanet, Scott E. Reed, Dragomir Anguelov, Dumitru Erhan, Vincent Vanhoucke, and Andrew Rabinovich, “Going deeper with convolutions,” in Proceedings of the IEEE Conference on Computer Vision and Pattern Recognition, 2015.
- [3] Gao Huang, Zhuang Liu, Laurens Van Der Maaten, and Kilian Q Weinberger, “Densely connected convolutional networks,” in Proceedings of the IEEE conference on computer vision and pattern recognition, 2017, pp. 4700–4708.
- [4] Kaiming He, Xiangyu Zhang, Shaoqing Ren, and Jian Sun, “Deep residual learning for image recognition,” in Proceedings of the IEEE Conference on Computer Vision and Pattern Recognition, 2016.
- [5] Jianlong Fu, Heliang Zheng, and Tao Mei, “Look closer to see better: Recurrent attention convolutional neural network for fine-grained image recognition,” in IEEE Conference on Computer Vision and Pattern Recognition, 2017, pp. 4476–4484.
- [6] Xingbo Liu, Xiushan Nie, Wenjun Zeng, Chaoran Cui, Lei Zhu, and Yilong Yin, “Fast discrete cross-modal hashing with regressing from semantic labels,” in 2018 ACM Multimedia Conference on Multimedia Conference. ACM, 2018, pp. 1662–1669.
- [7] Xingbo Liu, Xiushan Nie, Haoliang Sun, Chaoran Cui, and Yilong Yin, “Modality-specific structure preserving hashing for cross-modal retrieval,” in 2018 IEEE International Conference on Acoustics, Speech and Signal Processing (ICASSP). IEEE, 2018, pp. 1678–1682.
- [8] Xingbo Liu, Xiushan Nie, Haoliang Sun, Chaoran Cui, and Yilong Yin, “Supervised short-length hashing,” in 28th International Joint Conference on Artificial Intelligence (IJCAI). IEEE, 2019.
- [9] Xingbo Liu, Xiushan Nie, Quan Zhou, and Yilong Yin, “Supervised discrete hashing with mutual linear regression,” in 2019 ACM Multimedia Conference on Multimedia Conference. ACM, 2010.
- [10] Xingbo Liu, Xiushan Nie, Quan Zhou, Liqiang Nie, and Yilong Yin, “Model optimization boosting framework for linear model hash learning,” IEEE Transactions on Image Processing, vol. 29, pp. 4254–4268, 2020.
- [11] Woo Kyung Moon, Shao-Chien Chang, Chiun-Sheng Huang, and Ruey-Feng Chang, “Breast tumor classification using fuzzy clustering for breast elastography,” Ultrasound in medicine & biology, vol. 37, no. 5, pp. 700–708, 2011.
- [12] Duc My Vo, Ngoc-Quang Nguyen, and Sang-Woong Lee, “Classification of breast cancer histology images using incremental boosting convolution networks,” Inf. Sci., vol. 482, pp. 123–138, 2019.
- [13] Qinghua Huang, Yongdong Chen, Longzhong Liu, Dacheng Tao, and Xuelong Li, “On combining biclustering mining and adaboost for breast tumor classification,” IEEE Trans. Knowl. Data Eng., vol. 32, no. 4, pp. 728–738, 2020.
- [14] Humayun Irshad, Antoine Veillard, Ludovic Roux, and Daniel Racoceanu, “Methods for nuclei detection, segmentation, and classification in digital histopathology: a review—current status and future potential,” IEEE reviews in biomedical engineering, vol. 7, pp. 97–114, 2013.
- [15] Sana Ullah Khan, Naveed Islam, Zahoor Jan, Ikram Ud Din, and Joel J. P. C. Rodrigues, “A novel deep learning based framework for the detection and classification of breast cancer using transfer learning,” Pattern Recognit. Lett., vol. 125, pp. 1–6, 2019.
- [16] Nan Wu, Jason Phang, and et.al, “Deep neural networks improve radiologists’ performance in breast cancer screening,” CoRR, vol. abs/1903.08297, 2019.
- [17] Kaushiki Roy, Debapriya Banik, Debotosh Bhattacharjee, and Mita Nasipuri, “Patch-based system for classification of breast histology images using deep learning,” Comput. Medical Imaging Graph., vol. 71, pp. 90–103, 2019.
- [18] Jiwen Lu, Venice Erin Liong, Gang Wang, and Pierre Moulin, “Joint feature learning for face recognition,” IEEE Transactions on Information Forensics & Security, vol. 10, no. 7, pp. 1371–1383, 2017.
- [19] Min Lin, Qiang Chen, and Shuicheng Yan, “Network in network,” arXiv preprint arXiv:1312.4400, 2013.
- [20] Olga Russakovsky, Jia Deng, Hao Su, Jonathan Krause, Sanjeev Satheesh, Sean Ma, Zhiheng Huang, Andrej Karpathy, Aditya Khosla, Michael S. Bernstein, Alexander C. Berg, and Fei-Fei Li, “Imagenet large scale visual recognition challenge,” Int. J. Comput. Vis., vol. 115, no. 3, pp. 211–252, 2015.
- [21] Yongjian Wu, Xiaoming Xi, Xianjing Meng, Xiushan Nie, Yanwei Ren, Guang Zhang, Cuihuan Tian, and Yilong Yin, “Label-distribution learning-embedded active contour model for breast tumor segmentation,” IEEE Access, vol. 7, pp. 97857–97864, 2019.
- [22] Fabio A. Spanhol, Luiz S. Oliveira, Caroline Petitjean, and Laurent Heutte, “A dataset for breast cancer histopathological image classification,” IEEE Trans. Biomed. Eng., vol. 63, no. 7, pp. 1455–1462, 2016.
- [23] Karen Simonyan and Andrew Zisserman, “Very deep convolutional networks for large-scale image recognition,” in Proceedings of the IEEE Conference on Computer Vision and Pattern Recognition, 2014.
- [24] Christian Szegedy, Vincent Vanhoucke, Sergey Ioffe, Jonathon Shlens, and Zbigniew Wojna, “Rethinking the inception architecture for computer vision,” in IEEE Conference on Computer Vision and Pattern Recognition, 2016, pp. 2818–2826.
- [25] Heng-Da Cheng, Juan Shan, Wen Ju, Yanhui Guo, and Ling Zhang, “Automated breast cancer detection and classification using ultrasound images: A survey,” Pattern Recognit., vol. 43, no. 1, pp. 299–317, 2010.