Barred Galaxies in the IllustrisTNG Simulation
Abstract
Almost two-thirds of disk galaxies in the local universe host bars, which serve as important drivers of secular evolutionary processes. While cosmological simulations are powerful tools to study the formation and evolution of galaxies, they have often struggled to generate reasonable bar populations. We measure the fraction, size, and strength of bars in 3866 disk galaxies from the TNG100 run of the advanced cosmological simulation IllustrisTNG. Consistent with observations, about 55% of disk galaxies with stellar mass are barred, and the relation between bar size and total stellar mass is similar to that found in near-infrared surveys. However, the formation of bars is suppressed in galaxies with , which may result from the difficulty TNG100 has in resolving short bars with radius kpc. In contrast, up to 75% of massive disk galaxies with have bars, % higher than observed. TNG100 overproduces relatively short bars (radius kpc) with respect to the mass-bar size relation observed in near-infrared surveys. Tracing the progenitors of massive galaxies we find that the bar fraction increases from 25% to 63% between and . Instead if we select all disk galaxies during with a constant mass cut of we find that the bar fraction is a nearly constant 60%.
Unified Astronomy Thesaurus concepts: SB Galaxies (136); Galactic structure (622); Astronomy simulations (1855)
I Introduction
Observational surveys show that about two-thirds of disk galaxies in the local Universe host a bar (Eskridge et al. 2000; Menéndez-Delmestre et al. 2007; Erwin 2018, e.g.,). Galactic bars are expected to play an important role in the secular evolution of disk galaxies (see the reviews by Kormendy & Kennicutt 2004; Kormendy 2013). Bars can funnel gas efficiently toward the central regions of galaxies (Athanassoula 1992; Kim et al. 2012; Li et al. 2015, e.g.,), possibly triggering nuclear starbursts (Hunt & Malkan 1999; Jogee et al. 2005) and even fueling active galactic nuclei (Ho et al. 1997; Lee et al. 2012; Cheung et al. 2013; Goulding et al. 2017, e.g.,). In turn, short bars of kpc radius can be destroyed by the growth of central concentration of galaxies (Du et al. 2017). The destruction of such bars may contribute to the growth of bulges without a merger involved (Guo et al. 2020). Furthermore, the vertical buckling instability of bars produces boxy/peanut-shaped bulges (Raha et al. 1991; Merritt & Sellwood 1994), which has considerable observational support in our own Galaxy (Shen et al. 2010) and other galaxies (Erwin & Debattista 2016; Li et al. 2017).
Bars form quickly once a dynamically cool disk has settled (see the review by Sellwood 2014, and references therein). They are likely to grow longer and stronger by transferring angular momentum outward into the dark matter halo (Debattista & Sellwood 1998; Debattista & Sellwood 2000; Athanassoula 2003). The internal dynamics of how and why bars form has been addressed in many reviews (Toomre 1981; Sellwood & Wilkinson 1993; Binney & Tremaine 2008; Sellwood 2013). However, it is still unclear why some galaxies have bars, while others do not (Sellwood et al. 2019). In order to better understand how bars form and what role bars really play in the evolution of disk galaxies, it is fundamental to determine what kind of galaxies do or do not host bars.
The bar fraction has long been studied observationally. Early photographic work (de Vaucouleurs et al. 1991, e.g., ) found that 65% of bright nearby galaxies host bars. The bar fraction decreases to if only strong bars are considered (Sandage & Tammann 1987, see also). These results have been supported by subsequent optical and near-infrared (NIR) studies. For example, NIR observations show that about % of local disk galaxies host bars (Eskridge et al. 2000; Knapen et al. 2000; Marinova & Jogee 2007; Menéndez-Delmestre et al. 2007; Díaz-García et al. 2016; Erwin 2018), whereas studies based on the Sloan Digital Sky Survey (York et al. 2000, SDSS;) find a significantly lower total bar fraction () (Barazza et al. 2008; Aguerri et al. 2009; Nair & Abraham 2010a; Nair & Abraham 2010b; Masters et al. 2011; Masters et al. 2012; Skibba et al. 2012; Gavazzi et al. 2015; Consolandi 2016). This disagreement is likely due to the limitations of SDSS data (Erwin 2018). The moderate spatial resolution of SDSS images may preclude the identification of short and weak bars that are common in less massive galaxies.
The incidence of bars depends on the stellar mass of the host galaxy. NIR studies (Díaz-García et al. 2016; Erwin 2018, e.g.) show that the bar fraction increases with stellar mass in less massive galaxies with , but remains nearly constant at in more massive galaxies. Bar sizes also depend on galaxy stellar masses. Díaz-García et al. 2016 and Erwin 2018; Erwin 2019, using NIR data from the Spitzer Survey of Stellar Structure in Galaxies (Sheth et al. 2010, S4G;), find a bimodal relationship between bar size and stellar mass: bar size is nearly constant at kpc in galaxies with , while at higher the bar size scales as .
Numerical simulations are powerful tools to study the formation and evolution of bars, and the role they play in secular evolution. Although the dynamical influence of bars has been studied in great detail using individual cases (Curir et al. 2006; Kraljic et al. 2012; Guedes et al. 2013; Goz et al. 2015; Debattista et al. 2019, e.g.,), a full, systematic understanding of bars needs a statistically large enough sample of barred galaxies from cosmological simulations. Recent cosmological simulations have been able to generate realistic galaxies with reasonable bulge-to-disk ratios (Huertas-Company et al. 2019; Park et al. 2019; Tacchella et al. 2019; Du et al. 2020), as a result of the significant progress made in modelling galaxy formation physics (Agertz et al. 2011; Guedes et al. 2011; Aumer et al. 2013; Stinson et al. 2013; Marinacci et al. 2014; Roškar et al. 2014; Murante et al. 2015; Colín et al. 2016; Grand et al. 2017). Additionally, increasing computational power has permitted an increased resolution of such simulations, enabling bars to be resolved above a certain mass limit. However, it is still challenging to reproduce bar fractions as high as those measured in observations. For example, Algorry et al. 2017 showed that only of massive disk galaxies with in the EAGLE simulation (Crain et al. 2015; Schaye et al. 2015) have bars at . The bar fraction in the original Illustris cosmological simulation (Genel et al. 2014; Vogelsberger et al. 2014) is even lower (26%) for disk galaxies with (Peschken & Łokas 2019).
The advanced version of Illustris, named IllustrisTNG, reproduces realistic galaxies that successfully emulate real galaxies in many aspects. Recent studies have concluded that the bar fractions amongst disk galaxies in the IllustrisTNG simulation are consistent with observations. For example, Rosas-Guevara et al. 2020 found that bars can be detected in 40% of IllustrisTNG disk galaxies with at , and Zhou et al. 2020 reported that 55% of disk galaxies with have bars. However, these studies use the Fourier method, while bars are generally identified by an ellipse fitting method in observations. In this paper, we revisit the bar fraction of disk galaxies in the IllustrisTNG simulation by the ellipse fitting method, and we compare systematically our derived bar sizes with observations.
This paper is organized as follows. We introduce the IllustrisTNG simulation in Section II. Section III presents how the parent disk galaxies are selected. The methods we use to identify and measure bars are described in Section IV, where we also present a catalog of barred galaxies. Section V discusses the main results for redshift . The evolution of the bar fraction at is presented in Section VI. We summarize our main conclusions in Section VII.
II The IllustrisTNG Simulation
IllustrisTNG is an advanced magneto-hydrodynamical cosmological simulation (Marinacci et al. 2018; Naiman et al. 2018; Springel et al. 2018; Nelson et al. 2018; Pillepich et al. 2018b) run with the moving-mesh code AREPO (Springel 2010). As described in Weinberger et al. 2017 and Pillepich et al. 2018a, IllustrisTNG uses an updated version of the Illustris galaxy formation model. We use the TNG100 run, the highest resolution version that is publicly accessible (Nelson et al. 2019). It simulates a volume with side length Mpc. The average mass of the baryonic resolution elements in TNG100 reaches . The gravitational softening length of the stellar particles is set to kpc.
The optical morphologies of the galaxies in TNG100 are in good agreement with observations of local galaxies (Huertas-Company et al. 2019; Rodriguez-Gomez et al. 2019). A systematic comparison between the IllustrisTNG simulation and the Pan-STARRS survey showed that the optical size and shape of TNG100 galaxies are consistent with observations within the scatter of the observed trends (Rodriguez-Gomez et al. 2019). Beyond the basic morphological bulge-disk decomposition, TNG100 also successfully reproduces complex dynamic structures. For example, Xu et al. 2019 found that the relative fractions of the cold, warm, and hot orbital components in TNG100 galaxies are remarkably consistent with those estimated from integral-field spectroscopic observations of nearby galaxies (Zhu et al. 2018). Furthermore, decomposing the simulated TNG100 galaxies into their intrinsic kinematic structures (Du et al. 2019) produces individual components that closely resemble physically familiar galaxy components (Du et al. 2020).
In this paper, the dark matter halos in each simulation snapshot are from the catalog provided by the IllustrisTNG simulation, which are identified by using the friend-of-friend algorithm (Davis et al. 1985), and subhalos in each halo are further identified using the SUBFIND algorithm (Springel et al. 2001; Dolag et al. 2009). A galaxy is defined to be a gravitationally bound object with non-zero stellar mass within the halo or subhalo. We define the center of each galaxy as the minimum of the gravitational potential. The -axis of each galaxy is oriented with the total angular momentum vector of its stars within 0.1 times the virial radius.
III Parent Sample of Disk Galaxies
We select 6507 galaxies at redshift with stellar masses calculated within a radius of 30 kpc. This criterion ensures that every galaxy has enough stellar particles () to resolve its structure. The sample of disk galaxies is then chosen based on the fraction of kinetic energy in ordered rotation (Sales et al. 2010). The parameter measures the mass-weighted average value of within 30 kpc, where is the azimuthal velocity and the total velocity of each star particle. Thus, for a spheroidal galaxy that is completely dominated by random motions. Defining disk galaxies with the criterion yields a parent sample of 3866 galaxies, or % of all galaxies in this mass range. This fraction is consistent with the observational frequency of disk galaxies of determined by Conselice 2006 using the Third Reference Catalogue of Bright Galaxies (de Vaucouleurs et al. 1991).
IV Bar Detection and Characterization
IV.1 Method: Ellipse Fitting

We fit ellipses to the isodensity contours of the face-on surface density maps of the TNG100 disk galaxies with the IRAF task ellipse. This method measures the radial profiles of ellipticity (), position angle (PA), and surface density of a galaxy. It has been widely used as an efficient method for detecting bars in observed galaxies (Jogee et al. 2004; Marinova & Jogee 2007; Aguerri et al. 2009; Li et al. 2011; Consolandi 2016, e.g.,), and it can be similarly applied to our current sample of simulated galaxies. Stellar particles are binned into square bins of pc2, which correspond to sides equal to half the gravitational softening radius. We use the same bar identification criteria as Marinova & Jogee 2007: (1) within the bar, the maximum value of should be and the PA should vary by ; and (2) decreases by outward from the maximum. We refer the reader to Marinova & Jogee 2007 for further discussion of these bar identification criteria. In addition to automatic ellipse fits, we further visually inspect the images to ensure reasonable morphologies of the identified barred galaxies. We find that % of the barred galaxies are misclassified as having bars, whereas they really have irregular structures in the inner regions. We exclude them to ensure no contamination in the barred galaxies. Figure 1 shows examples of an unbarred galaxy and two barred galaxies.
IV.2 Strength and Size of Bars
Following common practice (Jogee et al. 1999; Knapen et al. 2000; Laine et al. 2002a; Marinova & Jogee 2007; Herrera-Endoqui et al. 2015, e.g.,), we quantify the bar strength by the maximum value of , which we designate . Bars with are classified as strong bars, and as weak bars otherwise. This threshold is the same as that used in observations (Jogee et al. 2004; Barazza et al. 2008, e.g.,).

As noted by previous studies (Díaz-García et al. 2016, e.g.,), bar size measurements are ambiguous and dependent on the method chosen. We adopt two methods to estimate the semi-major axis of bars to capture some of the uncertainty in bar sizes. In the first instance, is the radius where declines to 85% of the maximal value. In their systematic study of bars based on -body simulations, Martinez-Valpuesta et al. 2006 suggested that can be used as a reliable estimator of bar size. The second choice for bar size, , defined as the radius at , has been commonly used (Wozniak et al. 1995; Jungwiert et al. 1997; Laine et al. 2002b; Sheth et al. 2003, e.g.,), although both observational (Wozniak & Pierce 1991; Laurikainen & Salo 2002; Erwin & Sparke 2003) and theoretical (Rautiainen & Salo 1999; Athanassoula & Misiriotis 2002; O’Neill & Dubinski 2003; Athanassoula 2005; Michel-Dansac & Wozniak 2006) studies have suggested that may underestimate the true bar size. The middle and right panels of Figure 1 show clearly that (solid ellipse) better matches the visual extent of the bar, both for the weak and strong bar examples. By comparison, (dashed ellipse) somewhat underestimates the bar size. Figure 2 shows that is statistically larger than by dex in TNG100, with the best-fit relation of .
An inner boundary of ellipse fitting is set at the central region of semi-major radius of 4 pixel. It excludes the regions where the results of ellipse fits are unreliable. We have visually checked that the inner boundary is neither too small nor too large to conduct reasonable bar measurements. It is worth mentioning that of % of the identified barred galaxies is equal to the value of such an inner boundary of ellipse fits, due to the fact that the ellipticities of these galaxies keep increasing towards the galactic centers. We found no clear bulges formed in these galaxies, which may explain the increase of ellipticities. thus is likely to underestimate bar sizes. Instead, is generally consistent with our visual judgement of the bar sizes in TNG100 galaxies, exhibiting a weaker dependence on the inner boundary. Therefore, we regard as the standard bar size in this paper.
The uncertainty of for each barred galaxy caused by both the artificial selection of the inner boundary and pixel size is shown by error bars in Figure 4. Here we vary the inner boundary from 2.3 to 4.3 pixels. We also repeat the same analysis on the images of pixel size 175x175 pc2 and 700x700 pc2. These experiments show that the bar fraction and bar strength are not significantly affected by the selection of inner boundary and pixel size. Table 1 gives the bar properties for all the barred galaxies; an extract is presented here while the full table is published electronically (www.tng-project.org/zhao20).
| Galaxy | |||||
|---|---|---|---|---|---|
| ID | () | (kpc) | (kpc) | ||
| (1) | (2) | (3) | (4) | (5) | (6) |
| 194950 | 10.79 | 0.58 | 0.67 | 3.40 | 4.77 |
| 197110 | 10.95 | 0.57 | 0.57 | 1.80 | 3.30 |
| 197112 | 10.68 | 0.60 | 0.50 | 2.45 | 3.07 |
| 197114 | 10.49 | 0.63 | 0.30 | 1.40 | 1.63 |
| 199322 | 10.69 | 0.62 | 0.60 | 1.41 | 2.59 |
| 327406 | 10.54 | 0.55 | 0.37 | 1.71 | 2.38 |
| 328253 | 10.57 | 0.56 | 0.42 | 2.35 | 3.33 |
| 328679 | 10.84 | 0.58 | 0.65 | 3.51 | 5.50 |
| 330209 | 10.52 | 0.57 | 0.57 | 2.47 | 3.30 |
| 330956 | 10.27 | 0.53 | 0.55 | 1.47 | 1.73 |
Note. — Col. (1): Galaxy ID. Col. (2): Stellar mass of host galaxy measured within a sphere of 30 kpc radius centered on the galaxy. Col. (3): Fraction of kinetic energy in ordered rotation. Col. (4): Bar strength, defined as the maximum ellipticity. Col. (5): Bar size measured at maximum ellipticity. Col. (6): Bar size defined as the radius where the ellipticity declines to 85% of the maximum value, with uncertainties caused by inner boundary and pixel size.
V Bars at
In this section we consider the properties of bars in the TNG100 disk galaxies at . We use surface mass density maps to derive quantities that are compared with observations, as well as to obtain the intrinsic properties of bars.
V.1 Bar Fractions

The fraction of barred galaxies as a function of in the parent disk sample is shown in Figure 3. It is well known that bars are generally more prominent in NIR bands because of lower dust attenuation in their central regions (Thronson et al. 1989; Block & Wainscoat 1991; Spillar et al. 1992). Thus, we compare the bar fraction in TNG100 with statistics derived from the S4G NIR survey. The bar fraction in TNG100 increases with stellar mass over the mass range , while it remains almost constant, at , over the same mass range for the S4G galaxies. TNG100 and S4G reach a similar bar fraction in galaxies with . However, the discrepancy in becomes significant in galaxies of lower and higher mass. Evidently TNG100 galaxies at host fewer bars compared to real galaxies, implying that they either do not generate them in the first place or that they have trouble maintaining them after formation. Conversely at the massive end (), TNG100 produces % more bars than the NIR observations, resulting in a bar fraction up to 75% compared with the lower S4G fraction of %.
As shown in Figure 3, our results are roughly consistent with the trends obtained by the Fourier method in both Rosas-Guevara et al. 2020 and Zhou et al. 2020. Our bar fractions, however, are generally larger than that of Zhou et al. 2020 who used a disk galaxy sample similar to ours. The reason is that the Fourier method is not as sensitive as ellipse fitting for finding short bars (see Section V.3 for details).
Since TNG100 barred galaxies are identified by mass density maps, the main conclusions are based on comparison with NIR observations, which are much more reliable in determining the overall mass distribution in galaxies and minimize the possibility of missing bars due to dust obscuration or confusion from bright young stellar populations suffered in optical observations. Nevertheless, for completeness we present a comparison with SDSS-based bar fractions in Appendix A.
Simulations of isolated disk galaxies show that bars grow more slowly in dynamically hotter disks (Athanassoula & Sellwood 1986). Cosmological simulations typically suffer from overheating, particularly in less massive galaxies, whose low particle number may suppress or delay bar formation. Comparison with higher resolution runs will be needed to ascertain whether the suppressed bar fraction in the less massive galaxies is predominantely due to the low numerical resolution of TNG100.
The overproduction of bars in the more massive galaxies clearly requires a different explanation. The bar fraction in TNG100 peaks at , where it reaches 75%, while only of S4G disk galaxies host bars. It is worth mentioning that S0 galaxies, which are highly incomplete in S4G, are excluded by Erwin 2018 but not by Díaz-García et al. 2016. This has a small effect on the bar fraction in massive galaxies, as illustrated in Figure 3. In the next subsection, we study the bar sizes to explore whether the overproduction of bars in TNG100 is somehow related to their size.
V.2 Bar Properties


The top panel of Figure 4 shows that bar strength in TNG100 galaxies varies widely in the range , independent of stellar masses. This is qualititively consistent with the distribution of bar strength from NIR observations (Díaz-García et al. 2016, e.g.,).
We notice in Section IV.2 that is consistent with the visual radius of TNG100 bar, while underestimates bar size. Therefore, is taken as the standard bar size in this paper to compare with the S4G results of Erwin 2018; Erwin 2019. As shown in Erwin 2018; Erwin 2019, many bars in S4G galaxies with are shorter than 1.4 kpc. Because we run the ellipse fitting with a inner boundary, the lower limit of the measured is close to 1.4 kpc. Thus, galaxies with bar sizes smaller than 1.4 kpc cannot be identified in TNG100, partially explaining the drop in the bar fraction in the mass range of (Figure 3).
Díaz-García et al. 2016 and Erwin 2018; Erwin 2019 showed that bars follow an empirical relation between bar size and total stellar mass, becoming larger in galaxies with . TNG100 barred galaxies follow a similar, but shallower, trend in the mass range (large dark blue dots with error bars in the bottom panel of Figure 4). In this mass range, the median size of the TNG100 bars is slightly shorter than that measured in the S4G survey. Relatively shorter bars (red dots) are present toward the high-mass end, falling below the lower boundary of Erwin 2019. Three examples of such short bars are shown in Figure 5.
The question of whether S4G can detect short bars in the massive galaxies therefore naturally arises. Using the S4G spiral galaxies at distance of Mpc, Erwin 2018 claimed that bars as short as kpc can be resolved, as confirmed by the high incidence of short bars in less massive galaxies (; Erwin 2018). A possible observational bias can arise if short bars are missed when they coexist with a massive bulge, which lowers the contrast and lowers . The black dotted line in the bottom panel of Figure 4 represents the median effective radii of bulges derived from over local galaxies (Berg et al. 2014). Bars with sizes longer than the bulge effective radii are unlikely to be missed in observations. Accordingly, the lack of massive galaxies with relatively short bars detected by S4G, especially the absence of barred galaxies in the region between the lower boundary of the grey shaded region and the black dotted line, implies that such short-bar galaxies are extremely rare in the local Universe. The foregoing considerations leads us to conclude that TNG100 overproduces short bars in massive galaxies. If these excess relatively short bars (red dots in Figure 4) are counted as unbarred galaxies, the overall bar fraction (cyan dots in Figure 3) come into a good agreement with the NIR observations. Though the median values of bar sizes (large cyan dots in Figure 4) are still somewhat smaller than the observations, the discrepancy is not significant, considering the large uncertainty in bar measurements.
The bar sizes used in Erwin 2018; Erwin 2019 were estimated visually. Their results are comparable with those obtained by in TNG100. As is smaller than , there is no doubt that an even larger number of short bars will be found in comparison with the bar sizes from S4G. If these short bars in massive galaxies are counted as unbarred galaxies, the overall bar fraction and bar sizes become more consistent with the NIR observations. Therefore, different definitions of bar size do not change our main conclusions.
Moreover, in Rosas-Guevara et al. 2020 bar sizes are defined as the radius at the maximum . Díaz-García et al. 2016 showed that visually estimated bar sizes are larger than those defined at maximum by a factor of . Therefore, it is not surprising that the bar sizes measured by Rosas-Guevara et al. 2020 could be as small as kpc. Consistently, Figure 3 of Rosas-Guevara et al. 2020 also shows some short bars in massive galaxies which are scarcely observed in observations.
V.3 Uncertainties Due to Selection Criteria
The bar fraction may also be affected by the criteria used to select disk galaxies in the first place. Can the difference between TNG100 and observations be caused by the selection criteria for disk galaxies? We investigate this issue here.
The literature employs five widely used sets of criteria to select disk galaxies:
- 1.
Konly: All rotation-dominated galaxies are included by setting the rotation criterion . This is the criterion used in this paper.
- 2.
KF: In addition to , the morphological flatness criterion is imposed, where where , , and are the eigenvalues of the mass tensor of the stellar mass inside and . These criteria select rotation-dominated galaxies with disky morphologies and are similar to those employed by Algorry et al. 2017 in the EAGLE simulation.
- 3.
KFsSFR: This set of criteria selects disk galaxies satisfying not only the KF criteria but also require the specific star formation rate , defined as the ratio between the star formation rate (SFR) and stellar mass. The SFR is derived by summing up the stars formed over the last 1 Gyr within (Donnari et al. 2019). Disk galaxies selected by these criteria are likely to be mainly late-type galaxies on the star-forming main sequence (Donnari et al. 2019; Xu et al. 2019, see), avoiding early-type galaxies.
- 4.
DTF: Disk galaxies are selected by requiring a disk-to-total mass ratio and flatness . The mass fraction of the disk component is kinematically derived by the method described in Abadi et al. 2003, Marinacci et al. 2014, and Genel et al. 2015, which sums up the stellar particles within having circularity parameter . This criterion has been applied in both the original Illustris (Peschken & Łokas 2019) and TNG100 (Zhou et al. 2020) data.
- 5.
BDT: Disk galaxies are selected by and , where the kinematically derived mass fraction of the bulge () is twice the mass fraction of counter-rotating stellar particles (). These criteria, used by Rosas-Guevara et al. 2020 for TNG100, tend to select strongly rotating disk galaxies, while galaxies that host significant warm components (e.g., thick disks and pseudo bulges) are excluded.
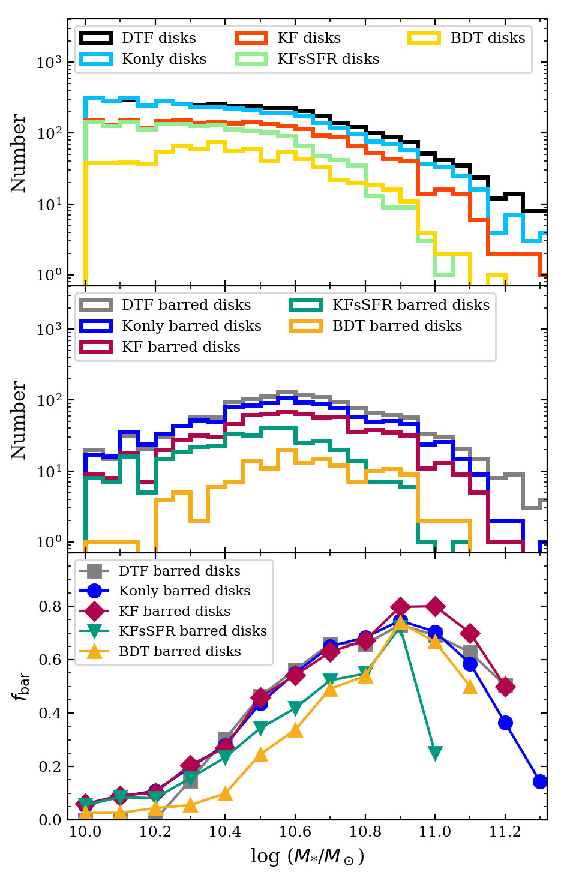

The five sets of criteria (Konly, KF, KFsSFR, DTF, and BDT) select 3866, 2291, 1664, 4015, and 795 disk galaxies, yielding 1182, 689, 299, 1316, and 163 barred galaxies, respectively. Apparently, the selection criteria become progressively stricter from Konly to KF to KFsSFR, resulting in fewer total disk and barred galaxies selected. The BDT criteria give the lowest number of galaxies.
The top and middle panel of Figure 6 show that KF (red and purple) gives a similar sample of disk (barred) galaxies as Konly (cyan and blue) in the high-mass end, but relatively fewer galaxies at low masses, suggesting that many rotation-dominated low-mass galaxies appear too thick and relatively spheroidal. Adding the sSFR condition (KFsSFR; lime and green) further removes relatively more quiescent galaxies at the high-mass end; this would select against S0 galaxies and bias the sample toward late-type disk galaxies.
The DTF criterion (black and grey) selects a similar sample of disk (barred) galaxies as our adopted standard Konly criterion. However, our ellipse fitting method identifies more barred galaxies compared to the Fourier method applied by Zhou et al. 2020 (see Figure 3). Comparing the barred galaxies identified independently by these two methods, we verified that the Fourier method is not as sensitive as ellipse fitting for finding short (bar size less than kpc) and weak (bar strength less than 0.4) bars. Within the mass range in which our studies overlap (), only of the short and weak bars we found are identified successfully in Zhou et al. 2020. For stronger and longer bars, the difference between these two methods are negligible. It is worth emphasizing that 43% of the short bars overproduced in TNG100 massive () galaxies (see Section V.2) are also identified by Zhou et al. 2020. Thus, our conclusion that TNG100 overproduces short bars in massive galaxies is confirmed qualitatively in the analysis of Zhou et al. 2020.
The BDT criteria (yellow and gold) select the smallest sample over the entire mass range, missing a large number of disk galaxies, barred or otherwise. Applying these criteria, Rosas-Guevara et al. 2020 select only 270 disk galaxies with . Figure 7 shows an example of an unbarred and barred galaxy selected by Konly but excluded from the BDT sample. There is little doubt that these cases should have been included. There are two possible reasons why the BDT criteria miss the majority of disk galaxies in TNG100, especially those with strong (bar strength larger than ) and long (bar size larger than kpc) bars. First, many TNG100 galaxies have a massive warm disk. As shown by Du et al. 2020, the kinematically derived warm disk contributes of the total stellar mass. Secondy, particles on bar orbits necessarily have smaller circularity, and hence they are more likely to be classified as belonging to the hotter components instead of the cold disk22 2 See Figure 12 in Du et al. 2019 for an example.. These reasons probably explain why we find that BDT misses disk galaxies with strong (bar strength larger than ) and long (bar size larger than kpc) bars.
Although different criteria select very different samples of disk galaxies, their bar fractions follow a surprisingly similar tendency to increase systematically with stellar mass (bottom panel of Figure 6). The uncertainty in bar fraction resulting from differences in selection criteria is less than 15% across almost the entire mass range. Thus, the inconsistency between TNG100 and observations cannot be explained by the criteria used to select disks in TNG100.
VI Evolution of Bars


We study the evolution of the bar fraction at to using two methods. First, at all redshifts, the sample of massive disk galaxies is selected using the same criteria, and a constant mass cut of . The ellipse fitting method is applied to the face-on view of the mass surface density maps. Figure 8 shows that the total bar fraction (solid blue dots) is nearly constant, increasing slightly from 0.57 at to 0.63 at . The left column of Figure 9 shows that, using this method, disk or barred galaxies have a similar number distribution over , and the bar fraction at all redshifts roughly follows a similar trend. Additionally, Figure 10 shows that during the past 6 Gyr bars have maintained nearly constant strength (), while the bar sizes have grown by 0.17 dex.
The second method aims to trace the progenitors of disk galaxies with . The progenitor of each galaxy corresponds to the most massive one in its merger tree created by the SUBLINK algorithm (Rodriguez-Gomez et al. 2015). We have confirmed that most of the progenitors are already rotation-dominated objects with since . Figure 8 shows that the total bar fraction (solid light blue triangles) increases quickly from at to at . This result suggests that a large fraction of bar structures form at . As shown in the right column of Figure 9, most bar structures form when disk galaxies grow more massive than . Consistent with the results of the first method, the bar strengths are nearly constant, and the bar sizes grow similarly during . The increase of bar size with time qualitatively supports the picture that bars grow longer from outward transport of angular momentum (Debattista & Sellwood 2000; Athanassoula 2004). The results discussed above suggest that bars have already existed in a large fraction of massive disk galaxies at . However, many such high- massive (barred) disk galaxies become elliptical galaxies with , possibly due to mergers.
In Figure 8, we also compare the evolution of bar fractions between observations and the simulation. It is worth emphasizing that it is very difficult to make an accurate comparison between simulation results and observations at high redshifts, mainly due to the large uncertainty in the sample selection and bar measurement. Thus, here we only make a qualitative comparison. The high resolution of the Hubble Space Telescope (HST) enables the detection of bar structures at high redshifts. Using a large sample of spiral galaxies in the COSMOS field, Sheth et al. 2008 showed that the bar fraction increases from at to at by tracing back all galaxies brighter than with an empirically determined luminosity evolution in Capak 2003 ( mag at ). Additionally, Cameron et al. 2010 demonstrated an increase bar fraction during for COSMOS disk galaxies with . Melvin et al. 2014 also suggested a sharp increase of overall bar fraction during for massive disk galaxies with selected from the COSMOS sample.
The methods used in these observations to trace the cosmic evolution of bars are similar to our first method using a constant mass cut. There is a clear discrepancy between TNG100 bar fractions (blue dots) and observations (open points), as shown in Figure 8. It may be due to the fact that only bars with size kpc can be detected at by the HST images, while high- bars measured in TNG100 can be as small as kpc. If only bars of radius kpc are taken into account at all redshifts to select barred galaxies, which is the same as Cameron et al. 2010, the bar fraction evolution (solid magenta dots in Figure 8) becomes roughly consistent with the results from Cameron et al. 2010 (open triangles). Therefore, the discrepancy of bar fractions between TNG100 and observations may be due to the failure of observations to detect short bars. Moreover, short bars overproduced in TNG100 massive galaxies, as presented in Section V.2, may also contribute to the discrepancy between the simulation and observations.
VII Conclusions
We systematically study the properties of barred galaxies in the cosmological simulation IllustrisTNG. Bars are identified from ellipse fitting of the face-on mass surface density maps of 3866 disk galaxies selected from a parent sample of 6507 galaxies with stellar masses produced from the TNG100 run. A detailed catalog, including the strengths and sizes of the bars, is publicly released with this paper.
TNG100 represents remarkable progress in that a significant fraction of disk galaxies generate reasonable bars. About 55% of disk galaxies with stellar mass host bars, in agreement with observations. The bars in the simulated galaxies follow a bar size-stellar mass scaling relation that is roughly consistent with NIR observations. Notwithstanding these significant successes, some clear discrepancies with observations remain. For more massive galaxies (), the TNG100 bar fraction is higher than observed in the NIR. We attribute this to an excess population of short (radius kpc) bars in the simulations. The predicted bar fractions align better with observations if the massive galaxies with short bars are counted as unbarred galaxies, suggesting that TNG100 overproduces, or retains, too many short bars in massive disk galaxies. At the same time, the bar fraction of galaxies with decreases drastically toward the low-mass end, in sharp conflict with observations. We attribute this discrepancy to the inability of the present modest resolution of TNG100 to detect bars with radii kpc.
Two methods are applied to trace the evolution of TNG100 bar fraction during . One is to select disk galaxies at each snapshot using a constant mass cut of . The other one is to trace the progenitors of massive disk galaxies of . The bar fraction in TNG100 disk galaxies are nearly constant at by constant mass cut, while it decreases dramatically in observations using a similar sample selection. We suggest that observations may fail in identifying short bars of radius kpc at high redshifts, or TNG100 have produced too many bars since .
Appendix A Comparison with SDSS Observations
Rodriguez-Gomez et al. 2019 generate mock SDSS images for TNG100 galaxies using the SKIRT radiative transfer code, taking into consideration the effects of the point-spread function and dust attenuation and scattering. The bar fractions estimated using the mock SDSS -band images can be directly compared with those derived from SDSS observations. Since the mock images of TNG100 galaxies are randomly oriented, only the disk galaxies with inclination angle are selected33 3 Disk inclination is derived from , where is the ellipticity of the disk at .. This is satisfied by 2790 out of the 3866 disks galaxies initially selected by the Konly criterion. To ensure proper comparison with the corresponding SDSS observations, barred galaxies are identified both by ellipse fitting and by visual inspection.

Figure 11 shows that the bar fraction increases as a function of stellar mass, with the dark red squares showing the ellipse fitting results and the dark green squares showing those based on visual inspection. The bar fractions based on ellipse fitting are larger than those based on visual classification, in agreement with observational studies (Oh et al. 2012; Lee et al. 2019, e.g.,), which find that ellipse fitting is more sensitive to weak bars. We reconfirm this by showing the fraction of strongly barred TNG100 galaxies identified by ellipse fitting (pink squares), which is consistent with the visually estimated bar fraction (dark green squares). Moreover, we find that bars identified in mock images are larger than 2.5 kpc in radius, which implies that the short bars detected in massive galaxies (see Section V.2) cannot be resolved by mock images. Erwin 2018 previously noted that bar radius smaller than kpc cannot be detected in SDSS images.
We first compare from visual inspection (dark green squares) with SDSS-based visual bar fractions (Oh et al. 2012; Cervantes Sodi et al. 2015; Gavazzi et al. 2015, i.e.,). At , TNG100 exhibits lower than SDSS, probably due to low numerical resolution. In contrast, TNG100’s shows excellent agreement with SDSS for . The mock SDSS images reveal as many long and strong bars as optical SDSS observations. Turning to the results derived from ellipse fitting, TNG100 yields considerably lower than observed at but achieves better consistency at (Barazza et al. 2008; Consolandi 2016; Lee et al. 2019). The dearth of SDSS data at precludes a meaningful comparison at the highest mass end.
Note that Barazza et al. 2008 obtain a lower at compared to other studies. We suspect that this is caused by differences in morphological type. While most studies mainly consider Sa–Sb spirals at the massive end, Barazza et al. 2008 only focus on Sd and Sm spirals, whose bar fraction is about 20% lower than that of Sa–Sb spirals (Giordano et al. 2010).
References
- Abadi et al. (2003) Abadi, M. G., Navarro, J. F., Steinmetz, M., & Eke, V. R. 2003, ApJ, 597, 21, doi: 10.1086/378316
- Agertz et al. (2011) Agertz, O., Teyssier, R., & Moore, B. 2011, MNRAS, 410, 1391, doi: 10.1111/j.1365-2966.2010.17530.x
- Aguerri et al. (2009) Aguerri, J. A. L., Méndez-Abreu, J., & Corsini, E. M. 2009, A&A, 495, 491, doi: 10.1051/0004-6361:200810931
- Algorry et al. (2017) Algorry, D. G., Navarro, J. F., Abadi, M. G., et al. 2017, MNRAS, 469, 1054, doi: 10.1093/mnras/stx1008
- Athanassoula (1992) Athanassoula, E. 1992, MNRAS, 259, 328, doi: 10.1093/mnras/259.2.328
- Athanassoula (2003) —. 2003, MNRAS, 341, 1179, doi: 10.1046/j.1365-8711.2003.06473.x
- Athanassoula (2004) Athanassoula, E. 2004, in IAU Symposium, Vol. 220, Dark Matter in Galaxies, ed. S. Ryder, D. Pisano, M. Walker, & K. Freeman, 255. https://arxiv.org/abs/astro-ph/0312155
- Athanassoula (2005) —. 2005, MNRAS, 358, 1477, doi: 10.1111/j.1365-2966.2005.08872.x
- Athanassoula & Misiriotis (2002) Athanassoula, E., & Misiriotis, A. 2002, MNRAS, 330, 35, doi: 10.1046/j.1365-8711.2002.05028.x
- Athanassoula & Sellwood (1986) Athanassoula, E., & Sellwood, J. A. 1986, MNRAS, 221, 213, doi: 10.1093/mnras/221.2.213
- Aumer et al. (2013) Aumer, M., White, S. D. M., Naab, T., & Scannapieco, C. 2013, MNRAS, 434, 3142, doi: 10.1093/mnras/stt1230
- Barazza et al. (2008) Barazza, F. D., Jogee, S., & Marinova, I. 2008, ApJ, 675, 1194, doi: 10.1086/526510
- Berg et al. (2014) Berg, T. A. M., Simard, L., Mendel, T. J., & Ellison, S. L. 2014, MNRAS, 440, L66, doi: 10.1093/mnrasl/slu026
- Binney & Tremaine (2008) Binney, J., & Tremaine, S. 2008, Galactic Dynamics: Second Edition
- Block & Wainscoat (1991) Block, D. L., & Wainscoat, R. J. 1991, Nature, 353, 48, doi: 10.1038/353048a0
- Cameron et al. (2010) Cameron, E., Carollo, C. M., Oesch, P., et al. 2010, MNRAS, 409, 346, doi: 10.1111/j.1365-2966.2010.17314.x
- Capak (2003) Capak, P. 2003, Ph.D. thesis, Univ. Hawaii
- Cervantes Sodi et al. (2015) Cervantes Sodi, B., Li, C., & Park, C. 2015, ApJ, 807, 111, doi: 10.1088/0004-637X/807/1/111
- Cheung et al. (2013) Cheung, E., Athanassoula, E., Masters, K. L., et al. 2013, ApJ, 779, 162, doi: 10.1088/0004-637X/779/2/162
- Colín et al. (2016) Colín, P., Avila-Reese, V., Roca-Fàbrega, S., & Valenzuela, O. 2016, ApJ, 829, 98, doi: 10.3847/0004-637X/829/2/98
- Conselice (2006) Conselice, C. J. 2006, MNRAS, 373, 1389, doi: 10.1111/j.1365-2966.2006.11114.x
- Consolandi (2016) Consolandi, G. 2016, A&A, 595, A67, doi: 10.1051/0004-6361/201629115
- Crain et al. (2015) Crain, R. A., Schaye, J., Bower, R. G., et al. 2015, MNRAS, 450, 1937, doi: 10.1093/mnras/stv725
- Curir et al. (2006) Curir, A., Mazzei, P., & Murante, G. 2006, A&A, 447, 453, doi: 10.1051/0004-6361:20053418
- Davis et al. (1985) Davis, M., Efstathiou, G., Frenk, C. S., & White, S. D. M. 1985, ApJ, 292, 371, doi: 10.1086/163168
- de Vaucouleurs et al. (1991) de Vaucouleurs, G., de Vaucouleurs, A., Corwin, Herold G., J., et al. 1991, Third Reference Catalogue of Bright Galaxies
- Debattista et al. (2019) Debattista, V. P., Gonzalez, O. A., Sand erson, R. E., et al. 2019, MNRAS, 485, 5073, doi: 10.1093/mnras/stz746
- Debattista & Sellwood (1998) Debattista, V. P., & Sellwood, J. A. 1998, ApJL, 493, L5, doi: 10.1086/311118
- Debattista & Sellwood (2000) —. 2000, ApJ, 543, 704, doi: 10.1086/317148
- Díaz-García et al. (2016) Díaz-García, S., Salo, H., Laurikainen, E., & Herrera-Endoqui, M. 2016, A&A, 587, A160, doi: 10.1051/0004-6361/201526161
- Dolag et al. (2009) Dolag, K., Borgani, S., Murante, G., & Springel, V. 2009, MNRAS, 399, 497, doi: 10.1111/j.1365-2966.2009.15034.x
- Donnari et al. (2019) Donnari, M., Pillepich, A., Nelson, D., et al. 2019, MNRAS, 485, 4817, doi: 10.1093/mnras/stz712
- Du et al. (2017) Du, M., Debattista, V. P., Shen, J., Ho, L. C., & Erwin, P. 2017, ApJL, 844, L15, doi: 10.3847/2041-8213/aa7ecb
- Du et al. (2020) Du, M., Ho, L. C., Debattista, V. P., et al. 2020, arXiv e-prints, arXiv:2002.04182. https://arxiv.org/abs/2002.04182
- Du et al. (2019) Du, M., Debattista, V. P., Ho, L. C., et al. 2019, ApJ, 875, 58, doi: 10.3847/1538-4357/ab0e0c
- Erwin (2018) Erwin, P. 2018, MNRAS, 474, 5372, doi: 10.1093/mnras/stx3117
- Erwin (2019) —. 2019, MNRAS, 489, 3553, doi: 10.1093/mnras/stz2363
- Erwin & Debattista (2016) Erwin, P., & Debattista, V. P. 2016, ApJL, 825, L30, doi: 10.3847/2041-8205/825/2/L30
- Erwin & Sparke (2003) Erwin, P., & Sparke, L. S. 2003, ApJS, 146, 299, doi: 10.1086/367885
- Eskridge et al. (2000) Eskridge, P. B., Frogel, J. A., Pogge, R. W., et al. 2000, AJ, 119, 536, doi: 10.1086/301203
- Gavazzi et al. (2015) Gavazzi, G., Consolandi, G., Dotti, M., et al. 2015, A&A, 580, A116, doi: 10.1051/0004-6361/201425351
- Genel et al. (2015) Genel, S., Fall, S. M., Hernquist, L., et al. 2015, ApJL, 804, L40, doi: 10.1088/2041-8205/804/2/L40
- Genel et al. (2014) Genel, S., Vogelsberger, M., Springel, V., et al. 2014, MNRAS, 445, 175, doi: 10.1093/mnras/stu1654
- Giordano et al. (2010) Giordano, L., Tran, K.-V. H., Moore, B., & Saintonge, A. 2010, arXiv e-prints, arXiv:1002.3167. https://arxiv.org/abs/1002.3167
- Goulding et al. (2017) Goulding, A. D., Matthaey, E., Greene, J. E., et al. 2017, ApJ, 843, 135, doi: 10.3847/1538-4357/aa755b
- Goz et al. (2015) Goz, D., Monaco, P., Murante, G., & Curir, A. 2015, MNRAS, 447, 1774, doi: 10.1093/mnras/stu2557
- Grand et al. (2017) Grand, R. J. J., Gómez, F. A., Marinacci, F., et al. 2017, MNRAS, 467, 179, doi: 10.1093/mnras/stx071
- Guedes et al. (2011) Guedes, J., Callegari, S., Madau, P., & Mayer, L. 2011, ApJ, 742, 76, doi: 10.1088/0004-637X/742/2/76
- Guedes et al. (2013) Guedes, J., Mayer, L., Carollo, M., & Madau, P. 2013, ApJ, 772, 36, doi: 10.1088/0004-637X/772/1/36
- Guo et al. (2020) Guo, M., Du, M., Ho, L. C., Debattista, V. P., & Zhao, D. 2020, ApJ, 888, 65, doi: 10.3847/1538-4357/ab584a
- Herrera-Endoqui et al. (2015) Herrera-Endoqui, M., Díaz-García, S., Laurikainen, E., & Salo, H. 2015, A&A, 582, A86, doi: 10.1051/0004-6361/201526047
- Ho et al. (1997) Ho, L. C., Filippenko, A. V., & Sargent, W. L. W. 1997, ApJ, 487, 591, doi: 10.1086/304643
- Huertas-Company et al. (2019) Huertas-Company, M., Rodriguez-Gomez, V., Nelson, D., et al. 2019, MNRAS, 489, 1859, doi: 10.1093/mnras/stz2191
- Hunt & Malkan (1999) Hunt, L. K., & Malkan, M. A. 1999, ApJ, 516, 660, doi: 10.1086/307150
- Jogee et al. (1999) Jogee, S., Kenney, J. D. P., & Smith, B. J. 1999, ApJ, 526, 665, doi: 10.1086/308021
- Jogee et al. (2005) Jogee, S., Scoville, N., & Kenney, J. D. P. 2005, ApJ, 630, 837, doi: 10.1086/432106
- Jogee et al. (2004) Jogee, S., Barazza, F. D., Rix, H.-W., et al. 2004, ApJL, 615, L105, doi: 10.1086/426138
- Jungwiert et al. (1997) Jungwiert, B., Combes, F., & Axon, D. J. 1997, A&AS, 125, 479, doi: 10.1051/aas:1997236
- Kim et al. (2012) Kim, W.-T., Seo, W.-Y., & Kim, Y. 2012, ApJ, 758, 14, doi: 10.1088/0004-637X/758/1/14
- Knapen et al. (2000) Knapen, J. H., Shlosman, I., & Peletier, R. F. 2000, ApJ, 529, 93, doi: 10.1086/308266
- Kormendy (2013) Kormendy, J. 2013, Secular Evolution in Disk Galaxies, ed. J. Falcón-Barroso & J. H. Knapen, 1
- Kormendy & Kennicutt (2004) Kormendy, J., & Kennicutt, Robert C., J. 2004, ARA&A, 42, 603, doi: 10.1146/annurev.astro.42.053102.134024
- Kraljic et al. (2012) Kraljic, K., Bournaud, F., & Martig, M. 2012, ApJ, 757, 60, doi: 10.1088/0004-637X/757/1/60
- Laine et al. (2002a) Laine, S., Shlosman, I., Knapen, J. H., & Peletier, R. F. 2002a, ApJ, 567, 97, doi: 10.1086/323964
- Laine et al. (2002b) —. 2002b, ApJ, 567, 97, doi: 10.1086/323964
- Laurikainen & Salo (2002) Laurikainen, E., & Salo, H. 2002, MNRAS, 337, 1118, doi: 10.1046/j.1365-8711.2002.06008.x
- Lee et al. (2012) Lee, G.-H., Woo, J.-H., Lee, M. G., et al. 2012, ApJ, 750, 141, doi: 10.1088/0004-637X/750/2/141
- Lee et al. (2019) Lee, Y. H., Ann, H. B., & Park, M.-G. 2019, ApJ, 872, 97, doi: 10.3847/1538-4357/ab0024
- Li et al. (2015) Li, Z., Shen, J., & Kim, W.-T. 2015, ApJ, 806, 150, doi: 10.1088/0004-637X/806/2/150
- Li et al. (2017) Li, Z.-Y., Ho, L. C., & Barth, A. J. 2017, ApJ, 845, 87, doi: 10.3847/1538-4357/aa7fba
- Li et al. (2011) Li, Z.-Y., Ho, L. C., Barth, A. J., & Peng, C. Y. 2011, ApJS, 197, 22, doi: 10.1088/0067-0049/197/2/22
- Marinacci et al. (2014) Marinacci, F., Pakmor, R., & Springel, V. 2014, MNRAS, 437, 1750, doi: 10.1093/mnras/stt2003
- Marinacci et al. (2018) Marinacci, F., Vogelsberger, M., Pakmor, R., et al. 2018, MNRAS, 480, 5113, doi: 10.1093/mnras/sty2206
- Marinova & Jogee (2007) Marinova, I., & Jogee, S. 2007, ApJ, 659, 1176, doi: 10.1086/512355
- Martinez-Valpuesta et al. (2006) Martinez-Valpuesta, I., Shlosman, I., & Heller, C. 2006, ApJ, 637, 214, doi: 10.1086/498338
- Masters et al. (2011) Masters, K. L., Nichol, R. C., Hoyle, B., et al. 2011, MNRAS, 411, 2026, doi: 10.1111/j.1365-2966.2010.17834.x
- Masters et al. (2012) Masters, K. L., Nichol, R. C., Haynes, M. P., et al. 2012, MNRAS, 424, 2180, doi: 10.1111/j.1365-2966.2012.21377.x
- Melvin et al. (2014) Melvin, T., Masters, K., Lintott, C., et al. 2014, MNRAS, 438, 2882, doi: 10.1093/mnras/stt2397
- Menéndez-Delmestre et al. (2007) Menéndez-Delmestre, K., Sheth, K., Schinnerer, E., Jarrett, T. H., & Scoville, N. Z. 2007, ApJ, 657, 790, doi: 10.1086/511025
- Merritt & Sellwood (1994) Merritt, D., & Sellwood, J. A. 1994, ApJ, 425, 551, doi: 10.1086/174005
- Michel-Dansac & Wozniak (2006) Michel-Dansac, L., & Wozniak, H. 2006, A&A, 452, 97, doi: 10.1051/0004-6361:20041038
- Murante et al. (2015) Murante, G., Monaco, P., Borgani, S., et al. 2015, MNRAS, 447, 178, doi: 10.1093/mnras/stu2400
- Naiman et al. (2018) Naiman, J. P., Pillepich, A., Springel, V., et al. 2018, MNRAS, 477, 1206, doi: 10.1093/mnras/sty618
- Nair & Abraham (2010a) Nair, P. B., & Abraham, R. G. 2010a, ApJS, 186, 427, doi: 10.1088/0067-0049/186/2/427
- Nair & Abraham (2010b) —. 2010b, ApJL, 714, L260, doi: 10.1088/2041-8205/714/2/L260
- Nelson et al. (2018) Nelson, D., Pillepich, A., Springel, V., et al. 2018, MNRAS, 475, 624, doi: 10.1093/mnras/stx3040
- Nelson et al. (2019) Nelson, D., Springel, V., Pillepich, A., et al. 2019, Computational Astrophysics and Cosmology, 6, 2, doi: 10.1186/s40668-019-0028-x
- Oh et al. (2012) Oh, S., Oh, K., & Yi, S. K. 2012, ApJS, 198, 4, doi: 10.1088/0067-0049/198/1/4
- O’Neill & Dubinski (2003) O’Neill, J. K., & Dubinski, J. 2003, MNRAS, 346, 251, doi: 10.1046/j.1365-2966.2003.07085.x
- Park et al. (2019) Park, M.-J., Yi, S. K., Dubois, Y., et al. 2019, ApJ, 883, 25, doi: 10.3847/1538-4357/ab3afe
- Peschken & Łokas (2019) Peschken, N., & Łokas, E. L. 2019, MNRAS, 483, 2721, doi: 10.1093/mnras/sty3277
- Pillepich et al. (2018a) Pillepich, A., Springel, V., Nelson, D., et al. 2018a, MNRAS, 473, 4077, doi: 10.1093/mnras/stx2656
- Pillepich et al. (2018b) Pillepich, A., Nelson, D., Hernquist, L., et al. 2018b, MNRAS, 475, 648, doi: 10.1093/mnras/stx3112
- Raha et al. (1991) Raha, N., Sellwood, J. A., James, R. A., & Kahn, F. D. 1991, Nature, 352, 411, doi: 10.1038/352411a0
- Rautiainen & Salo (1999) Rautiainen, P., & Salo, H. 1999, A&A, 348, 737
- Rodriguez-Gomez et al. (2015) Rodriguez-Gomez, V., Genel, S., Vogelsberger, M., et al. 2015, MNRAS, 449, 49, doi: 10.1093/mnras/stv264
- Rodriguez-Gomez et al. (2019) Rodriguez-Gomez, V., Snyder, G. F., Lotz, J. M., et al. 2019, MNRAS, 483, 4140, doi: 10.1093/mnras/sty3345
- Rosas-Guevara et al. (2020) Rosas-Guevara, Y., Bonoli, S., Dotti, M., et al. 2020, MNRAS, 491, 2547, doi: 10.1093/mnras/stz3180
- Roškar et al. (2014) Roškar, R., Teyssier, R., Agertz, O., Wetzstein, M., & Moore, B. 2014, MNRAS, 444, 2837, doi: 10.1093/mnras/stu1548
- Sales et al. (2010) Sales, L. V., Navarro, J. F., Schaye, J., et al. 2010, MNRAS, 409, 1541, doi: 10.1111/j.1365-2966.2010.17391.x
- Sandage & Tammann (1987) Sandage, A., & Tammann, G. A. 1987, A Revised Shapley-Ames Catalog of Bright Galaxies
- Schaye et al. (2015) Schaye, J., Crain, R. A., Bower, R. G., et al. 2015, MNRAS, 446, 521, doi: 10.1093/mnras/stu2058
- Sellwood (2013) Sellwood, J. A. 2013, ApJL, 769, L24, doi: 10.1088/2041-8205/769/2/L24
- Sellwood (2014) —. 2014, Reviews of Modern Physics, 86, 1, doi: 10.1103/RevModPhys.86.1
- Sellwood et al. (2019) Sellwood, J. A., Shen, J., & Li, Z. 2019, MNRAS, 486, 4710, doi: 10.1093/mnras/stz1145
- Sellwood & Wilkinson (1993) Sellwood, J. A., & Wilkinson, A. 1993, Reports on Progress in Physics, 56, 173, doi: 10.1088/0034-4885/56/2/001
- Shen et al. (2010) Shen, J., Rich, R. M., Kormendy, J., et al. 2010, ApJL, 720, L72, doi: 10.1088/2041-8205/720/1/L72
- Sheth et al. (2003) Sheth, K., Regan, M. W., Scoville, N. Z., & Strubbe, L. E. 2003, ApJL, 592, L13, doi: 10.1086/377329
- Sheth et al. (2008) Sheth, K., Elmegreen, D. M., Elmegreen, B. G., et al. 2008, ApJ, 675, 1141, doi: 10.1086/524980
- Sheth et al. (2010) Sheth, K., Regan, M., Hinz, J. L., et al. 2010, PASP, 122, 1397, doi: 10.1086/657638
- Skibba et al. (2012) Skibba, R. A., Masters, K. L., Nichol, R. C., et al. 2012, MNRAS, 423, 1485, doi: 10.1111/j.1365-2966.2012.20972.x
- Spillar et al. (1992) Spillar, E. J., Oh, S. P., Johnson, P. E., & Wenz, M. 1992, AJ, 103, 793, doi: 10.1086/116101
- Springel (2010) Springel, V. 2010, MNRAS, 401, 791, doi: 10.1111/j.1365-2966.2009.15715.x
- Springel et al. (2001) Springel, V., White, S. D. M., Tormen, G., & Kauffmann, G. 2001, MNRAS, 328, 726, doi: 10.1046/j.1365-8711.2001.04912.x
- Springel et al. (2018) Springel, V., Pakmor, R., Pillepich, A., et al. 2018, MNRAS, 475, 676, doi: 10.1093/mnras/stx3304
- Stinson et al. (2013) Stinson, G. S., Brook, C., Macciò, A. V., et al. 2013, MNRAS, 428, 129, doi: 10.1093/mnras/sts028
- Tacchella et al. (2019) Tacchella, S., Diemer, B., Hernquist, L., et al. 2019, MNRAS, 487, 5416, doi: 10.1093/mnras/stz1657
- Thronson et al. (1989) Thronson, Harley A., J., Hereld, M., Majewski, S., et al. 1989, ApJ, 343, 158, doi: 10.1086/167693
- Toomre (1981) Toomre, A. 1981, in Structure and Evolution of Normal Galaxies, ed. S. M. Fall & D. Lynden-Bell, 111–136
- Vogelsberger et al. (2014) Vogelsberger, M., Genel, S., Springel, V., et al. 2014, MNRAS, 444, 1518, doi: 10.1093/mnras/stu1536
- Weinberger et al. (2017) Weinberger, R., Springel, V., Hernquist, L., et al. 2017, MNRAS, 465, 3291, doi: 10.1093/mnras/stw2944
- Wozniak et al. (1995) Wozniak, H., Friedli, D., Martinet, L., Martin, P., & Bratschi, P. 1995, A&AS, 111, 115
- Wozniak & Pierce (1991) Wozniak, H., & Pierce, M. J. 1991, A&AS, 88, 325
- Xu et al. (2019) Xu, D., Zhu, L., Grand, R., et al. 2019, MNRAS, 489, 842, doi: 10.1093/mnras/stz2164
- York et al. (2000) York, D. G., Adelman, J., Anderson, Jr., J. E., et al. 2000, AJ, 120, 1579, doi: 10.1086/301513
- Zhou et al. (2020) Zhou, Z.-B., Zhu, W., Wang, Y., & Feng, L.-L. 2020, arXiv e-prints, arXiv:2004.11620. https://arxiv.org/abs/2004.11620
- Zhu et al. (2018) Zhu, L., van de Ven, G., van den Bosch, R., et al. 2018, Nature Astronomy, 2, 233, doi: 10.1038/s41550-017-0348-1