Swift unveils the orbital period of IGR J18214-1318Swift unveils the orbital period of IGR J18214-1318–
Abstract
We analysed 13 years of the Neil Gehrels Swift Observatory survey data collected on the High Mass X-ray Binary IGR J18214-1318. Performing the timing analysis we detected a periodic signal of d. From the companion star characteristics we derived an average orbital separation of . The spectral type of the companion star (O9) and the tight orbital separation suggest that IGR J18214-1318 is a wind accreting source with eccentricity lower than 0.17. The intensity profile folded at the orbital period shows a deep minimum compatible with an eclipse of the source by the companion star. In addition, we report on the broad-band 0.6–100 keV spectrum using data from XMM-Newton, NuSTAR, and Swift, applying self-consistent physical models. We find that the spectrum is well fitted either by a pure thermal Comptonization component, or, assuming that the source is a neutron star accreting above the critical regime, by a combined thermal and bulk-motion Comptonization model. In both cases, the presence of a local neutral absorption (possibly related to the thick wind of the companion star) is required.
Keywords:
X-rays: binaries – X-rays: individual: IGR J18214-1318. Facility: Swift1 Introduction
During the last two decades astronomers have taken advantage of two prolific telescopes in the hard X-ray domain: the IBIS/ISGRI telescope (Ubertini et al. 2003; Lebrun et al. 2003) on board the International Gamma-Ray Astrophysics Laboratory (INTEGRAL) satellite (Winkler et al. 2003) and the Burst Alert Telescope (Barthelmy et al. 2005, BAT) on board the Neil Gehrels Swift Observatory (Gehrels et al. 2004; hereafter Swift). IBIS/ISGRI has performed a deep and continuous scanning of the Galactic plane along the years revealing a large number of new X-ray sources, among which many were High Mass X-ray Binaries (HMXBs). These are usually distinguished into two sub-groups based on the observed spectral emission and variability: obscured HMXBs and Supergiant Fast X-ray Transients (Sguera et al. 2005; in’t Zand 2005; Negueruela et al. 2006a; Martínez-Núñez et al. 2017; Bozzo et al. 2017, SFXT). The former are immersed in the wind from the companion star and, as a consequence, strong absorption have made their detection harder for soft X-ray instruments; the latter group shows very bright, but rapidly transient flares, and were revealed thanks to the continuous scan of the Galactic plane performed by INTEGRAL. The association of these sources to the class of HMXBs has been inferred either through the discovery of their optical counterparts (Filliatre & Chaty 2004; Chaty 2004; Reig et al. 2005; Masetti et al. 2006; Negueruela et al. 2006b; Zurita Heras & Chaty 2008, e.g.) or by the observation of long periodicities. These can be due either to the occultation of the neutron star by the supergiant companion or to the periodic enhancement of their X-ray emission at the periastron passage of the neutron star in an eccentric orbit. BAT is playing an important role in the study of many of these new INTEGRAL sources. Thanks to its large field of view (1.4 steradians half coded) and to frequent changes in the satellite pointing direction, BAT monitors daily 90 per cent of the sky, making it an efficient tool to detect transient phenomena from known and unknown sources (Krimm et al. 2013). Combining the entire time span of its survey data, several long periodicities of HMXBs have been revealed (Corbet & Krimm 2009; Corbet & Krimm 2010; Corbet et al. 2010d; Corbet et al. 2010c; Corbet et al. 2010b; Corbet et al. 2010a; Cusumano et al. 2010; La Parola et al. 2010; D’Aì et al. 2011b; D’Aì et al. 2011a; La Parola et al. 2013; Cusumano et al. 2013a; Cusumano et al. 2013b; Segreto et al. 2013b; Segreto et al. 2013a; La Parola et al. 2014; D’Aì et al. 2015; Cusumano et al. 2015; Cusumano et al. 2016, e.g.).
In this work we present a temporal and spectral analysis of IGR J18214-1318, a source discovered by INTEGRAL on the Galactic plane. This source was observed with a flux of 1 mCrab in the energy band 17–60 keV (Bird et al. 2006; Krivonos et al. 2012; Bird et al. 2016) and localised through a Chandra observation at coordinates (J2000) R.A. = 18h21m19.76s, Dec. = -13 (Tomsick et al. 2008). IGR J18214-1318 is associated to USNO-B1.0 0766-0475700, most likely a O9I star, and classified as an obscured HMXB (Butler et al. 2009). The Chandra spectrum is well modelled by a simple power law with a photon index = , absorbed by an equivalent absorption column = (1.20.3) cm-2. Using Swift data, Rodriguez et al. 2009 measured a photon index of and a column density of = cm-2, significantly lower than the value measured with Chandra and consistent with the Galactic along the line of sight to IGR J18214-1318. A high-statistics broadband spectrum from data collected by XMM- (Jansen et al. 2001) and NuSTAR (Harrison et al. 2013) could be well modelled in the hard X-ray region with a power-law modified by an exponential cut-off with e-folding energy keV and a cut-off at 10 keV. In the softer band, an equivalent fit could be obtained either by adding a black-body component with a temperature of 1.74 keV or with a partial covering absorber of 1023 cm-2 and 77% of covering fraction (Fornasini et al. 2017). In both cases, an iron K emission line at 6.4 keV was detected with an equivalent width 55 eV. Timing analysis did not reveal any periodicity in the frequency range 0.1–88 Hz with a 90% upper limit on the rms noise level of 2.2%.
2 Data Reduction
We made use for this work of data from BAT, XRT (Burrows et al. 2004, X-ray Telescope), XMM-Newton, and NuSTAR.
We retrieved BAT survey data between 2004 December and 2017 February from the HEASARC public archive11 1 http://heasarc.gsfc.nasa.gov/docs/archive.html and processed them using the batimager code (Segreto et al. 2010), dedicated to the processing of coded mask instrument data. IGR J18214-1318 is detected with a significance of 24.7 standard deviations in the 20–85 keV all sky map. For the timing analysis, we extracted a light curve in the same energy range with the maximum available time resolution of 300 s and corrected to the Solar System Barycentre (SSB) by using the task earth2sun and the JPL DE-200 ephemeris (Standish 1982). For the spectral analysis, we produced the background subtracted spectrum in eight energy channels, averaged over the entire exposure, and we used the official BAT spectral redistribution matrix.
XRT observed IGR J18214-1318 four times. The source was always observed in Photon Counting (PC) mode (Hill et al. 2004) for a total exposure of 9.4 ks. The details on the XRT observations are reported in Table 1. We processed the data using standard filtering and screening criteria (0-12 grade selection, xrtpipeline, v.0.12.4). IGR J18214-1318 was detected in 3 observations. The source events were extracted from a circular region (20 pixel radius, with 1 pixel = 2.36 arcsec) centred on the source coordinates (Tomsick et al. 2008). The background for the spectral analysis was extracted from an annular region with inner and outer radii 30 and 70 pixels, respectively. XRT ancillary response file were generated with xrtmkarf; we used the spectral redistribution matrix v014. For the spectral analysis we used only events from Obs.ID 00035354001 because of its much higher signal-to-noise ratio with respect to the other observations. XRT energy channels were binned requiring a minimum of 20 counts per bin in order to use the statistics.
NuSTAR and XMM- observed IGR J18214-1318 simultaneously on 2014 September 18. Details of these two observations are reported in Fornasini et al. 2017 and summarised in Table 1. We re-extracted data for spectral analysis using NuSTARDAS v1.5.1 and the Science Analysis Software (SAS) v15.5.0 for STAR and XMM-, respectively. We applied standard selection criteria and source and background regions. Spectral analysis was performed using xspec v.12.5. and spectral errors are given at 90% confidence level.
| Obs # | Observatory | Instrument | Obs ID | Exposure | Rate | Orb. Phase | |
| MJD | (ks) | (c/s) | |||||
| 1 | Swift | XRT | 00035354001 | 53777.646 | 6.3 | 0.44 | |
| 2 | Swift | XRT | 00035354003 | 56240.844 | 0.7 | 0.52 | |
| 3 | Swift | XRT | 00035354005 | 57702.037 | 0.5 | 0.89 | |
| 4 | Swift | XRT | 00035354006 | 58064.671 | 0.8 | 0.74 | |
| 5 | NuSTAR | FPMA | 3000114002 | 56918.107 | 26.3 | 0.37 | |
| FPMB | 26.3 | ||||||
| 6 | XMM-Newton | EPIC–pn | 0741470201 | 56918.053 | 18.6 | 0.36 | |
| EPIC–MOS1 | 25.9 | ||||||
| EPIC–MOS2 | 25.9 |
3 Timing analysis
We searched for periodicities in the 1–1000 d range
in the BAT survey data using the folding technique
and selecting events in the 20–85 keV energy range for optimal SNR.
The time resolution is given by , where P is the trial
period, is the number of phase bins used to build the trial profile,
and 404.4 Ms is the data time span. The BAT survey data
present a large spread of statistical errors mainly due to the wide range of
off-axis directions in which the source is observed.
To overcome this issue, the rate in the folded profile for each trial period was
weighted by the inverse square of the corresponding statistical error
(Cusumano et al. 2010). The resulting periodogram (top panel in Fig. 1) shows
several features emerging above the noise: the highest peak is
at P d (; the error is the period resolution
at P0). The other peaks are multiples of P0 (2, 3 and 5
times P0). The intensity profile (middle panel in Fig. 1) at P0 with
Tepoch = 55684.71093750 MJD shows a flat intensity level and a deep minimum
with intensity consistent with no emission.
The centroid of the minimum, evaluated by
fitting the data around the dip with a Gaussian model, is at a phase
0.9870.010 corresponding to Tmin = (55684.64 0.05) nP0
MJD.
The time variability of the source causes the average in the
periodogram to significantly deviates from the average value expected for white
noise (N–1). As a consequence the statistics cannot be applied to
evaluate the significance of the detected periodicity.
Therefore, we determined the significance of the feature from the data in the
periodogram adopting the following methodology:
- 1.
We fit the periodogram with a second-order polynomial; a new periodogram was obtained by subtracting the best fit trend from the original distribution. In the new periodogram the P0 ha a value of 102.8.
- 2.
We build the histogram of the distribution (Figure 1 bottom) selecting the values in the period interval between 1 and 10 d, excluding the values within an interval centred on P0 and wide.
- 3.
The tail ( of the histogram is fitted with an exponential function and its integral between 102.8 and infinity, normalised for the total area below the histogram, is evaluated.
The value we obtain (3.3 10-11) represents the probability of random occurrence for and corresponds to a significance of 6.6 standard deviations in Gaussian statistics.


The rate observed in the XRT observations (Table 1 and middle panel in Figure 1) shows a strong variability that cannot be explained with the shape of the BAT folded profile. Observation 3, where the source is not detected, is close to the dip of the pulse profile, while observation 4, that shows a rate 10 times lower than observations 1 and 2, is far from the dip.
4 Spectral analysis
We re-analysed the data from simultaneous NuSTAR and XMM-Newton observations performed in 2014, previously reported in Fornasini et al. 2017. We aim at giving additional information on the the source by using physical models to explain the broadband X-ray emission. As a first check, we re-extracted the data and re-binned each spectrum according to the prescriptions outlined in Kaastra & Bleeker 201622 2 We used the ad-hoc script written by C. Ferrigno at https://gitlab.astro.unige.ch/ferrigno/optimal-binning. We applied the same models used by Fornasini et al. 2017 and obtained, within the statistical uncertainties, consistent parameters values. Fornasini et al. 2017 showed that the spectrum is well fitted by a phenomenological model composed of a power-law with a high-energy cut-off; in addition, in the softer band, the spectrum needs either a soft black-body or a partial covering component, which were found statistically equivalent. It is known that the exponentially high-energy cut-off is an empirical model which suffers of artefacts due to the discontinuity created by the model at the cut-off energy. As discussed in Fornasini et al. 2017, the spectral shape of IGR J18214-1318 is compatible with the emission observed in accreting X-ray pulsars, even though a search for coherent pulsations did not reveal any periodic signal. In this scenario, the high-energy X-ray emission is dominated by the emission from the shock in the accreting column. The free-falling plasma is slowed down within few free path lengths by the presence of Coulomb, or radiative, shock depending on the pulsar being in the critical regime, or not (Becker & Wolff 2007). In both cases, most of the hard X-ray radiation escapes either by bulk-motion or thermal Comptonization processes in the post-shock region. At high accretion rates, thermal Comptonization should be the dominant channel and pulsar spectra clearly show a cut-off at the electron thermal temperature superimposed on the hard power-law emission (<2). At lower accretion rates, spectra appear softer and with higher, or absent, roll-over. We first adopted a model of pure thermal Comptonization and then applied a self-consistent X-ray pulsar model, where all the main physical mechanisms are taken into account (Becker & Wolff 2007; Ferrigno et al. 2009, model bwcycl) and then compared the results.
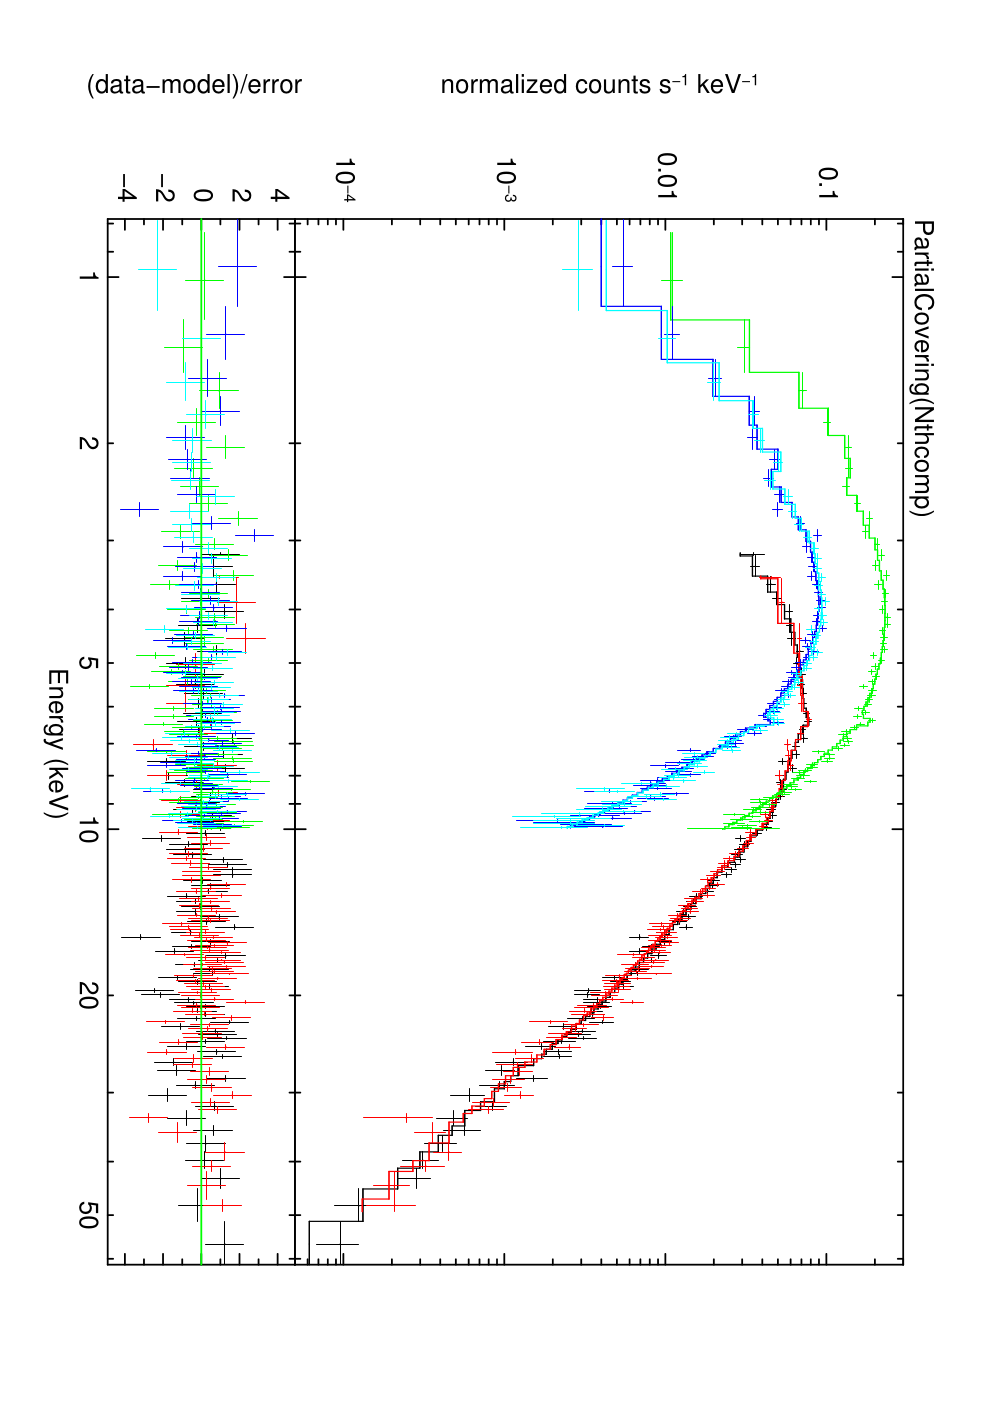
To model the thermal Comptonization we adopted the nthcomp model in xspec (Zdziarski et al. 1996; Życki et al. 1999). The soft seed photons with a black-body spectrum of temperature , produced in the NS polar cap or in the post-shock region, are upscattered by an electron population at temperature which is related to the spectral high energy cut-off. The model includes a fixed zero-width 6.4 keV line to fit the Fe K emission and multiplicative factors for each data-set to account for slight differences in the instrument intercalibration (we fixed to 1 the FPMA constant, and set the EPIC/MOS1 and EPIC/MOS2 to be the same). Line-of-sight interstellar absorption is modelled using the tbabs component, using cross-sections from Verner et al. 1996 and element abundances from Wilms et al. 2000. As in Fornasini et al. 2017, we also found that residuals were present below 2 keV and the final fit result was not satisfactory (/d.o.f. = 465/428). Analogously, we added to this continuum model a black-body component, or, alternatively, a partial covering component. In the first scenario, we found a black-body temperature of 1.5 0.1 keV and a corresponding black-body radius of 0.4 0.1 km; the interstellar absorption column, , was left free to vary and the best-fit value was (3.90 0.15) 1022 cm-2 These values are compatible with the corresponding estimates reported in Fornasini et al. 2017. In the second scenario, we fixed the interstellar absorption to the Galactic expected value33 3 We set this value according to the online estimator at https://heasarc.gsfc.nasa.gov/cgi-bin/Tools/w3nh/w3nh.pl of 1.3 1022 cm-2 (HI4PI Collaboration et al. 2016) and found an excess of local absorption of (4.30.4) 1022 cm-2 and an absorbed fraction of 89 2%. However, unlike in Fornasini et al. 2017, the partial covering model gave us a significantly better value (/d.o.f. = 421/415) than that obtained by adding the black-body component (/d.o.f. = 455/415). This statistical difference is mainly ascribed to the different spectral binning, because we noted a similar statistical difference for these two scenarios also adopting the phenomenological continuum adopted in Fornasini et al. 2017.
It is worth noticing here that the fit sets only a poor constraint to the electron temperature, with a lower limit of 13 keV (95% confidence interval). Thus, we chose to fix it to a reference value of 20 keV, since this is a typical value found in other accreting X-ray pulsars at similar luminosity (Coburn et al. 2002). As a second step, we used the bwcycl model, assuming that the compact object is an accreting neutron star. This model has many parameters, most of which are strongly correlated, and it is important to fix as many of them as possible. In our context, we set to the default values the mass and the radius of the neutron star ( = 10 km, = 1.4), we assumed a distance of 10 kpc, a NS magnetic field of 41012 G. From the nthcomp model, we derived a bolometric luminosity of 1036 erg s-1, so we set for this model a mass accretion rate of 1016 g s-1. We left free to vary the following parameters: , related to the escaping time of photons, , related to the ratio of the bulk versus the thermal contribution of the whole Comptonized component, , the radius of the accretion column and , the temperature of the hot electrons (see Becker & Wolff 2007, for an extended discussion on the physical meaning of these parameters). This model gave a poor statistical fit to the data (/d.o.f. = 659/428), leaving a pattern of residuals reminiscent of the one obtained applying only the thermal Comptonization model. Again, we looked for the best-fit model adding either a black-body or a partial covering model, and, similarly to what obtained with the nthcomp model, we found a better description using the partial covering scenario (the /d.o.f. is 506/415 and 425/415, for the black-body and partial covering scenarios, respectively). Since for both physical models we got better statistical results using a partial covering, and following Fornasini et al. 2017 who discussed the weakness of the black-body interpretation, hereafter we shall focus only on the partial covering scenario. We show in Fig. 2 the data, the best-fit models and residuals for the two models, and report in Table 2 the best-fitting parameter values and errors. For both models, the iron line is well described by the same set of values: the energy is 6.39 0.03 keV, the line width is determined only as an upper limit of 85 eV (at 95% confidence level); after freezing the width to zero, we derived a line normalisation of (1.7 0.4) photons cm-2 s-1 and a corresponding equivalent width of 54 2 eV.
 |
 |
| Parameter | Units | Values | |
|---|---|---|---|
| nthcomp | bwcycl | ||
| 1022 cm-2 | 1.3 | 1.3 | |
| 1022 cm-2 | 4.30.4 | 9.6 | |
| 0.890.02 | 0.76 | ||
| 2.070.03 | |||
| keV | 1.390.04 | ||
| keV | 20 (fixed) | ||
| 2.070.17 | |||
| 6.2 | |||
| keV | 4.8 | ||
| m | 5.50.3 | ||
| Flux | 6.0 | 6.1 | |
| / d.o.f. | 421/418 | 425/418 | |
Finally we also analysed the Swift data, using the XRT data from ObsID 00035354001, for which there is the highest statistics, and the time-averaged BAT spectrum. The 1–10 keV X-ray spectrum is variable because of the changing of the local conditions on the neutral absorption and of the accretion rate while the hard X-ray spectrum, above 15 keV, is generally dominated by the exponential tail of the Comptonized component, and depends only on the electrons temperature and the instantaneous mass accretion rate. Assuming there is no significant change in the electrons temperature, we left a multiplicative constant free to vary to keep into account the intercalibration between the two instruments and the different flux level. We find that an absorbed thermal Comptonization gives a good description of the data (/d.o.f. = 48/60), though spectral parameters are not so well constrained as in the previous case. We fixed the expected interstellar equivalent hydrogen column to 1.3 1022 cm-2. Using a partial covering we noted that the covering fraction parameter leaned to the higher boundary extreme, so that we could only measure a total absorption value of (4 1 ) 1022 cm-2; the electron temperature resulted poorly constrained and fixed, then, to 20 keV; the soft seed-photon temperature, the parameter and the unabsorbed 0.1–10 keV flux are 1.91 0.35 keV, 1.94 0.14 and (5.8 1.7) 10-11 erg cm-2 s-1, respectively. The multiplicative factor of the BAT model is 0.18 0.07, which indicates that the XRT observation caught the source in brighter state with respect to long-term averaged flux. The unabsorbed flux measured during the XRT observation results a factor 2–3 higher than that observed in the simultaneous NuSTAR and XMM-Newton observations. We also found a similar amount of local absorption. In Fig. 3, we show data, best-fitting model and residuals for the combined XRT and BAT broadband spectrum.
Although we also obtained a satisfactorily description of the data
with the bwcycl model, we do not go into detail, as slack
constraints for many parameters prevented us to make
meaningful comparisons or draw solid conclusions.


5 Discussion
We exploited archival data based on , XMM-, and STAR data available on IGR J18214-1318 for an updated study of the spectral and timing properties of this source. The BAT survey monitoring, spanning 13 years, reveals a periodic modulation with P0 = 5.4246 0.0004 d. The folded light curve shows a minimum consistent with none, or negligible, emission, thus suggesting the presence of an eclipse. We use Kepler’s third law to derive the semi-major axis of the binary system assuming that P0 is the system orbital period, the mass of the neutron star, and the companion’s star mass (Martins et al. 2005):
| (1) |
Considering that the radius of the companion star is (Martins et al. 2005), the semi-major axis length corresponds to . Such a tight orbital separation is common among wind-fed neutron stars accreting from an O type companion star. With this geometry, assuming the orbit to be nearly edge-on, we expect the eclipse to last % of the orbit. This is roughly consistent with the width of the eclipse observed in the folded light curve (Fig. 1 middle). The lack of detection in XRT observation 3, whose orbital phase falls marginally outside the dip, could be explained with enhanced absorption of the soft X-ray emission by the stellar wind, which results denser along the line-of-sight for smaller angular separation. However, we have also observed a significant flux variability in the soft X-rays, not related to the orbital phase, so we cannot exclude that this non-detection is due to a flux fluctuation because of a decrease of the accretion rate from the companion star. Knowing the radius of the supergiant companion, we can estimate the upper limit on the orbital eccentricity for a wind-fed accreting system. Fig. 4 shows how the Lagrangian point L1 varies with the orbital phase, for different eccentricities (Paczyński 1971). If the eccentricity were higher than , L1 would be within the companion star radius, and the accretion would be from Roche lobe overflow.
We have re-analyzed the broadband spectrum of IGR J18214-1318 extending the spectral analysis reported by Fornasini et al. 2017 by using physical models to fit the data. A physical description is obtained either by a pure thermal Comptonization model or by a more complex model which takes into account also the bulk-motion Comptonized component. In both cases, an excess below 2 keV in the residuals is indicative of an additional component. Fornasini et al. 2017 explained this excess either with a partial covering or with the addition of a hot thermal black-body component, on the basis of an equivalent statistical result. Our fits are instead significantly better when using the partial covering rather than the black-body. We found that the amount of local absorption can be uncertain by a factor of two depending on the choice of the continuum: the bwcycl model requires higher absorption values, similar to the results obtained by Fornasini et al. 2017, the nthcomp model requires half of this value and a higher covering fraction, close to 90%, which suggests that local absorber embeds totally the compact object and reprocesses and re-emits the hard X-ray illuminating primary flux. The bwcycl model has been used under certain assumptions: that the compact object is a magnetized NS with a bipolar field of 4 1012 G, and the accretion rate is close to the critical luminosity (Becker & Wolff 2007). These assumptions should be proved with future observations. The luminosity depends quadratically on the distance and on the estimate for the local absorption, and our best guesses at the moment favour a luminosity of 1036 erg s-1, which is expected below the critical luminosity. By adopting the appropriate transformations from our assumptions and from the best-fitting parameters, we derive the following physical quantities: the local mass accretion rate on the polar cap of the NS is of the order of 1010 g cm-2 s-1, this builds a mound of material that has an altitude of 1 meter, a density of 13.5 g cm-2 and a thermal temperature of 8.2 K (Becker & Wolff 2007, Sect. 6.3 in). The very low inferred radius of the accretion column leads to a lower critical luminosity compared to the standard bright X-ray pulsars of the order of a few 1036 erg s-1, which makes the adoption of this model reasonable (D’Aì et al. 2017, see a similar discussion for the applicability of this model in the case of another accreting X-ray pulsar in). Another important difference with other sources examined using this model is the derived value that sets the relative importance of the bulk vs. thermal Comptonization (Becker & Wolff 2007, = 4 ybulk/ytherm, where the y-parameter describes the fractional energy increase in each of these processes, see) . For this source = 6, which indicates that photons are mostly up-scattered by the free-fall electrons above the sonic point. Finally, we found that these models do also provide an adequate modelling to a Swift observation combined with an averaged long-term BAT spectrum, though the lower statistics did not allow a tight comparison of these different observations.
Acknowledgments
This work was supported by contract ASI I/004/11/0. This work made use of data supplied by the UK Swift Science Data Centre at the University of Leicester. The authors acknowledge financial contribution from the agreement ASI-INAF n.2017-14-H.0 and from the INAF mainstream grant (PI: T. Belloni).
Data availability
The data underlying this article are available in the HEASARC archive at https://heasarc.gsfc.nasa.gov/docs/archive.html and, can be accessed with the following Dataset ID numbers: 30001140002 for NuSTAR, 0741470201 for XMM-Newton, 00035354001, 00035354003, 00035354005 and 00035354006 for Swift/XRT.
References
- Barthelmy et al. (2005) Barthelmy S. D., Barbier L. M., Cummings J. R. e. a., 2005, Space Sci. Rev., 120, 143
- Becker & Wolff (2007) Becker P. A., Wolff M. T., 2007, ApJ, 654, 435
- Bird et al. (2006) Bird A. J., et al., 2006, ApJ, 636, 765
- Bird et al. (2016) Bird A. J., et al., 2016, ApJS, 223, 15
- Bozzo et al. (2017) Bozzo E., Bernardini F., Ferrigno C., Falanga M., Romano P., Oskinova L., 2017, A&A, 608, A128
- Burrows et al. (2004) Burrows D. N., et al., 2004, in Flanagan K. A., Siegmund O. H. W., eds, Society of Photo-Optical Instrumentation Engineers (SPIE) Conference Series Vol. 5165, X-Ray and Gamma-Ray Instrumentation for Astronomy XIII. pp 201–216, doi:10.1117/12.504868
- Butler et al. (2009) Butler S. C., et al., 2009, ApJ, 698, 502
- Chaty (2004) Chaty S., 2004, in 35th COSPAR Scientific Assembly. p. 2239
- Coburn et al. (2002) Coburn W., Heindl W. A., Rothschild R. E., Gruber D. E., Kreykenbohm I., Wilms J., Kretschmar P., Staubert R., 2002, ApJ, 580, 394
- Corbet & Krimm (2009) Corbet R. H. D., Krimm H. A., 2009, The Astronomer’s Telegram, 2008, 1
- Corbet & Krimm (2010) Corbet R. H. D., Krimm H. A., 2010, The Astronomer’s Telegram, 3079, 1
- Corbet et al. (2010a) Corbet R. H. D., Krimm H. A., Skinner G. K., 2010a, The Astronomer’s Telegram, 2559, 1
- Corbet et al. (2010b) Corbet R. H. D., Barthelmy S. D., Baumgartner W. H., Krimm H. A., Markwardt C. B., Skinner G. K., Tueller J., 2010b, The Astronomer’s Telegram, 2588, 1
- Corbet et al. (2010c) Corbet R. H. D., Barthelmy S. D., Baumgartner W. H., Krimm H. A., Markwardt C. B., Skinner G. K., Tueller J., 2010c, The Astronomer’s Telegram, 2598, 1
- Corbet et al. (2010d) Corbet R. H. D., Barthelmy S. D., Baumgartner W. H., Krimm H. A., Markwardt C. B., Skinner G. K., Tueller J., 2010d, The Astronomer’s Telegram, 2599, 1
- Cusumano et al. (2010) Cusumano G., La Parola V., Romano P., Segreto A., Vercellone S., Chincarini G., 2010, MNRAS, 406, L16
- Cusumano et al. (2013a) Cusumano G., Segreto A., La Parola V., Masetti N., D’Ai A., Tagliaferri G., 2013a, MNRAS, 436, L74
- Cusumano et al. (2013b) Cusumano G., Segreto A., La Parola V., D’Aì A., Masetti N., Tagliaferri G., 2013b, ApJL, 775, L25
- Cusumano et al. (2015) Cusumano G., Segreto A., La Parola V., Masetti N., D’Aì A., Tagliaferri G., 2015, MNRAS, 446, 1041
- Cusumano et al. (2016) Cusumano G., La Parola V., Segreto A., D’Aì A., 2016, MNRAS, 456, 2717
- D’Aì et al. (2011a) D’Aì A., La Parola V., Cusumano G., Segreto A., Romano P., Vercellone S., Robba N. R., 2011a, A&A, 529, A30
- D’Aì et al. (2011b) D’Aì A., Cusumano G., La Parola V., Segreto A., di Salvo T., Iaria R., Robba N. R., 2011b, A&A, 532, A73
- D’Aì et al. (2015) D’Aì A., et al., 2015, MNRAS, 449, 4288
- D’Aì et al. (2017) D’Aì A., Cusumano G., Del Santo M., La Parola V., Segreto A., 2017, MNRAS, 470, 2457
- Ferrigno et al. (2009) Ferrigno C., Becker P. A., Segreto A., Mineo T., Santangelo A., 2009, A&A, 498, 825
- Filliatre & Chaty (2004) Filliatre P., Chaty S., 2004, ApJ, 616, 469
- Fornasini et al. (2017) Fornasini F. M., Tomsick J. A., Bachetti M., Krivonos R. A., Fürst F., Natalucci L., Pottschmidt K., Wilms J., 2017, ApJ, 841, 35
- Gehrels et al. (2004) Gehrels N., Chincarini G., Giommi P., Mason K. O., Nousek J. A., Wells A. A., White N. E., 2004, ApJ, 611, 1005
- HI4PI Collaboration et al. (2016) HI4PI Collaboration et al., 2016, A&A, 594, A116
- Harrison et al. (2013) Harrison F. A., et al., 2013, ApJ, 770, 103
- Hill et al. (2004) Hill J. E., et al., 2004, in Flanagan K. A., Siegmund O. H. W., eds, Society of Photo-Optical Instrumentation Engineers (SPIE) Conference Series Vol. 5165, X-Ray and Gamma-Ray Instrumentation for Astronomy XIII. pp 217–231, doi:10.1117/12.505728
- Jansen et al. (2001) Jansen F., et al., 2001, A&A, 365, L1
- Kaastra & Bleeker (2016) Kaastra J. S., Bleeker J. A. M., 2016, A&A, 587, A151
- Krimm et al. (2013) Krimm H. A., et al., 2013, ApJS, 209, 14
- Krivonos et al. (2012) Krivonos R., Tsygankov S., Revnivtsev M., Sazonov S., Churazov E., Sunyaev R., 2012, A&A, 537, A92
- La Parola et al. (2010) La Parola V., Cusumano G., Romano P., Segreto A., Vercellone S., Chincarini G., 2010, MNRAS, 405, L66
- La Parola et al. (2013) La Parola V., Cusumano G., Segreto A., D’Aì A., Masetti N., D’Elia V., 2013, ApJL, 775, L24
- La Parola et al. (2014) La Parola V., Segreto A., Cusumano G., Masetti N., D’Ai A., Melandri A., 2014, MNRAS, 445, L119
- Lebrun et al. (2003) Lebrun F., et al., 2003, A&A, 411, L141
- Martínez-Núñez et al. (2017) Martínez-Núñez S., et al., 2017, Space Sci. Rev., 212, 59
- Martins et al. (2005) Martins F., Schaerer D., Hillier D. J., 2005, A&A, 436, 1049
- Masetti et al. (2006) Masetti N., et al., 2006, A&A, 459, 21
- Negueruela et al. (2006a) Negueruela I., Smith D. M., Reig P., Chaty S., Torrejón J. M., 2006a, in Wilson A., ed., ESA Special Publication Vol. 604, The X-ray Universe 2005. p. 165 (arXiv:astro-ph/0511088)
- Negueruela et al. (2006b) Negueruela I., Smith D. M., Harrison T. E., Torrejón J. M., 2006b, ApJ, 638, 982
- Paczyński (1971) Paczyński B., 1971, ARA&A, 9, 183
- Reig et al. (2005) Reig P., Negueruela I., Papamastorakis G., Manousakis A., Kougentakis T., 2005, A&A, 440, 637
- Rodriguez et al. (2009) Rodriguez J., Tomsick J. A., Chaty S., 2009, A&A, 494, 417
- Segreto et al. (2010) Segreto A., Cusumano G., Ferrigno C., La Parola V., Mangano V., Mineo T., Romano P., 2010, A&A, 510, A47
- Segreto et al. (2013a) Segreto A., Cusumano G., La Parola V., D’Aì A., Masetti N., D’Avanzo P., 2013a, A&A, 557, A113
- Segreto et al. (2013b) Segreto A., La Parola V., Cusumano G., D’Aì A., Masetti N., Campana S., 2013b, A&A, 558, A99
- Sguera et al. (2005) Sguera V., et al., 2005, A&A, 444, 221
- Standish (1982) Standish E. M. J., 1982, A&A, 114, 297
- Tomsick et al. (2008) Tomsick J. A., Chaty S., Rodriguez J., Walter R., Kaaret P., 2008, ApJ, 685, 1143
- Ubertini et al. (2003) Ubertini P., et al., 2003, A&A, 411, L131
- Verner et al. (1996) Verner D. A., Ferland G. J., Korista K. T., Yakovlev D. G., 1996, ApJ, 465, 487
- Wilms et al. (2000) Wilms J., Allen A., McCray R., 2000, ApJ, 542, 914
- Winkler et al. (2003) Winkler C., et al., 2003, A&A, 411, L1
- Zdziarski et al. (1996) Zdziarski A. A., Johnson W. N., Magdziarz P., 1996, MNRAS, 283, 193
- Zurita Heras & Chaty (2008) Zurita Heras J. A., Chaty S., 2008, A&A, 489, 657
- Życki et al. (1999) Życki P. T., Done C., Smith D. A., 1999, MNRAS, 309, 561
- in’t Zand (2005) in’t Zand J. J. M., 2005, A&A, 441, L1