Proximity Sensing: Modeling and Understanding Noisy RSSI-BLE Signals and Other Mobile Sensor Data for Digital Contact Tracing
Abstract
As we await a vaccine, social-distancing via efficient contact tracing has emerged as the primary health strategy to dampen the spread of COVID-19. To enable efficient digital contact tracing, we present a novel system to estimate pair-wise individual proximity, via a joint model of Bluetooth Low Energy (BLE) signals with other on-device sensors (accelerometer, magnetometer, gyroscope). We explore multiple ways of interpreting the sensor data stream (time-series, histogram, etc) and use several statistical and deep learning methods to learn representations for sensing proximity. We report the normalized Decision Cost Function (nDCF) metric and analyze the differential impact of the various input signals, as well as discuss various challenges associated with this task.
1 Introduction
As economies open up, digital contact tracing is emerging as an important tool to help contain the spread of COVID-19 by providing exposure notification to individuals who come in close proximity to infected individuals Cheng et al. 2020; Ferretti et al. 2020; MacIntyre 2020; Zhang et al. 2020. There have been several proposals for proximity sensing varying across different modalities, including WiFi signals Dmitrienko et al. 2020; Sapiezynski et al. 2017; Trivedi et al. 2020, GPS Raskar et al. 2020, Ultrasound Loh 2020, and QR codes Nakamoto et al. 2020. However, Bluetooth is the most widely accepted technology for digital contact tracing, as it is the most feasible across the available options. Moreover, it is supported by the Google Apple Exposure Notification (GAEN) API Google and Apple 2020. Current approaches for automated exposure notification use BLE signals emanating from smartphones (chirps) to detect if a person has been in close proximity to an infected individual. However, there are certain limitations with the accuracy of Bluetooth, as described in Leith and Farrell 2020a; Leith and Farrell 2020b; Soltani, Calo, and Bergstrom 2020. Researchers have tried augmenting Bluetooth-based protocols with other modalities (such as Ultrasound Loh 2020 and GPS Raskar et al. 2020), however, that does not circumvent the signal processing limitation present in Bluetooth based systems. Existing attempts at calibrating Bluetooth data only use device level information Google 2020 to partially account for hardware level differences among the devices. In addition, the received signal strength indicator (RSSI) value of Bluetooth chirps sent between phones is a noisy estimator of the actual distance between the phones as they can be dramatically affected by real-world conditions Hatke et al. 2020.
In this paper, we predict the distance between two phones using the RSSI values from BLE signal logs, along with data from other mobile sensors (as described in Table 4). The additional sensors help account for the real-world complexities that affect the variations in BLE signals, such as the position of the phone, movement, etc. Using datasets collected by NIST and MITRE, we experiment with various machine learning models to learn the representations of the data, achieving the most favorable results by using a temporal Conv1D. Additionally, to understand the contribution of various sensors on the overall task as well as the extent of noise present in this data distribution, we perform ablation studies and discuss various challenges associated with the data distribution.
2 Preliminaries
In our experiments, we use the NIST dataset (collected in coordination with the MIT PACT project) and the MITRE Range Angle Structured (further referred to as MITRE) dataset. Both the datasets are collected using the Structured Contact Tracing Protocol V 2.0 Laboratory 2020 and provide a stream of Bluetooth RSSI data between two phones at the following distances, 1.2, 1.8, 3.0, and 4.5 meters. We use these distances as classes. In addition, the dataset collects other phone sensor data (listed in Table 4), as well as experiment level metadata (such as device models, power, carriage states, etc).
The dataset is formatted as multiple-segmented intervals of continuous sensor readings (between transmitter and receiver) at the same distance. This is done for multiple 4-second device interactions per experiment. We primarily use the MITRE and a set-aside subset of the NIST datasets for training and evaluation respectively. However, results of models trained on a separate subset of the NIST dataset are also discussed.
3 Methodology
As can be seen in Figure 2, the raw Bluetooth RSSI and other sensor data is extremely noisy. Hence, we exploit the temporal characteristics of the dataset by modeling each experiment as a time series, breaking each 4-second interval into multiple time-steps. To minimize noise and the need for over-sampling and under-sampling readings, we choose the mean number of samples per each 4-second interval (150) as the fixed length of each time series. Every time-step is represented as a normalized fixed-length feature vector representing the most recent values obtained from each sensor. In addition, the metadata is one-hot encoded and concatenated to each timestep’s vector. Figure 1 shows the data processing pipeline for the non-temporal models that do not make use of a time-series input.
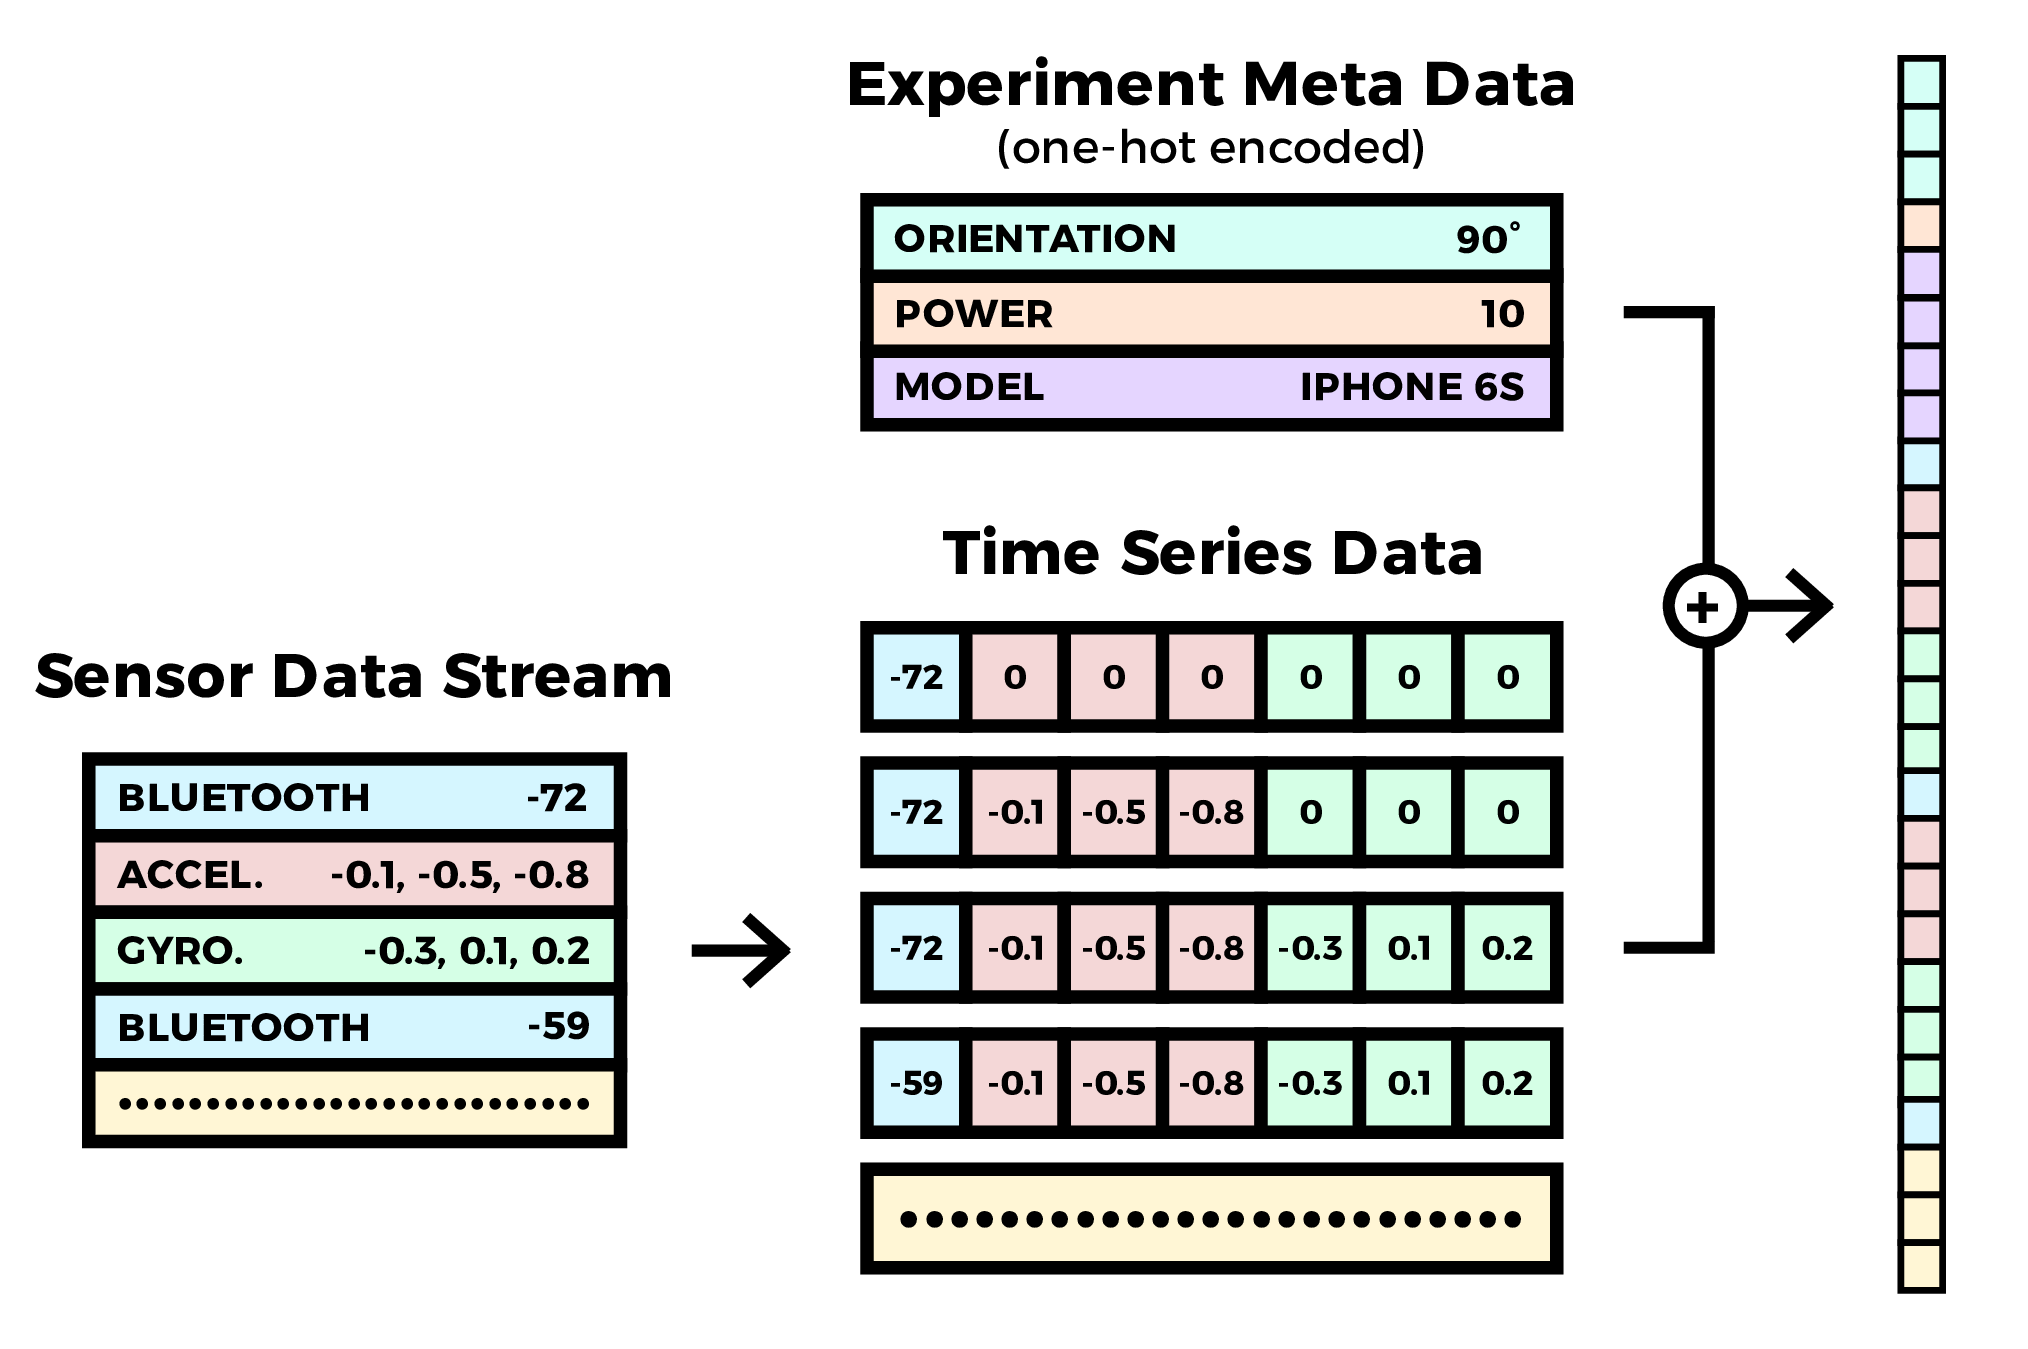
Inspired by HE and PRINTZ 2020, we also experiment with a histogram representation of the BLE signals. Here, we use the frequencies of RSSI values in various buckets instead of using the actual RSSI values. We also try using mix-up data augmentation Zhang et al. 2017, to reduce overfitting by increasing the variations present in the MITRE dataset. However, it did not provide a significant performance increase.
To model this complex data, we use classifiers derived from various DL models (feed-forward, LSTM, GRU, temporal one-dimensional convolutional network, and a convolutional GRU Siam et al. 2017), Decision Tree-based models (XGBoost Chen and Guestrin 2016, Random Forests Breiman 2001), as well as with support vector machines (SVM) Cortes and Vapnik 1995 and a Naive Bayes Classifier. The majority of the models are trained on the entire MITRE dataset, however, the SVM and tree-based models are only trained on a smaller subset of the dataset. This is because training on the full dataset for these model architectures do not complete in a reasonable amount of time. To understand the variations caused by minor changes in the input, we also model the task as a regression problem, where we round the outputs to the nearest class.
We evaluate results on a test set from MITRE and NIST datasets with the normalized Decision Cost Function (nDCF) metric TC4TL 2020 that effectively combines the probability of a false negative and false positive into a single value using weights reflecting the relative cost of each type of error.
All experiments were run on a Intel(R) Xeon(R) CPU E5-2650 v4 @ 2.20GHz server with 528 GB RAM, 48 cores, and on a single Nvidia 1080 Ti GPU. The temporal networks are built using PyTorch Paszke et al. 2019, whereas the Support Vector Machine and the Decision Tree based models are implemented using scikit-learn Pedregosa et al. 2011. All the deep learning experiments use the Adam optimizer Kingma and Ba 2014 and optimize Categorical Crossentropy loss. We plan to open source the code.
4 Results and Analysis
After rigorous parameter tuning, we present the best results on various model architectures evaluated on a subset of the NIST dataset and trained on either the MITRE dataset or a separate subset of the NIST dataset. As highlighted in Table 4, the temporal one-dimensional convolutional network shows the best performance. Surprisingly, the Nu-Support Vector Classifier is able to perform relatively well even with a substantially smaller training subset of the MITRE dataset (as described in the 3 Methodology section). This suggests that there could be less variation in the MITRE dataset, contributing to lower levels of generalization. Additionally, for the random forest model architecture, using a regressor instead of a classifier decreases the nDCF by 0.19, possibly indicating that minor variations in the input could be relevant. The Convolutional GRU architecture performs extremely well when trained on the training subset of the NIST dataset, but significantly loses performance when trained on the MITRE dataset. Due to the complexity of the Convolutional GRU, we hypothesize that this model is overfitting to the conditions of the location that the NIST data was collected in.
Name Description Bluetooth BLE strength Accelerometer linear acceleration Gyroscope angular velocity Magnetometer magnetic aberration changes Attitude roll, pitch, yaw Gravity Gravity along X, Y, Z axes Altitude atmospheric pressure changes Compass orientation & direction Table 3: Descriptions of mobile sensors present in both datasets. Network Train Set nDCF ConvGRU MITRE 1.02 RNN (GRU) MITRE 0.97 Feed Forward MITRE 0.77 Conv1D MITRE 0.58 Conv1D (MaxPool) MITRE 0.81 Conv1D (Dilation) MITRE 0.70 C-SVC MITRE 0.99 Nu-SVC MITRE 0.77 XGBoost MITRE 1.02 RF Classifier MITRE 1.04 RF Regressor MITRE 0.85 RF Histogram (Regressor) MITRE 0.90 Naive Bayes MITRE 0.92 GRU NIST 0.28 ConvGRU NIST 0.16 Table 6: Results for various model representations, evaluated on a subset of the MITRE and NIST dataset.
4.1 Ablation studies
We perform preliminary ablation studies by excluding data from input data streams to estimate the role of different sensors in proximity sensing. Due to the extensive number of potential subsets, we limit our experiments to only subsets based on a physics intuition. For example, we find using only the RSSI-BLE readings increases the divergence in the final training and testing accuracy, indicating higher susceptibility to overfitting. After training with multiple other combinations of sensors, we achieve the best performance using the gyroscope, accelerometer, magnetometer, and the RSSI-BLE readings. When excluding experiment-level metadata, we do not observe any significant performance change. We find that training is actually susceptible to overfitting on two classes when we include the experiment-level metadata.
5 Discussion
In this section, we discuss the feasibility of proximity sensing with respect to the distribution of data. We perform low dimensional projections of the dataset to identify underlying target class clusters in the feature space. Figure 2 shows the Principal Component Analysis (PCA) plots for both datasets. In both plots, clusters are heavily overlapping, without a clear decision boundary for any two labels. This could be caused by external factors such as, physical barriers present between phones, the number and time spread of observed chirps, and multi-path signals reflected from surfaces (e.g. indoor vs outdoor). However, higher dimensional hyper-planes dividing the classes may exist.
A major challenge we encounter across experiments is the lack of generalization of the models trained on MITRE dataset to the NIST dataset. To assess the generalizability of the NIST dataset, we train on NIST dataset and evaluation on the MITRE dataset, but it does not yield any notable improvement in generalization. Informed by these results, we try to estimate the gap between the MITRE and NIST distributions. The inconsistencies between the two distributions can be observed by the high values of between the pair-wise distances of any two feature vectors. Looking at the cross-dataset nearest neighbour pairs, we find that a significant number of the pairs had different classes. Further proving this data discrepancy, we receive similar results when training on an optimal training subset that includes only the nearest points in the MITRE dataset for each point in the NIST dataset is included. We also find that the average distance between a nearest-neighbor pair have an distance of ; however, if we isolate nearest-neighbor pairs with different classes, the average distance is around . This supports the argument that the training and evaluation data distributions are not similar enough to capture any generalizable information. However, a thorough statistical analysis is needed to confirm this argument, as highly non-linear manifolds that can fit both distributions may exist.


6 Conclusion and Future Work
In this paper, we present our approach for detecting proximity between phones for digital contact tracing. Compared to current systems that only rely on RSSI values, our approach attempts to fuse knowledge from additional sensors available on smartphones to mitigate the noise present in the Bluetooth signal. Out of all the models we try, Conv1D performs the best. We report our findings and analysis over different data streams and methods. Effectively sensing proximity was marked by several challenges due to the noise in the data distribution and hence the lack of generalization.
In the future, we plan to work on more interpretable modeling and extensive breakdown of different sensor contribution to the prediction. A combination of physics based forward model and data driven predictor will also be a good step towards robustly detect proximity. We plan to incorporate other co-location technologies (such as WiFi, GPS, Ultrasound, and QR) with our current approach to provide more accurate results.
References
- Breiman (2001) Breiman, L. 2001. Random forests. Machine learning 45(1): 5–32.
- Chen and Guestrin (2016) Chen, T.; and Guestrin, C. 2016. Xgboost: A scalable tree boosting system. In Proceedings of the 22nd acm sigkdd international conference on knowledge discovery and data mining, 785–794.
- Cheng et al. (2020) Cheng, H.-Y.; Jian, S.-W.; Liu, D.-P.; Ng, T.-C.; Huang, W.-T.; and Lin, H.-H. 2020. Contact tracing assessment of COVID-19 transmission dynamics in Taiwan and risk at different exposure periods before and after symptom onset. JAMA internal medicine .
- Cortes and Vapnik (1995) Cortes, C.; and Vapnik, V. 1995. Support-vector networks. Machine learning 20(3): 273–297.
- Dmitrienko et al. (2020) Dmitrienko, M.; Singh, A.; Erichsen, P.; and Raskar, R. 2020. Proximity Inference with Wifi-Colocation during the COVID-19 Pandemic.
- Ferretti et al. (2020) Ferretti, L.; Wymant, C.; Kendall, M.; Zhao, L.; Nurtay, A.; Abeler-Dörner, L.; Parker, M.; Bonsall, D.; and Fraser, C. 2020. Quantifying SARS-CoV-2 transmission suggests epidemic control with digital contact tracing. Science 368(6491).
- Google (2020) Google. 2020. Exposure Notifications BLE RSSI calibration procedure. https://developers.google.com/android/exposure-notifications/ble-attenuation-procedure.
- Google and Apple (2020) Google; and Apple. 2020. Exposure notification: Bluetooth specification. https://blog.google/documents/70/Exposure_Notification_-_Bluetooth_Specification_v1.2.2.pdf.
- Hatke et al. (2020) Hatke, G. F.; Montanari, M.; Appadwedula, S.; Wentz, M.; Meklenburg, J.; Ivers, L.; Watson, J.; and Fiore, P. 2020. Using Bluetooth Low Energy (BLE) signal strength estimation to facilitate contact tracing for COVID-19. arXiv preprint arXiv:2006.15711 .
- HE and PRINTZ (2020) HE, T.; and PRINTZ, M. 2020. A 2-stage Classifier for Contact Detection with BluetoothLE And INS Signals. NIST TC4TL Challenge .
- Kingma and Ba (2014) Kingma, D. P.; and Ba, J. 2014. Adam: A method for stochastic optimization. arXiv preprint arXiv:1412.6980 .
- Laboratory (2020) Laboratory, M. L. 2020. Structured Contact Tracing Protocol, V. 2.0 (1.5). https://mitll.github.io/PACT/files/Structured%20Contact%20Tracing%20Protocol,%20V.%202.0%20(1.5).pdf.
- Leith and Farrell (2020a) Leith, D. J.; and Farrell, S. 2020a. Coronavirus Contact Tracing: Evaluating The Potential Of Using Bluetooth Received Signal Strength For Proximity Detection.
- Leith and Farrell (2020b) Leith, D. J.; and Farrell, S. 2020b. Measurement-based evaluation of google/apple exposure notification api for proximity detection in a commuter bus. arXiv preprint arXiv:2006.08543 .
- Loh (2020) Loh, P.-S. 2020. Flipping the Perspective in Contact Tracing. arXiv preprint arXiv:2010.03806 .
- MacIntyre (2020) MacIntyre, C. R. 2020. Case isolation, contact tracing, and physical distancing are pillars of COVID-19 pandemic control, not optional choices. The Lancet Infectious Diseases 20(10): 1105–1106.
- Nakamoto et al. (2020) Nakamoto, I.; Wang, S.; Guo, Y.; and Zhuang, W. 2020. A QR Code–Based Contact Tracing Framework for Sustainable Containment of COVID-19: Evaluation of an Approach to Assist the Return to Normal Activity. JMIR Mhealth Uhealth 8(9): e22321. ISSN 2291-5222. doi:10.2196/22321.
- Paszke et al. (2019) Paszke, A.; Gross, S.; Massa, F.; Lerer, A.; Bradbury, J.; Chanan, G.; Killeen, T.; Lin, Z.; Gimelshein, N.; Antiga, L.; Desmaison, A.; Kopf, A.; Yang, E.; DeVito, Z.; Raison, M.; Tejani, A.; Chilamkurthy, S.; Steiner, B.; Fang, L.; Bai, J.; and Chintala, S. 2019. PyTorch: An Imperative Style, High-Performance Deep Learning Library. In Wallach, H.; Larochelle, H.; Beygelzimer, A.; d'Alché-Buc, F.; Fox, E.; and Garnett, R., eds., Advances in Neural Information Processing Systems 32, 8024–8035. Curran Associates, Inc. URL http://papers.neurips.cc/paper/9015-pytorch-an-imperative-style-high-performance-deep-learning-library.pdf.
- Pedregosa et al. (2011) Pedregosa, F.; Varoquaux, G.; Gramfort, A.; Michel, V.; Thirion, B.; Grisel, O.; Blondel, M.; Prettenhofer, P.; Weiss, R.; Dubourg, V.; et al. 2011. Scikit-learn: Machine learning in Python. the Journal of machine Learning research 12: 2825–2830.
- Raskar et al. (2020) Raskar, R.; Singh, A.; Zimmerman, S.; and Kanaparti, S. 2020. Adding Location and Global Context to the Google/Apple Exposure Notification Bluetooth API. arXiv e-prints arXiv–2007.
- Sapiezynski et al. (2017) Sapiezynski, P.; Stopczynski, A.; Wind, D. K.; Leskovec, J.; and Lehmann, S. 2017. Inferring person-to-person proximity using wifi signals. Proceedings of the ACM on Interactive, Mobile, Wearable and Ubiquitous Technologies 1(2): 1–20.
- Siam et al. (2017) Siam, M.; Valipour, S.; Jagersand, M.; and Ray, N. 2017. Convolutional gated recurrent networks for video segmentation. In 2017 IEEE International Conference on Image Processing (ICIP), 3090–3094. IEEE.
- Soltani, Calo, and Bergstrom (2020) Soltani, A.; Calo, R.; and Bergstrom, C. 2020. Contacttracing apps are not a solution to the COVID-19 crisis. The Brookings Institution, April 27.
- TC4TL (2020) TC4TL, N. 2020. NIST Pilot Too Close for Too Long (TC4TL) Challenge Evaluation Plan. https://www.nist.gov/system/files/documents/2020/07/01/2020_NIST_Pilot_TC4TL_Challenge_Evaluation_Plan_v1p3.pdf.
- Trivedi et al. (2020) Trivedi, A.; Zakaria, C.; Balan, R.; and Shenoy, P. 2020. WiFiTrace: Network-based Contact Tracing for Infectious DiseasesUsing Passive WiFi Sensing. arXiv preprint arXiv:2005.12045 .
- Zhang et al. (2017) Zhang, H.; Cisse, M.; Dauphin, Y. N.; and Lopez-Paz, D. 2017. mixup: Beyond empirical risk minimization. arXiv preprint arXiv:1710.09412 .
- Zhang et al. (2020) Zhang, J.; Litvinova, M.; Liang, Y.; Wang, Y.; Wang, W.; Zhao, S.; Wu, Q.; Merler, S.; Viboud, C.; Vespignani, A.; et al. 2020. Changes in contact patterns shape the dynamics of the COVID-19 outbreak in China. Science .