A Planck-selected dusty proto-cluster at 2.16 associated with a strong over-density of massive H emitting galaxies2020A Planck-selected dusty proto-cluster at 2.16 associated with a strong over-density of massive H emitting galaxies–References
Abstract
We discovered an over-density of H-emitting galaxies associated with a Planck compact source in the COSMOS field (PHz G237.0+42.5) through narrow-band imaging observations with Subaru/MOIRCS. This Planck-selected dusty proto-cluster at has 38 H emitters including six spectroscopically confirmed galaxies in the observed MOIRCS 4′7′ field (corresponding to 2.03.5 Mpc2 in physical scale). We find that massive H emitters with 10.5 are strongly clustered in the core of the proto-cluster (within 300-kpc from the density peak of the H emitters). Most of the H emitters in this proto-cluster lie along the star-forming main sequence using H-based SFR estimates, whilst the cluster total SFR derived by integrating the H-based SFRs is an order of magnitude smaller than those estimated from Planck/Herschel FIR photometry. Our results suggest that H is a good observable for detecting moderately star-forming galaxies and tracing the large-scale environment in and around high- dusty proto-clusters, but there is a possibility that a large fraction of star formation could be obscured by dust and undetected in H observations.
Keywords:
galaxies: clusters: general — galaxies: evolution — galaxies: star formation.1 Introduction
Within the framework of hierarchical growth of large-scale structures of the Universe, galaxy clusters evolve at intersections of the cosmic web across cosmic time (e.g. Overzier 2016). Galaxy clusters in the local Universe are dominated by red (quiescent) galaxies with old stellar population, and they are believed to be formed in the early universe at accompanying intense starbursts (e.g. Bower, Lucey & Ellis 1992). Young forming clusters are predicted to be observed as strong overdensities of dusty starbursts (Casey 2016; Chiang et al. 2017), and therefore it is vital to find such star-bursting proto-clusters at high- to investigate how the properties of galaxies in today’s clusters were put in place.
A growing number of studies have identified such star-forming (or potentially starbursting) proto-cluster candidates in the early universe with various techniques (e.g. Hayashi et al. 2012; Dannerbauer, et al. 2014; Wang et al. 2016; Oteo et al. 2018; Strazzullo et al. 2018; Lacaille et al. 2019). One approach to detect such short-lived (hence rare) dusty objects at high- is to use FIR–(sub-)millimeter surveys covering a wide area of the sky. A good example of such dust-selected, highly star-forming systems is the proto-cluster identified around SPT2349–56, the brightest unlensed source from the 2,500-deg2 South Pole Telescope (SPT) survey (Miller et al. 2018; Hill et al. 2020), where a large number of sub-millimeter galaxies (SMGs) at are clustered within a compact region and its total cluster star formation rate (SFR) is estimated to be 104 M⊙/yr.
Planck11 1 Planck is a project of the European Space Agency (ESA) with instruments provided by two scientific consortia funded by ESA member states (in particular the lead countries France and Italy), with contributions from NASA (USA), and telescope reflectors provided by a collaboration between ESA and a scientific consortium led and funded by Denmark. is a very powerful facility for selecting high- proto-clusters of dusty sources, taking advantage of its all-sky coverage in sub-millimeter (Planck Collaboration 2015; Clements et al. 2014; Flores-Cacho et al. 2016; Greenslade et al. 2018; Cheng et al. 2019; Kubo et al. 2019). Using the Planck high- source candidates (PHz) catalogue (Planck Collaboration 2016), in combination with Herschel photometry (HerMES; Oliver et al. 2012), we investigate the region around a Planck source (PHz G237.0+42.5) lying in the COSMOS field. Within the 4.5-arcmin Planck beam (in diameter), there are several Herschel FIR sources and X-ray sources. Medium-resolution spectroscopy from follow-up NIR LUCI/LBT observations (covering the Planck beam area with its 4′4′ FoV) and optical VIMOS/VLT spectra from the zCOSMOS survey (Lilly et al. 2007) reveal 8 sources at 2.16 within the Planck beam area (Polletta et al. in prep.).
In this Letter, we present H imaging observations of the PHz G237 field with Subaru/MOIRCS using a narrow-band (NB) filter (NB2071), which is perfectly matched to the H lines from the redshift of this structure (). Narrow-band H imaging observations are shown to be successful in detecting high- star-forming galaxies within a narrow redshift slice in various environments (e.g. Geach et al. 2008; Sobral et al. 2013; Tadaki et al. 2013; Hayashi et al. 2016; Darvish et al. 2020). This study presents the first attempt to perform H imaging observations towards a Planck-selected proto-cluster—with the aim to reveal the structures traced by typical SF galaxies, and to study the nature of member galaxies residing in the dust-selected proto-cluster at the peak epoch of galaxy formation. Throughout this Letter, we adopt the standard cosmology with , , and km s-1 Mpc-1. All magnitudes are given in the AB system, and we assume the Chabrier 2003 initial mass function (IMF) throughout this work.
2 Observations and H emitter selection
We carried out MOIRCS/Subaru observations of the PHz G237 field using NB2071 filter (2.068 m, 0.027m; corresponding to the H line at 2.13–2.17) on December 21, 2018. The observations were executed in service mode (S18B-206S, PI: Y. Koyama) under very good seeing conditions (FWHM=0.4′′), and the total exposure time was 180-min. The data are reduced in a standard manner using the mcsred2 software (Tanaka et al. 2011).
We use ULTRA-VISTA -band images (McCracken et al. 2012) to measure the continuum levels for the NB data. To reliably select emission-line objects, it is important to perform photometry in a consistent way for broad- and narrow-band data. After smoothing our NB image to match the PSF size of the -band image (0.8′′), we use the dual-image mode of SExtractor (ver.2.19.5; Bertin & Arnouts 1996) to create a NB-selected source catalogue. We use 1.6′′ aperture photometry (2PSF size in diameter) to determine the source detection and NB colours. By distributing apertures (with the same size) at random positions on the NB and images, we estimate 5 limiting magnitudes for NB2071 and image as 23.46 mag and 25.05 mag, respectively. We apply an aperture correction of 0.34-mag to derive their total magnitudes, based on the median difference between the aperture magnitudes (mag_aper) and petrosian magnitudes (mag_auto).22 2 Three H emitters selected in this study do not satisfy NB0.25 if we use mag_auto to define a NB excess. The cluster total H SFR would be reduced by 12% if we remove these sources from the analyses. We detect 829 NB sources (5), in which 800 (97%) sources have counterparts in the COSMOS2015 catalogue (Laigle et al. 2016). We use those 800 galaxies as the parent sample of this study, out of which 142 sources (18%) have redshifts from the COSMOS spectroscopic surveys.
In Fig. 1, we plot NB colours against their NB magnitudes. We here applied 0.08-mag offset to the -band magnitudes to account for the spectral slope of the standard star (GD153) used for NB2071 photometry. We also applied a small offset (0.03-mag) in the NB photometry to set NB0 (median) at the bright end, to properly evaluate the NB excess with respect to the continuum flux density at the same wavelength. We define 53 sources which satisfy NB0.25 and NB2.5 as NB emitters (black squares in Fig. 1), where represents the colour excess in NB (e.g. Bunker et al. 1995). We note that all the NB emitters identified here are also detected at 3 levels in the ULTRA-VISTA -band data.
To select H emitters (HAEs) at 2.16 and remove interlopers, we use spec-, photo- (from COSMOS2015 catalogue), and BzK colours. We first select 6 emitters with 2.1502.164 (Polletta et al. in prep.) as spec- HAEs. For those without spec- information, we select HAEs using the photo- (1.82.4); we here use zminchi2 from the COSMOS2015 catalogue, defined as the minimum of the distribution from the template fitting (see Laigle et al. 2016 for details). In addition, we select NB emitters satisfying the BzK criteria (Fig. 1), regardless of their photo-. Because the photo- uncertainty is often large for SF galaxies with blue/featureless SEDs at 2, the BzK selection combined with the NB excess is shown to be an efficient way for selecting HAEs at the targeted redshifts (e.g. Koyama et al. 2013a; Shimakawa et al. 2018). Amongst the 53 NB emitters, we select 38 HAEs in total; i.e. 6 galaxies as spec- HAEs, 25 galaxies as photo- HAEs (5 of which are spec- HAEs), and 12 additional galaxies as BzK HAEs. As can be seen in the BzK diagram, most of the spec- and photo- HAEs also satisfy BzK selection. We note that three NB emitters are not detected at - or -band, one of which is undetected at both - and -band. We keep these sources as their lower/upper limits still satisfy the BzK criteria. We note that the source undetected at both - and -band is indicated with "B" mark in Fig. 2, and this source contributes 4.5% of the cluster total SFR.
3 Results and Discussion
3.1 Massive H emitters in the proto-cluster core
We show in Fig. 2 the 2-D distribution of the HAEs (squares), photo- selected potential cluster members (1.82.4; black circles), and all the NB-detected objects (grey circles) in the PHz G237 field. Objects with “S” marks are spectroscopic members, six of which are HAEs. We compute the local number density of HAEs at a given point by applying gaussian smoothing (300 kpc) for each HAE and by combining the tails of those gaussian wings (see contours in Fig. 2). The smoothing radius is chosen following the typical size of HAE overdensities associated with rich proto-clusters at similar redshifts (e.g. Koyama et al. 2013a). We determine (R.A., Dec.)(10:01:53.67, 02:19:38.9) as the HAE density peak.
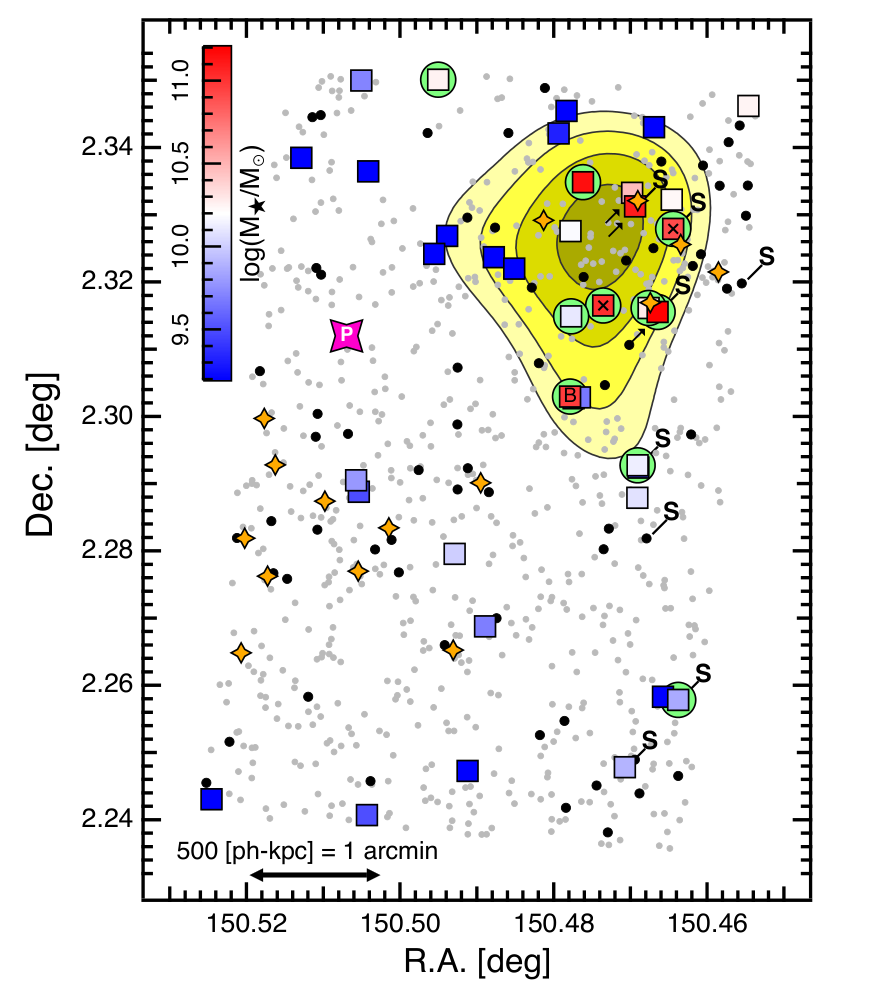
In Fig. 2, HAE symbols are colour coded based on their ; i.e. redder colours indicate higher . Stellar masses of HAEs are derived by fitting the SEDs (uBVrizJHK and IRAC ch1 and ch2 photometry from COSMOS), using the fast code (Kriek et al. 2009). We here assume the fixed redshift (2.16), the Bruzual & Charlot 2003 stellar population synthesis model, the Calzetti et al. 2000 dust attenuation law, and the Chabrier 2003 IMF. We also assume exponentially declining SFRs (SFR) with parameter ranges of and age of 107–1010 yr, metallicity[0.004, 0.008, 0.02], and 0.0–3.0 mag.
Fig. 2 demonstrates that massive HAEs (with 10) are strongly clustered around the density peak. A similar trend was reported for other candidate proto-clusters at 2 (e.g. Hatch et al. 2011; Matsuda et al. 2011; Koyama et al. 2013a), suggesting an accelerated galaxy growth in dense environments in the early universe. We note that many of those massive HAEs residing in the proto-cluster environment are individually detected at Spitzer/MIPS 24m image (as shown with green circles in Fig. 2). Their stellar masses are already comparable to the present-day massive cluster galaxies, but they are still actively forming stars (see also Section 3.2). It should also be noted that two of the massive HAEs near the density peak are X-ray sources (see “x” marks in Fig. 2), suggesting H emission of these two galaxies may be contributed by AGNs. The stellar masses of these X-ray HAEs may be overestimated, but their stellar masses would still be higher than the median of our HAEs sample, even if we consider a significant fraction of their estimates are contributed by AGNs (see Section 3.2).
3.2 Proto-cluster HAEs on the SFR– relation
We derive the H+[Nii] line fluxes (), continuum flux density (), and the rest-frame equivalent widths (EWrest) of HAEs from the -band and NB2071 photometry in the same way as Koyama et al. 2013a. We estimate the contribution of [Nii] lines ([Nii]/H ratio) and H dust attenuation () using the empirical calibrations established for local SF galaxies; we use [Nii]/H–EWrest(H) relation presented by Sobral et al. 2012, and the ––EWrest(H) relation from Koyama et al. 201533 3 We confirmed that our conclusions are unchanged even if we use the derived from SED fitting to predict (assuming the Calzetti et al. 2000 curve and (BV)star/(BV)gas0.44). We find that the average dust-corrected SFRs could be higher by a factor of 1.8 in this case, but we caution that there is a large uncertainty in the (BV)star/(BV)gas ratio (which can be 0.44–1.0; see e.g. Koyama et al. 2019).. We then convert the H luminosity to SFRHα using the Kennicutt 1998 relation by taking into account the IMF difference.
In Fig. 3, we show the SFR– diagram for the HAEs in the PHz G237 field (coloured symbols). In this plot, the colour coding indicates the distance from the HAE density peak; the redder colour symbols show HAEs located closer to the highest-density region. It can be seen that the distribution of HAEs near the density peak (red/orange symbols) tend to be skewed to the massive end, as already discussed in Section 3.1. We also plot in Fig. 3 the HAEs in the Spiderweb proto-cluster at the same redshift (2.16) selected using the same NB filter and the same instrument (Shimakawa et al. 2018; see also Koyama et al. 2013a). For HAEs with 9.5, we find that the fraction of massive HAEs (with 10.5) is consistent between PHz G237 (2612%) and Spiderweb (309%). The dot-dashed line in Fig. 3 is the SF main sequence (SFMS) derived for the field HAEs at 2 (Oteo et al. 2015). We note that all these studies are based on H emitters, and use similar approaches to derive and SFRs. Our results suggest that the SFMS for HAEs in the PHz G237 proto-cluster field are broadly consistent with those in the Spiderweb proto-cluster and in the general field at similar redshifts, suggesting similar mass growth rates in all environments at a given stellar mass, consistent with our previous studies (e.g. Koyama et al. 2013b).
The two X-ray detected HAEs are shown with "X" marks in Fig. 3. If we remove these two AGN candidates, massive HAEs within 500-kpc from the density peak tend to be located below the SFMS. This result may suggest a decline of specific SFRs in dense environments, but we must wait for future spectroscopic observations because accurate dust attenuation correction is critical to reliably measure the SFRs of such massive SF galaxies at high-. In fact, there are two 24m-detected HAEs located significantly below the SFMS in Fig. 3, but their SFRs derived from 24m photometry (using the SED templates presented by Wuyts et al. 2008) turn out to be 0.6–0.7-dex higher than what we expected from the dust-corrected H line (see the inset in Fig. 3). Unfortunately, the IR-based SFRs are not available for other MIPS-undetected HAEs (and SFRs from 24m alone also suffer from large uncertainties). In any case, we need spectroscopic follow-up observations to accurately measure the dust attenuation effects, to discuss the exact locations of proto-cluster HAEs with respect to the SFMS.

3.3 Cluster total SFR from H and IR
In Fig. 4, we show the cumulative SFR distribution from the HAE density peak (out to 1-Mpc). The black and grey lines represent the results when we use dust-corrected and dust-uncorrected H SFRs, respectively. For both black and grey lines, the solid lines show the results for all HAEs, while the dashed lines show the results when we remove two X-ray AGNs. We also show in Fig. 4 the cluster-integrated SFRs measured with various approaches. The blue hatched region shows the integrated dust-corrected SFRHα for all HAEs within the MOIRCS FoV (the width of the hatched region indicates the results with/without AGNs). The orange shaded region shows the integrated SFR(MIR)s of the 24m-detected HAEs. It seems that the total dust-corrected SFRHα are consistent with 24m-based SFRs, but we caution that the total MIPS SFR is computed only for 10 HAEs which are individually detected at 24m, and thus can be regarded as the lower limit for the cluster total SFR.
The green shaded region in Fig. 4 shows the cluster total SFRFIR as a sum of 15 Herschel sources with red FIR colours (0.7 and 0.6; Planck Collaboration 2015) in the MOIRCS FoV (see orange stars in Fig. 2). Here we use cmcirsed package (Casey 2012) to fit the Herschel/SPIRE photometry with a modified grey-body function at 30 K and 35 K (with fixed 1.8) to estimate the total (8–1000m). The FIR colour criteria are supposed to select galaxies at 2–4 (and may suffer from fore-/background interlopers), but it is worth noting that the total SFR could be 5 higher than what we expect from H. We also calculate the SFR(FIR) from the Planck 857GHz and 545GHz fluxes (assuming and 30 K; the red shaded region in Fig. 4). We must regard this as an upper limit of the cluster total SFR as the Planck fluxes are contributed by all sources within the Planck beam (see consistent results in Planck Collaboration 2015). We also note that our H data does not cover the full Planck beam area (see Fig. 2). In addition, some sources may lie outside the redshift range covered by the NB filter (2,000 km/s). Therefore, we cannot rule out the possibility that there exist other structures contributing to the Planck fluxes outside the current H survey.
Our results suggest that the cluster total SFR measured with H could be an order of magnitude smaller than IR-based SFRs. This large difference may in part come from uncertainties in calibration between H- and IR-based SFRs at high-, or we may underestimate the H dust attenuation for individual HAEs. It is also possible that a large number of cluster members which are not identified as HAEs contribute to the cluster total IR luminosities (like “optically dark” galaxies; e.g. Simpson et al. 2014; Franco et al. 2018). Deep and wide-field sub-millimeter mapping with ALMA (e.g. Umehata et al. 2017; Kneissl et al. 2019) would be a powerful approach to resolve the dust-enshrouded SF activity within young dusty proto-clusters.

4 Summary
With our Subaru/MOIRCS NB H imaging observations towards a Planck compact source lying in the COSMOS field (PHz G237.0+42.5), we reported the discovery of a dusty proto-cluster at associated with an over-density of massive HAEs. We identified 38 HAEs at within the observed 4′7′ FoV, out of which 6 galaxies are spectroscopically confirmed. We find that massive HAEs (with 10) are strongly clustered in the proto-cluster core region (within 300-kpc from the HAE density peak). Most of the HAEs in the PHz G237 proto-cluster region are typical SF galaxies on the SFMS. While we find the most massive HAEs may have suppressed SFRs (from H-based SFR estimates), their 24m-derived SFRs are consistent with lying along the SFMS. By integrating the H-based SFRs of all H emitters, we estimate that the cluster total H SFR could be an order of magnitude smaller than those predicted from Planck/Herschel FIR photometry. Our results suggest that H is a good indicator for detecting moderately SF galaxies and tracing the large-scale environment in and around high- dusty clusters, but there remains a possibility that a significant amount of star formation is obscured by dust and unseen by H observations.
Acknowledgements
We thank the reviewer for their careful read and constructive comments, which improved the paper. The narrow-band imaging data used in this paper are collected at the Subaru Telescope, which is operated by the National Astronomical Observatory of Japan (NAOJ). This work was financially supported in part by a Grant-in-Aid for the Scientific Research (No.18K13588) by the Japanese Ministry of Education, Culture, Sports and Science. MP acknowledges the financial support from Labex OCEVU. This research has made use of data from HerMES project (http://hermes.sussex.ac.uk/).
Data Availability
The data underlying this article will be shared on reasonable request to the corresponding author.
References
- Bertin & Arnouts (1996) Bertin E., Arnouts S., 1996, A&AS, 117, 393
- Bower, Lucey & Ellis (1992) Bower R. G., Lucey J. R., Ellis R. S., 1992, MNRAS, 254, 601
- Bruzual & Charlot (2003) Bruzual G., Charlot S., 2003, MNRAS, 344, 1000
- Bunker et al. (1995) Bunker A. J., Warren S. J., Hewett P. C., Clements D. L., 1995, MNRAS, 273, 513
- Calzetti et al. (2000) Calzetti D., Armus L., Bohlin R. C., Kinney A. L., Koornneef J., Storchi-Bergmann T., 2000, ApJ, 533, 682
- Casey (2016) Casey C. M., 2016, ApJ, 824, 36
- Casey (2012) Casey C. M., 2012, MNRAS, 425, 3094
- Chabrier (2003) Chabrier G., 2003, PASP, 115, 763
- Cheng et al. (2019) Cheng T., et al., 2019, MNRAS, 490, 3840
- Chiang et al. (2017) Chiang Y.-K., Overzier R. A., Gebhardt K., Henriques B., 2017, ApJL, 844, L23
- Clements et al. (2014) Clements D. L., et al., 2014, MNRAS, 439, 1193
- Daddi et al. (2004) Daddi E., et al., 2004, ApJ, 617, 746
- Dannerbauer, et al. (2014) Dannerbauer H., et al., 2014, A&A, 570, A55
- Darvish et al. (2020) Darvish B., et al., 2020, ApJ, 892, 8
- Flores-Cacho et al. (2016) Flores-Cacho I., et al., 2016, A&A, 585, A54
- Franco et al. (2018) Franco M., Elbaz D., Béthermin M., Magnelli B., Schreiber C., Ciesla L., Dickinson M., et al., 2018, A&A, 620, A152
- Geach et al. (2008) Geach J. E., Smail I., Best P. N., Kurk J., Casali M., Ivison R. J., Coppin K., 2008, MNRAS, 388, 1473
- Greenslade et al. (2018) Greenslade J., et al., 2018, MNRAS, 476, 3336
- Hatch et al. (2011) Hatch N. A., Kurk J. D., Pentericci L., Venemans B. P., Kuiper E., Miley G. K., Röttgering H. J. A., 2011, MNRAS, 415, 2993
- Hayashi et al. (2016) Hayashi M., et al., 2016, ApJL, 826, L28
- Hayashi et al. (2012) Hayashi M., Kodama T., Tadaki K.-. ichi ., Koyama Y., Tanaka I., 2012, ApJ, 757, 15
- Hill et al. (2020) Hill R., et al., 2020, MNRAS, 495, 3124
- Kennicutt (1998) Kennicutt R. C., 1998, ApJ, 498, 541
- Kneissl et al. (2019) Kneissl R., et al., 2019, A&A, 625, A96
- Koyama et al. (2019) Koyama Y., Shimakawa R., Yamamura I., Kodama T., Hayashi M., 2019, PASJ, 71, 8
- Koyama et al. (2013b) Koyama Y., et al., 2013, MNRAS, 434, 423
- Koyama et al. (2013a) Koyama Y., et al., 2013, MNRAS, 428, 1551
- Koyama et al. (2015) Koyama Y., et al., 2015, MNRAS, 453, 879
- Kriek et al. (2009) Kriek M., van Dokkum P. G., Labbé I., Franx M., Illingworth G. D., Marchesini D., Quadri R. F., 2009, ApJ, 700, 221
- Kubo et al. (2019) Kubo M., et al., 2019, ApJ, 887, 214
- Lacaille et al. (2019) Lacaille K. M., et al., 2019, MNRAS, 488, 1790
- Laigle et al. (2016) Laigle C., et al., 2016, ApJS, 224, 24
- Lilly et al. (2007) Lilly S. J., Le Fèvre O., Renzini A., Zamorani G., Scodeggio M., Contini T., Carollo C. M., et al., 2007, ApJS, 172, 70
- McCracken et al. (2012) McCracken H. J., Milvang-Jensen B., Dunlop J., Franx M., Fynbo J. P. U., Le Fèvre O., Holt J., et al., 2012, A&A, 544, A156
- Matsuda et al. (2011) Matsuda Y., et al., 2011, MNRAS, 416, 2041
- Miller et al. (2018) Miller T. B., et al., 2018, Natur, 556, 469
- Oliver et al. (2012) Oliver S. J., Bock J., Altieri B., Amblard A., Arumugam V., Aussel H., Babbedge T., et al., 2012, MNRAS, 424, 1614
- Planck Collaboration (2016) Planck Collaboration, et al., 2016, A&A, 596, A100
- Planck Collaboration (2015) Planck Collaboration, et al., 2015, A&A, 582, A30
- Polletta et al. (in prep.) Polletta M., et al., 2020, in prep.
- Oteo et al. (2018) Oteo I., et al., 2018, ApJ, 856, 72
- Oteo et al. (2015) Oteo I., Sobral D., Ivison R. J., Smail I., Best P. N., Cepa J., Pérez-García A. M., 2015, MNRAS, 452, 2018
- Overzier (2016) Overzier R. A., 2016, A&ARv, 24, 14
- Shimakawa et al. (2018) Shimakawa R., et al., 2018, MNRAS, 481, 5630
- Simpson et al. (2014) Simpson J. M., Swinbank A. M., Smail I., Alexander D. M., Brandt W. N., Bertoldi F., de Breuck C., et al., 2014, ApJ, 788, 125
- Sobral et al. (2013) Sobral D., et al., 2013, MNRAS, 428, 1128
- Sobral et al. (2012) Sobral D., Best P. N., Matsuda Y., Smail I., Geach J. E., Cirasuolo M., 2012, MNRAS, 420, 1926
- Speagle et al. (2014) Speagle J. S., Steinhardt C. L., Capak P. L., Silverman J. D., 2014, ApJS, 214, 15
- Strazzullo et al. (2018) Strazzullo V., et al., 2018, ApJ, 862, 64
- Tadaki et al. (2013) Tadaki K., Kodama T., Tanaka I., Hayashi M., Koyama Y., Shimakawa R., 2013, ApJ, 778, 114
- Tanaka et al. (2011) Tanaka I., et al., 2011, PASJ, 63, 415
- Umehata et al. (2017) Umehata H., et al., 2017, ApJ, 835, 98
- Wang et al. (2016) Wang T., et al., 2016, ApJ, 828, 56
- Whitaker et al. (2014) Whitaker K. E., Franx M., Leja J., van Dokkum P. G., Henry A., Skelton R. E., Fumagalli M., et al., 2014, ApJ, 795, 104
- Wuyts et al. (2008) Wuyts S., Labbé I., Förster Schreiber N. M., Franx M., Rudnick G., Brammer G. B., van Dokkum P. G., 2008, ApJ, 682, 985