Approach for Document Detection by Contours and Contrasts Thanks: This work is partially financially supported by Russian Foundation for Basic Research, projects 17-29-03236 and 17-29-03170.
Abstract
This paper considers arbitrary document detection performed on a mobile device. The classical contour-based approach often fails in cases featuring occlusion, complex background, or blur. The region-based approach, which relies on the contrast between object and background, does not have application limitations, however, its known implementations are highly resource-consuming. We propose a modification of the contour-based method, in which the competing contour location hypotheses are ranked according to the contrast between the areas inside and outside the border. In the experiments, such modification allows for the decrease of alternatives ordering errors by 40% and the decrease of the overall detection errors by 10%. The proposed method provides unmatched state-of-the-art performance on the open MIDV-500 dataset, and it demonstrates results comparable with state-of-the-art performance on the SmartDoc dataset.
Index Terms:
document detection, quadrangle detection, smartphone-based acquisition, mobile document recognition, image segmentation.I Introduction
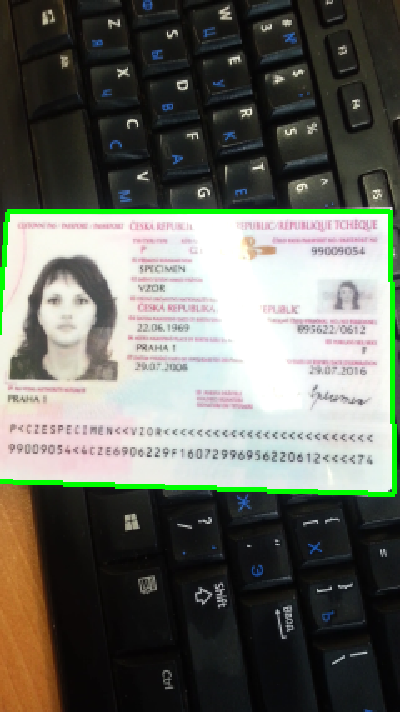
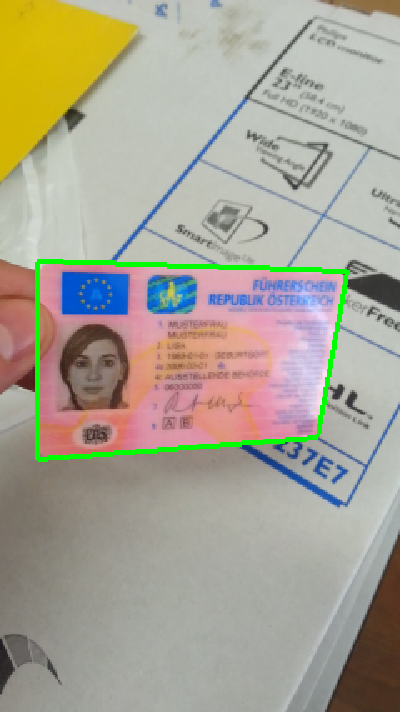
Quadrilateral detection problem (Fig. 1) quite often takes place in computer vision tasks. This is not surprising since rectangular objects are widespread in the urban scenes, and four points are enough to form homography basis for a planar part of the scene, and perform a local rectification. Thus, quadrilateral detection is used, for example, in automatic processing of documents [1], signboards [2], whiteboards [3], vehicle license plates [4], road signs [5], paintings [6], beds in hospital [7], and etc. Another application is an estimation of the observer orientation in scene’s coordinate system specified by a rectangular object, for example, by a truck body [8] or by corners of an evacuation plan [9].
In this paper, we consider the quadrilateral detection problem for flat document detection. We assume that the image is known to contain only one document, this document has an unknown internal structure (for instance, this is the case for bank cards recognition). Also, we suppose that there is no a priori information about camera intrinsic parameters (for example, back focal distance).
(a)
(b)
The classical contour-based approach to this problem is based on the following steps: edge detection, borders candidate selection, quadrilaterals candidate construction, and, finally, ranking of these candidates (alternatives) to choose the best one [3, 11, 12, 13, 14]. The key assumption of this approach is that borders of the target object form consistent and unambiguous strong poly-line contour on the image. In other words, contour-based algorithms usually have difficulties when sought contour does not entirely fit the image or is partially occluded, when contrast between object and background is low, in the presence of strong lines crossing object or background, in poor lighting conditions, or when the image is blurred.
Another well-known approach employs known object structure: feature points [15], sets of line segments [16], or maps of local contrasts [17, 18]. These methods are hardly applicable in case of the absence of a priori information about object structure.
Given the lack of knowledge about the object structure, the alternative contour detection approach is region-based. The main difference from the contour-based approach is that region-based method relies on areal contrast between object and background rather than differential characteristics of the border. Region-based algorithms were proposed in [19] and [20], combining region-based segmentation and shape analysis. Approach considered in [19] is quite elegant. The image is segmented by watersheds of filtered color gradients, and then the contours of segments are analyzed as candidates for sought quadrilateral shapes. Though very fast, this algorithm does not perform well, and later, the same authors proposed much slower but more precise algorithm [20]. Interestingly, the paper [21] suggesting the similar approach was published earlier, but it did not demonstrate performance of same good quality.
The different strategy is proposed in [1]: a hypothetical position of the document is optimized in such a way that the color distributions in the internal and external areas of the quadrilateral would differ the most. The advantage of contrast-based approach is robustness in cases featuring background lines and image blurring. However, the computational complexity of such algorithms is usually high and their usage on mobile processors is limited.
In addition to contour and region approaches to the detection of quadrilaterals with unknown internal structure, there are works in which the quadrilateral is detected via set of vertices [5, 22, 23]. The disadvantage of this approach is the assumption of the visible vertices. Therefore, high quality should not be expected when the vertices are obscured or located outside the frame. In [24], a combination of the contours and the vertices is used. And despite the fact that such combination makes the system more robust, the contour-based drawbacks are still present.
The problem of document detection can be reduced not only to the quadrilateral detection, but also to a semantic segmentation problem. This strategy was used in aforementioned region-based algorithms [20, 21] and in systems [25, 26] based on U-Net [27] architecture network.
To solve the problem, a combination of contour and region-based approaches is proposed in this paper. Its main idea is that competing contour location hypotheses are ranked according to the contrast between the areas inside and outside the border. We demonstrate that the usage of both approaches in the quadrilateral scoring reduces the ranking errors by 40%.
II The ranking problem statement
Let us consider an image , a set of quadrilaterals (the details on quadrilaterals baseline set generations are given in paragraph IV-A), and the ground truth quadrilateral which describes the position of an object in the image. It is required to define a function in such way, that the quadrilateral with the highest score fits the ground truth quadrilateral according to a binary quality metric . If the tested quadrilateral is correct, then , otherwise .
III Proposed algorithm
Function should take into account both contour and contrast features of quadrilateral . We search this function in the following form:
| (1) |
where is a contour-based score, which is described in subsection III-A, is a contrast-based score (subsec. III-B), is a combination coefficient (subsec. III-C).

III-A Contour-based score
In classical contour-based algorithms quadrilateral , composed of four borders , is usually estimated via edges (for example, Canny edges [28]). For instance, in [3], a consistency score of all edges is calculated, where the consistency is a ratio of non-zero edges along the border . In paper [11], the function is estimated as .
In our work, the contour score of quadrilateral is based on the edges along the lines forming a quadrilateral. It consists of the reward and penalty (2). The reward is calculated based on the intensity of the edges along four borders of the alternative , and the sum of consistencies of these borders. The penalty is calculated as the total intensity of the edges along the intervals which belong to the lines formed by the borders of the alternative (the intervals are located outside the border and begin at quadrilateral’s corners, the length of each of these 8 intervals is 10 pixels).
| (2) |
III-B Contrast-based score
The evaluation of the match between the inner region of the alternative and the internal structure of the target object (in the lack of knowledge about the object structure) is feasible only under the assumption that the texture of the object is different from the background. The degree of difference between two regions may be used for quadrilateral alternatives scoring. To assess the degree of difference between two regions, for example, intensity [29], color [1], or both characteristics [20] of the image may be used.
In our case, the contrast score of is based on color difference, measured by the Chi-square distance, which was used in [20]. For this, two regions were obtained: external region , and internal (Fig. 2). Then, two histograms, and , computed on the quantized colors of all pixels in the regions and were obtained and normalized. The final score was calculated via two histograms as:
| (3) |
where is a number of bins in each histogram.
III-C Optimization of the combination coefficient
The combination coefficient of two score functions was optimized using the training dataset. Let the training dataset consist of M samples. Each sample features the ground truth quadrilateral ; and for each sample alternatives as well as their contour-based (2) and contrast-based (3) scores are calculated. We need to find the combination coefficient which allows for the largest number of the successful quadrilateral detection instances according to :
| (4) |
A solution to this problem is equivalent to finding all intervals on a line with maximum number of segment intersections.
In further experiments we used , which was optimized using all images of MIDV-500 [10] dataset.
IV Experiments
IV-A Baseline quadrilaterals generation
For baseline set of quadrilaterals generation we used the algorithm derived from the classical contour-based approach [12].
Let the image be in portrait orientation. In [12], it was assumed that the objects’ borders in the image are located in known regions of interest. In our case, the weaker restrictions on the quadrilateral position in the image were used: the opposite sides are either ”mostly horizontal” (the range of tangent is restricted to ) or ”mostly vertical” (assumption *). This assumption is taken into account for all stages of quadrilaterals calculation. Edge extraction results in two edge maps: with ”mostly horizontal” and ”mostly vertical” edges respectively. Then, each edge map is blurred with the Gaussian filter along the direction of the gradient. To improve short sides detection quality, the vertical edge map is divided into three equal parts by horizontal cuts prior to strongest lines search. To search line candidates via edge maps, the Fast Hough Transform (FHT) [30] was applied. As a result of the line search, 15 extreme points for the horizontal FHT image, and 45 for the vertical FHT image (15 from each part) were obtained. Next, a brute-force search of two pairs of lines (vertical and horizontal) was performed. In [12], while searching for the best image of the rectangular object, its geometry was checked. In our work, however, the geometry tests were not used, since our study is primarily focused on contour and contrast features analysis. Finally, all quadrilaterals were sorted in the descending order of the contour-based score (2), and top were selected.
IV-B Datasets and evaluation
All of our quality metrics were based on Jaccard index, which was used in SmartDoc challenge [31]. As it was mentioned above, is the found (or predicted) quadrilateral, is a ground truth image of a rectangle object, and is a template of the rectangle object. Let represent a homography such that . Then, Jaccard index between predicted and ground truth quadrilaterals is calculated as follows:
| (5) |
where .
To check whether the predicted quadrilateral is correct or incorrect, quality metric was used.
| (6) |
where is the threshold coefficient, which was set to 0.945.

(a)

(b)

(c)

(d)
We have tested the proposed algorithms using two open datasets: MIDV-500 [10], which contains images capturing identification documents of different types and with different backgrounds, and SmartDoc [31], which was created specifically for A4 page detection challenge. The first dataset, as it was mentioned previously, contains 500 video clips (10 clips for each of the 50 unique identification documents, i.e. 15000 images in total), the ground truth quadrilateral for each frame, and information about the template sizes . We want to point out the following feature of MIDV-500: in each captured image, the document is not necessarily placed completely within the frame. So, in our experiments, we consider several subsets of the images: first subset contains images in which all 4 vertices of the document are within the frame (9791 images), second subset contains images with at least 3 vertices within the frame (11965 images), and the third subset includes the entire MIDV-500 (all 15000 images).
In contrast to MIDV-500, SmartDoc [31] dataset guarantees that the document is placed fully within the frame. This dataset has its own separation into subsets: it has 5 subsets with different backgrounds, from the easiest one to the most complex.
IV-C Experiment methodology
Before we move on to the experiments, we would like to note some implementation details: since step-edges are scale-invariant features [28], the original image resolution was scaled down to ; in equation (3), the histograms with 512 bins (by 8 on each of RGB channels) were used.
To run the system using the combined score (1), the values of parameters and should be defined. Let us remind that is a number of top (par. IV-A) quadrilateral alternatives ranked using the combined score, and is the combination coefficient (1). To select , several experiments were performed, each featuring different number of considered alternatives (Fig. 4). For each value of independently, the optimal value of the combination coefficient was calculated (par. III-C). As it was mentioned above, all 15 000 images from the MIDV-500 dataset were used to optimize . Let us consider Fig. 4. With the increase of the number of considered alternatives, the quality of the algorithm performance on the entire MIDV-500 dataset also increases up to 73.73% until . For large , the quality changes negligibly, thus, in the following experiments, the combined score was used to rank top 11 quadrilateral alternatives.

|
|
|
| |||||
|---|---|---|---|---|---|---|---|---|
| Contour | 2850 | 660 | 854 | 4366 | ||||
| Combined | 2803 | 627 | 509 | 3941 | ||||
| Improvement | 47 | 33 | 345 | 425 | ||||
| Relative improvement | 1.65% | 5.0% | 40.4 % | 9.73% |
IV-D Results and performance analysis on MIDV-500
Let us start with the proposed algorithms performance quality evaluation on MIDV-500, and the error classification for each case. Then, we demonstrate the time performance on a mobile device.
The percentage of correctly (6) localized quadrilaterals, while using only contour-based score (2), on the entire MIDV-500 dataset was 71%.
All localization errors can be divided into 4 classes: (i) less than 20% of at least one of the ground truth quadrilateral’s borders is present within the frame, (ii) no lines were found in the vicinity of , (iii) ranking system error and (iv) the assumption (*) is violated. Let us note that the errors of the third class are our target. The distribution of errors by class is as follows: 65% correspond to the first class, 15% to the second, and 20% to the third. The error percentage of the fourth class is negligible (2 errors). The number of errors for each of the first three classes if using only the contour-based score is shown in the first row of Table I.
The number of errors if using the combined score (the second row of Table I) is decreased by 10% compared to the total number of errors of the algorithm with contour-based score. More than 80% of all corrected errors belong to the target class (iii). The main achievement of the proposed algorithm is that by combined score employment we managed to reduce the number of class (iii) errors by 40% (see the fourth row in Table I). As it was expected, the proposed algorithm was able to fix cases when the following two conditions were met: (i) the quadrilateral with the highest contour score was formed by background lines and (ii) its difference between foreground and background was small (Fig. 3.a and 3.b). Moreover, the proposed algorithm sometimes was able to fix cases with strong background and foreground difference (Fig. 3.c), and cases featuring the occlusion of the object (Fig. 3.d).
The runtime of the system was measured on iPhone 6 in single-thread mode. For this experiment, 100 random images from the MIDV-500 dataset were selected. The system with only contour-based score required 82 ms per image, while the runtime of the system with the combined score was 88 ms per image, which is 7.3% slower.
IV-E Comparison with state-of-the-art
To compare our method with state-of-the-art document detection algorithms using the MIDV-500 dataset, we looked for the open source code of five best systems according to their performance on SmartDoc dataset. It turned out that only one of them is an open source algorithm: in [22], the recursive CNN for corner detection was applied. Their pretrained model which we used in this experiment was optimized on SmartDoc dataset, so we were able to validate the results of our measurements. We also found another work [25] with open source code, which employs neural network based on U-Net [32] architecture. The proposed model uses much less parameters than the original U-Net, and it has similar performance quality to the semantic segmentation on their synthetic private dataset. Unfortunately, there are no results for performance quality on an open dataset described, so we were not able to validate the correctness of our experiments on MIDV-500.
To evaluate the performance quality, we used Jaccard index (5) averaged over all frames.
Results of performance quality evaluation are demonstrated in Table II. It clearly shows that our algorithm with modification allows for the highest performance quality. Low quality of other methods can be explained by the fact that we use the pretrained models, which did not encounter the documents and backgrounds from MIDV-500.
Also, we compare our algorithm with the system from [26]. It uses U-Net-like neural network with Fast Hough Transform layers. And unlike other works, their model was trained on the subset of MIDV-500, where at least 3 vertices are within the frame. Only in this experiment, for the comparison we had to measure our algorithm quality performance by the average value over the subset of another variation of Jaccard index:
| (7) |
where is a binary mask with the same size as the input image . This metric takes into account not only the overlay of the object, but also the background. The algorithm from [26] reached 0.96 in metric (7), while our algorithm with contrast-based score reached 0.974 (Table II). Thus, the proposed method provides unmatched state-of-the-art performance on the open MIDV-500 dataset.
| Algorithm |
|
|
| ||||||
|---|---|---|---|---|---|---|---|---|---|
| [Our]: Contour | 0.968 | 0.955 | 0.861 | ||||||
| [Our]: Combined | 0.972 | 0.961 | 0.87 | ||||||
| CS-NUST-2 [22] | 0.739 | 0.705 | 0.626 | ||||||
| OctHU-PageScan [25] | 0.403 | 0.374 | 0.319 | ||||||
| [Our]: Combined | - | 0.974∗ | - | ||||||
| HoughEncoder [26] | - | 0.96∗ | - |
| Algorithm | Background 1 | Background 2 | Background 3 | Background 4 | Background 5 | All | |
|---|---|---|---|---|---|---|---|
| [Our]: Contour | 0.980 | 0.974 | 0.982 | 0.966 | 0.294 | 0.906 | |
| [Our]: Combined | 0.983 | 0.974 | 0.983 | 0.970 | 0.319 | 0.910 | |
| CS-NUST-2 [22] | 0.988 | 0.976 | 0.984 | 0.974 | 0.948 | 0.978 | |
| JCD+CSR [23] | 0.988 | 0.984 | 0.983 | 0.984 | 0.961 | 0.982 | |
| GOP [21] | 0.961 | 0.944 | 0.965 | 0.930 | 0.412 | 0.896 | |
| LRDE-2 [19] | 0.905 | 0.936 | 0.859 | 0.903 | - | - | |
| LRDE-3 [20] | 0.985 | 0.982 | 0.987 | 0.980 | 0.848 | 0.970 | |
|
- | - | - | - | - | 0.942 | |
| Smart Engines [24] | 0.989 | 0.983 | 0.990 | 0.979 | 0.688 | 0.955 | |
| SmartDoc (Averaged) [31] | 0.947 | 0.903 | 0.938 | 0.812 | 0.404 | 0.855 |
Let us consider the proposed algorithm performance on SmartDoc [31] dataset as well as all the available statistics for algorithms with open published papers listed in Table III. This table clearly shows that both of our algorithms demonstrate competitive results on top 4 backgrounds. The main cause of their failure on the fifth background is associated with the fact that our implementation of the quadrilateral detection algorithm is based on contour approach. Since only short parts of the original quadrilateral sides have non-zero contrast, our implementation of the line detection algorithm based on FHT transform often is not able to find all sides of the original quadrilateral. The second reason of failure is associated with the presence of other quadrilateral object (Fig. 5) within the frame featuring much stronger sides and much higher contrast between internal and external regions of the document boundaries.

V Discussion
In the previous section, we demonstrated that the proposed algorithm allows for state-of-the-art performance quality for the MIDV-500 dataset, and a high document detection quality for the majority of the SmartDoc backgrounds. Nevertheless, the preliminary analysis of the SmartDoc results shows that the combined approach does not yield the expected improvement. But a more detailed examination demonstrates that for the first four SmartDoc backgrounds, there are no image distortions which require the combined approach, since contour-based algorithm works well for the images included in these sets. But the fifth background is a subject of a separate discussion.
Since the fifth background of the SmartDoc dataset includes images capturing two quadrilateral objects, target A4 document and a mouse pad (Fig. 5), and the latter features much stronger sides and much higher contrast between internal and external regions of the document boundaries, thus, the detected quadrilateral often corresponds to the mouse pad. Such behavior of the system does not contradict our problem statement, because by problem statement there must be only one document within the frame and more than that information about document internal structure is unknown. Therefore, in the fifth background of SmartDoc, we re-annotated the images which contain two quadrilateral objects. In such cases, we marked as a ground truth the object with maximum areal contrast. After this re-annotation, we measured the performance quality on the fifth background again. The accuracy of the algorithm with only contour-based score was 0.407, and with the combined score – 0.478. Thus, given our problem statement, the performance quality of the proposed algorithm is not bad, since combined score allowed for a higher accuracy. But this result is not sufficient for the combined approach.
In our modification, we use the feature employed in region-based approaches only for the ranking of the quadrilaterals, which were constructed by the contour-based algorithm. This modification is not able to detect the original quadrilateral, if the latter did not get into the list of quadrilaterals to be ranked. Such outcomes are demonstrated in fifth background of SmartDoc dataset, where the performance quality of our contour-based algorithm implementation is low. To check the modification performance within the fifth background, we designed the following experiment for the algorithm employing combined score. Let us consider the alternative with the lowest contour-based score of all the alternatives in the ranking list. We replaced this alternative with the ground truth quadrilateral, and ran the experiments featuring the fifth background again. The quadrilateral detection quality in this case increases from 0.319 to 0.751 (and from 0.478 to 0.917 in case of the re-annotated fifth background of SmartDoc), which demonstrates the applicability of the suggested modification. Note that the quality of 0.751 (0.917 for re-annotated subset) is achieved when the correct alternative is assigned to be the 11th alternative in the ranking list.
As mentioned before, the quality of the contour-based algorithm is pretty low. This is because the borders lack contrast, thus we cannot find the step-edges used in contour detection. Perhaps the results would have been better, if the roof-edges (ridges) were used, as in [34]. But in the case of roof-edges employment, it is dangerous to use downscale as we did in step-edge detection (step-edges are scale-invariant because the size of the document is much bigger than the used scale factor [28] and it is not true for the roof-edges).
For our modification it does not matter how exactly the set of quadrilateral alternatives to be ranked was generated. In this work, we did not consider geometric properties of the object while baseline set of quadrilaterals generation, since we are focused primarily on the contour-based score applicability to the quadrilateral search.
Also we would like to add that unlike the algorithm suggested in [22], which demonstrates one of the highest performance quality on SmartDoc dataset, but needs training for the MIDV-500 dataset, our algorithm does not require any additional tuning.
VI Conclusion
In this paper, the improvement of the classical contour-based approach for the document detection was proposed. The scoring function for the ranking of the quadrilateral candidates was modified: it takes into account not only contour characteristics, but also the degree of difference between internal and external regions of the candidate. This modification reduced the number of the ranking errors by 40%, while retaining its applicability on the mobile phones. The proposed algorithm was also tested on the open datasets. The suggested algorithm demonstrated the highest quality on MIDV-500 dataset and the competitive results on four out of five parts of SmartDoc dataset.
VII Future work
To increase the performance quality of our algorithm in the future, we are going to take into account the geometric properties of the document and its inter-frame transformation in the video stream.
References
- [1] F. Attivissimo, N. Giaquinto, M. Scarpetta, and M. Spadavecchia, “An automatic reader of identity documents,” in 2019 IEEE International Conference on Systems, Man and Cybernetics (SMC). IEEE, 2019, pp. 3525–3530.
- [2] A. Tam, H. Shen, J. Liu, and X. Tang, “Quadrilateral signboard detection and text extraction.” in CISST, 2003, pp. 708–713.
- [3] Z. Zhang and L.-W. He, “Whiteboard scanning and image enhancement,” Digital Signal Processing, vol. 17, no. 2, pp. 414–432, 2007.
- [4] T. D. Duan, D. A. Duc, and T. L. H. Du, “Combining hough transform and contour algorithm for detecting vehicles’ license-plates,” in Proceedings of 2004 International Symposium on Intelligent Multimedia, Video and Speech Processing, 2004. IEEE, 2004, pp. 747–750.
- [5] T. Wenzel, T.-W. Chou, S. Brueggert, and J. Denzler, “From corners to rectangles—directional road sign detection using learned corner representations,” in 2017 IEEE Intelligent Vehicles Symposium (IV). IEEE, 2017, pp. 1039–1044.
- [6] N. S. Skoryukina, D. P. Nikolaev, and V. V. Arlazarov, “2d art recognition in uncontrolled conditions using one-shot learning,” in Eleventh International Conference on Machine Vision (ICMV 2018), vol. 11041. International Society for Optics and Photonics, 2019, p. 110412E.
- [7] P. Kittipanya-Ngam, O. S. Guat, and E. H. Lung, “Bed detection for monitoring system in hospital wards,” in 2012 Annual International Conference of the IEEE Engineering in Medicine and Biology Society. IEEE, 2012, pp. 5887–5890.
- [8] A. Sarkar, L. Stowe, and A. Petersen, “Tractor trailer bsm parameters estimation for smart tractor v2v deployment using cameras,” in Proceedings of the 5th International Symposium on Future Active Safety Technology toward Zero Accidents, 2019.
- [9] M. Peter, N. Haala, and D. Fritsch, “Using photographed evacuation plans to support mems imu navigation,” in Proceedings of the 2011 International Conference on Indoor Positioning and Indoor Navigation (IPIN2011), Guimaraes, Portugal, 2011, pp. 30–81.
- [10] V. V. Arlazarov, K. B. Bulatov, T. S. Chernov, and V. L. Arlazarov, “Midv-500: a dataset for identity document analysis and recognition on mobile devices in video stream,” Computer optics, vol. 43, no. 5, 2019.
- [11] N. Liu and L. Wang, “Dynamic detection of an object framework in a mobile device captured image,” Nov. 20 2018, uS Patent 10,134,163.
- [12] N. Skoryukina, D. P. Nikolaev, A. Sheshkus, and D. Polevoy, “Real time rectangular document detection on mobile devices,” in Seventh International Conference on Machine Vision (ICMV 2014), vol. 9445. International Society for Optics and Photonics, 2015, p. 94452A.
- [13] C. H. Lampert, T. Braun, A. Ulges, D. Keysers, and T. M. Breuel, “Oblivious document capture and real-time retrieval,” in International Workshop on Camera Based Document Analysis and Recognition (CBDAR), vol. 8. Citeseer, 2005.
- [14] M. Hirzer, “Marker detection for augmented reality applications,” in Seminar/Project Image Analysis Graz, vol. 25, 2008.
- [15] A. M. Awal, N. Ghanmi, R. Sicre, and T. Furon, “Complex document classification and localization application on identity document images,” in 2017 14th IAPR International Conference on Document Analysis and Recognition (ICDAR), vol. 1. IEEE, 2017, pp. 426–431.
- [16] J. Fan, “Detection of quadrilateral document regions from digital photographs,” in 2016 IEEE Winter Conference on Applications of Computer Vision (WACV). IEEE, 2016, pp. 1–9.
- [17] S. Usilin, D. Nikolaev, V. Postnikov, and G. Schaefer, “Visual appearance based document image classification,” in 2010 IEEE International Conference on Image Processing. IEEE, 2010, pp. 2133–2136.
- [18] R. Bohush, A. Kurilovich, and S. Ablameyko, “Video-based content extraction algorithm from bank cards for ios mobile devices,” in International Conference on Pattern Recognition and Information Processing. Springer, 2019, pp. 180–191.
- [19] É. Puybareau and T. Géraud, “Real-time document detection in smartphone videos,” in 2018 25th IEEE International Conference on Image Processing (ICIP). IEEE, 2018, pp. 1498–1502.
- [20] M. Ô. V. Ngoc, J. Fabrizio, and T. Géraud, “Document detection in videos captured by smartphones using a saliency-based method,” in 2019 International Conference on Document Analysis and Recognition Workshops (ICDARW), vol. 4. IEEE, 2019, pp. 19–24.
- [21] L. R. Leal and B. L. Bezerra, “Smartphone camera document detection via geodesic object proposals,” in 2016 IEEE Latin American Conference on Computational Intelligence (LA-CCI). IEEE, 2016, pp. 1–6.
- [22] K. Javed and F. Shafait, “Real-time document localization in natural images by recursive application of a cnn,” in 2017 14th IAPR International Conference on Document Analysis and Recognition (ICDAR), vol. 1. IEEE, 2017, pp. 105–110.
- [23] A. Zhu, C. Zhang, Z. Li, and S. Xiong, “Coarse-to-fine document localization in natural scene image with regional attention and recursive corner refinement,” International Journal on Document Analysis and Recognition (IJDAR), vol. 22, no. 3, pp. 351–360, 2019.
- [24] A. Zhukovsky, D. Nikolaev, V. Arlazarov, V. Postnikov, D. Polevoy, N. Skoryukina, T. Chernov, J. Shemiakina, A. Mukovozov, I. Konovalenko et al., “Segments graph-based approach for document capture in a smartphone video stream,” in 2017 14th IAPR International Conference on Document Analysis and Recognition (ICDAR), vol. 1. IEEE, 2017, pp. 337–342.
- [25] R. B. d. N. Junior, L. F. Verçosa, D. Macêdo, B. L. D. Bezerra, and C. Zanchettin, “A fast fully octave convolutional neural network for document image segmentation,” arXiv preprint arXiv:2004.01317, 2020.
- [26] A. Sheshkus, D. Nikolaev, and V. L. Arlazarov, “Houghencoder: neural network architecture for document image semantic segmentation,” preprint, 2020. [Online]. Available: ftp://smartengines.com/preprints/sheshkus2020houghencoder.pdf
- [27] A. Castelblanco, J. Solano, C. Lopez, E. Rivera, L. Tengana, and M. Ochoa, “Machine learning techniques for identity document verification in uncontrolled environments: A case study,” in Mexican Conference on Pattern Recognition. Springer, 2020, pp. 271–281.
- [28] J. Canny, “A computational approach to edge detection,” IEEE Transactions on pattern analysis and machine intelligence, no. 6, pp. 679–698, 1986.
- [29] V. Bobkov, Y. Ronshin, and A. Kudrashov, “Sopostavlenie linij po trem vidam prostranstvennoj sceny,” Journal of information technologies and computing systems, no. 2, pp. 71–78, 2006.
- [30] M. L. Brady, “A fast discrete approximation algorithm for the radon transform,” SIAM Journal on Computing, vol. 27, no. 1, pp. 107–119, 1998.
- [31] J.-C. Burie, J. Chazalon, M. Coustaty, S. Eskenazi, M. M. Luqman, M. Mehri, N. Nayef, J.-M. Ogier, S. Prum, and M. Rusiñol, “Icdar2015 competition on smartphone document capture and ocr (smartdoc),” in 2015 13th International Conference on Document Analysis and Recognition (ICDAR). IEEE, 2015, pp. 1161–1165.
- [32] O. Ronneberger, P. Fischer, and T. Brox, “U-net: Convolutional networks for biomedical image segmentation,” in International Conference on Medical image computing and computer-assisted intervention. Springer, 2015, pp. 234–241.
- [33] H. El Bahi and A. Zatni, “Document text detection in video frames acquired by a smartphone based on line segment detector and dbscan clustering,” Journal of Engineering Science and Technology, vol. 13, no. 2, pp. 540–557, 2018.
- [34] D. Tropin, J. Shemiakina, I. Konovalenko, and I. Faradjev, “Localization of planar objects on the images with complex structure of projective distortion,” Information processes, vol. 19, no. 2, pp. 208–229, 2019.