Constructing transient amplifiers for death-Birth updating: A case study of cubic and quartic regular graphs
Abstract
A central question of evolutionary dynamics on graphs is whether or not a mutation introduced in a population of residents survives and eventually even spreads to the whole population, or gets extinct. The outcome naturally depends on the fitness of the mutant and the rules by which mutants and residents may propagate on the network, but arguably the most determining factor is the network structure. Some structured networks are transient amplifiers. They increase for a certain fitness range the fixation probability of beneficial mutations as compared to a well-mixed population. We study a perturbation methods for identifying transient amplifiers for death-Birth updating. The method includes calculating the coalescence times of random walks on graphs and finding the vertex with the largest remeeting time. If the graph is perturbed by removing an edge from this vertex, there is a certain likelihood that the resulting perturbed graph is a transient amplifier. We test all pairwise nonisomorphic cubic and quartic regular graphs up to a certain size and thus cover the whole structural range expressible by these graphs. We carry out a spectral analysis and show that the graphs from which the transient amplifiers can be constructed share certain structural properties. The graphs are path-like, have low conductance and are rather easy to divide into subgraphs by removing edges and/or vertices. This is connected with the subgraphs being identical (or almost identical) building blocks and the frequent occurrence of cut and/or hinge vertices. Identifying spectral and structural properties may promote finding and designing such networks.
Author summary
Until recently it was assumed that amplifiers of natural selection for the death-Birth Moran process are either very rare or do not exist. Newer results, however, have modified this assumption in two respects. The first result is that if amplifiers for death-Birth updating exist, they must be transient, which means the amplification only applies to a limited range of the mutant’s fitness. The second result is a rather simple numerical test to decide whether or not a graph is an amplifier of weak selection, which means for a small effect of the mutant’s fitness. This test involves to perturb the network describing the interactions between the mutant and the population of residents. We study this perturbation methods for identifying transient amplifiers for death-Birth updating and study their network structure. Thus we identify structural properties of transient amplifiers which may promote finding and designing such networks.
Introduction
An important measure for the success of an initially rare mutant among a resident population on an evolutionary graph is the fixation probability of the mutation. The evolutionary dynamics associated with the mutant’s spread most likely depends on its fitness, with a beneficial mutant possessing a higher fitness than the resident individuals, while a deleterious mutant has a lower fitness. Previous works have shown that compared to the complete graph representing a well-mixed population, some graphs produce a higher fixation probability for a beneficial mutant, thus amplifying the effect of selection [1, 23, 28, 44]. For some other graphs we find the opposite with an increased fixation probability for a deleterious mutation, and thus suppressing selection. Apart from these two groups of graphs, a third category has been identified which is transient amplifiers characterized by an increased fixation probability for some range of the mutant’s fitness.
Fixation probabilities are determined by the structure of the evolutionary graph, but also by the rules by which mutants and residents propagate on the graph. Thus, whether an evolutionary graphs is a transient amplifier, or an amplifier, or a suppressor, does not only depend on the graph but also on the updating rule describing the dynamics of mutants and residents. Two updating rules frequently studied are Birth-death (Bd) updating and death-Birth (dB) updating. As transient amplifiers provide a mechanism for shifting the balance between natural selection and genetic drift, and thus have considerable significance in evolutionary dynamics, they have been studied intensively [2, 7, 23, 45, 51, 1, 44, 38, 28]. In these works there are two main approaches for identifying transient amplifiers. One approach is to check a large number of random graphs, for instance Erdös-Rényi or Barabási-Albert graph [3, 23, 39, 50]. Another approach is to design candidate graphs out of structural aspects and considerations [1, 28, 44, 45]. An example for the first approach is a comprehensive numerical study checking a larger number of random graphs with vertices, which found a multitude of amplifiers of selection for Bd, but none for dB updating [23]. From these results it was assumed that either there are no amplifiers for dB, or they are very rare, at least for graphs with small size. Examples for the second approach involve, for instance, constructing arbitrarily strong amplifiers for star and comet graphs, particularly by additionally designing weights [44, 45].
There are two recent works on amplifiers for dB updating, upon which this work is particularly based. In Tkadlec et al. [51] it is shown that for dB updating no universal amplification is possible and at most evolutionary graphs can be transient amplifiers. In Allen at al. [7] a method is devised to check whether or not a given graph is at least an amplifier for weak selection. This method involves calculating the coalescence times of random walks on the graph [5] and finding the vertex with the largest remeeting time. If subsequently the graph is perturbed by removing an edge from this vertex, there is a certain likelihood that the resulting perturbed graph is a transient amplifier.
In this paper it is proposed to take as an input to this perturbation method all pairwise nonisomorphic cubic and quartic regular graphs up to a certain size. For a small size the exact number of connected (pairwise nonisomorphic) cubic and quartic graphs is known and all graphs can be generated algorithmically [36]. With the available numerical resources results have been obtained for for cubic and for quartic graphs. Thus, the study is conducted for the whole set of these regular graphs and ensures that the whole structural range expressible by these graphs is covered. The results show that a substantial number of graphs obtained by perturbing cubic and quartic regular graphs are transient amplifiers. Thus, the method discussed in the paper yields a sufficiently large set of amplifier graphs, which suggests to consider these graphs as an ensemble to be treated statistically. Moreover, we study structural graph properties by the spectrum of the normalized Laplacian, thus adding to the applications of spectral analysis of evolutionary graphs [46, 47, 48, 49, 6]. In the analysis we use a smoothed spectral density which convolves the eigenvalues with a Gaussian kernel and show that cubic or quartic regular graphs which allow to construct transient amplifiers have a characteristic spectral density curve. Thus, it becomes feasible to deduce from the spectrum of the graph if a transient amplifier can be constructed.
Methods
Constructing transient amplifiers
Our topic is evolutionary dynamics on graphs with a population of individuals on an undirected graph with vertices and edges . Each individual is represented by a vertex and an edge shows that the individuals associated with and are mutually interacting neighbors [5, 33, 40, 43, 46]. We consider the graph to be simple and connected with each vertex having degree , which implies that there is no self-play and the individual on has neighbors. The test set used as an input to the perturbation method for constructing transient amplifiers mostly consists of cubic and quartic regular graphs, for which consequently there is for all vertices .
Individuals can be of two types, mutants and residents. Residents have a constant fitness normalized to unity, while mutants have a fitness . An individual can change from mutant to resident (and back) in a fitness-dependent selection process. We consider a death–birth (dB) process, e.g. [4, 43]. The type of a vertex becomes vacant as the occupying individual is assumed to die, which happens uniformly at random. One of the neighbors is chosen to give birth with a probability depending on its fitness. It hands over its type, thus effectively replacing the death individual.
We are interested in the fixation probability defined as the expected probability that starting with a single mutant appearing at a vertex uniformly at random all vertices of the graph eventually become the mutant type. In particular, we want to know how this fixation probability compares to the fixation probability for the complete graph with vertices for varying fitness . More specifically, a graph is called an amplifier of selection if for and for . Correspondingly, a graph is a suppressor of selection if for and for . Finally, a transient amplifier is characterized by for and , while there is also for for some [7, 23, 1, 44].
There are two recent works on amplifiers for dB updating, which inspired and motivated this work. In Tkadlec et al. [51] it is shown that for dB updating no universal amplification is possible and at most evolutionary graphs can be transient amplifiers. In Allen at al. [7] it is demonstrated that for weak selection, that is for , the question of whether or not a graph is an amplifier can be answered by a numerical test executable with polynomial time complexity. The test relies upon coalescing random walks [5] and involves calculating the effective population size from the relative degree and the remeeting time of vertex by
| (1) |
The remeeting time can be obtained via
| (2) |
from the coalescence times and the step probabilities (implying if and else). The remeeting times observe the condition . Finally, the coalescence times can be computed by solving the system of linear equations
| (3) |
In [7] it is shown that a graph is an amplifier of weak selection if
| (4) |
Furthermore, it is argued that an amplifier of weak selection can be constructed by the following perturbation method. If the graph is -regular, then and for all . Thus, with the identity condition we have , which according to Eq. (4) means that –regular graphs cannot be amplifiers of weak selection. But disturbing the regularity can change the equality . Moreover, it has been analyzed that most promising for such a perturbation is to remove a single (or even more than one) edge from a vertex with the largest remeeting time , that is , on the –regular graph to be tested. The argument is that if we take a regular graph and induce a small perturbation by removing an edge, the relative degree and the remeeting time experience small deviations and . For the identity condition it follows
| (5) |
As there is for the unperturbed regular graph, we obtain
| (6) |
For the calculation of the effective population size, Eq. (1), the perturbation yields
| (7) |
By observing for the unperturbed regular graph and inserting Eq. (6), we get
| (8) |
This relationship implies that a positive perturbation of the effective population size (and thus the possibility to obtain ) is obtained if for a large the perturbation induces a decrease of the relative degree , that is a negative .
Spectral analysis
For the spectral analysis of evolutionary graphs we consider the spectrum of the normalized Laplacian of the graph , which is ; is the adjacency matrix of the graph and is the degree matrix. The spectrum is denoted by and consists of eigenvalues . The spectrum of the normalized Laplacian is used rather than the spectrum of the adjacency matrix as it has been shown that it captures well some geometric properties [11, 12, 13, 20]. In addition, the spectrum is contained in for any graph size and degree, which makes is convenient to compare for varying graphs. From the spectrum a spectral distance can be defined, which can be used to compare two families (or classes) of graphs and . For each family only containing a single member, we in fact can also compare two graphs and . The comparison can be done directly by viewing the histograms of the eigenvalue distribution on a discrete variable as spectral plots [10]. A more refined comparison can be achieved by considering a smoothed spectral density which convolves the eigenvalues with a Gaussian kernel with standard deviation [12, 13, 20]
| (9) |
We set . From this continuous spectral density we can define a pseudometric on graphs by the distance [20]
| (10) |
Results
Regular graphs as amplifier constructors
Previous approaches to finding amplifiers of selection for dB updating focused on checking numerically generated random graphs, for instance Erdös-Rényi or Barabási-Albert graphs with prescribed expected degree or linking number [3, 23, 39, 50]. As we are interested in how population structure relates to evolutionary dynamics, it would be most desirable to study differences in the graph structure among the realizations of random graphs; ideally, these structural differences would encompass all what is structurally possible. There are, however, some problems with such an approach. Suppose we generate random graphs and two of them are structurally the same. In an experimental setting, however, this might be hard to detect as the computational problem of determining whether two finite graphs are isomorphic is not solvable in polynomial time [8, 9]. On the other hand, isomorphic graphs have the same fixation properties. Related to the problem addresses in this paper, the numerical procedure would yield for two random but isomorphic graphs the same . Moreover, even for a relatively small number of vertices, the number of nominally different random graphs is huge, see for instance the results for the class of labelled regular graphs [54]. In addition, algorithms producing random graphs, regular or otherwise, may have a bias towards certain graph structures [15, 30]. Thus, even if a large number of random graphs is produced and checked, there might be isomorphic graphs that have the same structural properties or there might be “blind spots” for certain structural types of graphs. Thus, as long as not all graphs of a certain class are enumerated, it is far from certain that by checking a finite number of random graphs from this class the relevant search space of graph structures has been adequately covered.
The numerical procedure suggested here aims for a more systematically conducted search for a certain class of graphs. For a small number of vertices the exact number of connected (pairwise nonisomorphic) cubic and quartic graphs is known, see e.g. [36] and also Tab. 2. With the numerical resources available for this study cubic graphs could be checked for and quartic graphs for . The complete set is tested. Thus, the study ensures that the whole structural range of these regular graphs is covered. We take these graphs as the input for the perturbation method described in the previous section to find transient amplifiers of weak selection.
| 3 | 4 | 5 | 6-12 | |
|---|---|---|---|---|
| 11 | 1 | 0 | ||
| 12 | 1 | 4 | 0 | 0 |
| 13 | 23 | 0 | ||
| 14 | 7 | 108 / (3) | 30 / (5) | 0 |
| 15 | 562 / (16) | |||
| 16 | 42 | 3.129 / (36) | ||
| 18 | 265 | |||
| 20 | 1.822 | |||
| 22 | 13.889 |
Tab. 1 gives the numbers of regular graphs that produce if the perturbation method is applied. We call these graphs amplifier constructors. Apart from the cubic and quartic graphs, also the graphs with degree have been tested for . Viewing these results, several observations can be made. Within the bounds of the experimental setting, only for regular graphs produce transient amplifiers. For the tested graphs with no such graphs have been found for . It is, however, quite possible that this is due to the number of vertices not large enough and that a certain difference is needed for the property to be an amplifier constructor. Another possibility is that for graphs with a higher degree the perturbation method only gives transient amplifiers if a larger number of edges is removed. This should to be clarified by future work. The smallest graph for which was found is the quartic graph with size given in Fig. 1a. It should be noted that although the results given in this paper apply to unlabeled pairwise nonisomorphic graphs, the vertices of the graph in Fig. 1a, as well as the vertices of graphs in other figures, are labeled with consecutive integers. This is solely done to ease addressing and communicating certain vertices or edges, for instance for indicating which vertex has the largest remeeting time, or which edge is removed from a given graph.
A second observation is that the absolute number is larger than . But as grows much faster than , compare Tab. 2, the relative number is not. For cubic graphs, we have a ratio for , which shows that the percentage of regular graphs with amplifier construction properties starts from more than for to go to and for . For quartic graphs with the ratio sets out with for to end with and for . In other words, regular graphs that construct transient amplifiers are rare but not unprecedented.
(a) (b)
Tab. 1 gives the numbers of graphs from which at least one transient amplifier graph can be constructed. As cubic graphs can be perturbed by removing edges from the vertex with the largest remeeting time, frequently from the same graph more than one amplifier is obtained. Sometimes, the resulting amplifiers are the same due to symmetry (as for instance the graph in Fig. 1a), but there are also cases where transient amplifiers with different arise. The same applies for quartic graphs, which additionally have the property that a small number of these graphs allow to remove 2 egdes to produce an amplifier. This has been observed for and also for the quintic graphs with . Tab. 1 gives the number of these graphs with 2 removable edges as the quantities in parenthesis.
We next look at how the remeeting times are distributed over graphs, see Fig. 2 for results on the cubic graphs with and the quartic graphs with . For other the results are similar. The figures show the variance and maximum over . We see that amplifier constructors have generally large and , but these relation is not very strict. In other words, the remeeting times alone allow no clear conclusions about the graph’s ability to become an amplifier constructor. Another result is that the remeeting times of most of these cubic and quartic graphs have non-negligible variance . This means a mean-field approximation [19], which assumes that the remeeting times have rather equal values, does mostly not apply.


(a) (b)
The results so far are for weak selection, that is with . In other words, the graphs that have are tangential amplifiers. In the following, we check for selected graphs with the range for which they are transient amplifiers. This is in line with the recent finding that for dB updating there are no universal amplifiers [51] and thus there is a finite for which . The study requires to calculate the fixation probabilities and compare them to the fixation probability of the complete graph with vertices, which is [29, 23, 7]
| (11) |
The fixation probabilities are calculated by evaluating a Markov state transition matrix [23, 24, 25]. This methods is an exact computation and does not involve Monte Carlo simulations. Such Monte Carlo simulations rely upon repeating a numerical experiment [16, 25]. A mutant with given fitness is placed randomly on a vertex of the graph. The evolutionary dynamics specified by the dB updating process leads for a sufficiently large number of iterations to either the mutant taking over the entire graph, or the mutant getting extinct. The simulation is repeated many times, which yields a relative frequency of the mutation getting fixated, which in turn is interpreted as the fixation probability. Such a numerical procedure involves a large number of repetitions until an acceptable precision is obtained, and convergence to the fixation probability is sometimes difficult to ascertain [25]. For the exact numerical calculation method used here there are no repetitions and no convergence issues. Apart from the problem of numerical round–off, the method yields an exact value. The limitation of the method is that it requires to solve a system of linear equations, which becomes infeasible for getting large. For , however, the calculations were still possible. Fig. 1b shows the result for the quartic graph with size , which is the smallest graph that is an amplifier constructor, see Tab. 1. For we have .
(a) (b)
For the interval , the fixation probability of the graph is larger than the fixation probability of the complete graph with . As the interval is small with respect to the mutant fitness as well as with respect to the ratio , it could be suspected that the result might be a numerical artefact. Surely, it could be lengthy and arduous to obtain the results by Monte Carlo simulation as the number of repetitions needed to achieve convergence to the level of required precision would be rather high. However, the results given in Fig. 1b are obtained by exact calculation of the fixation probabilities. An important argument in favor of the validity of the results is that apart from round–of errors the method does not suffer from convergence issues. In order to get an estimation of the round–off error, the calculation of the fixation probabilities is compared to the two cases of regular graphs for which analytical results exist. The comparisons are to the complete graph, which is -regular, and to the cycle graph, which is -regular. For the complete graph the fixation probability is given by Eq. (11). For the cycle graph it is [29, 23, 7]
| (12) |
Fig. 9 of the Supporting Information gives the relative error between the calculated fixation probabilities using the Markov state transition matrix calculation used in this paper and the analytical results for a complete and a cycle graph of size and . We see that the round-off error is in the magnitude of , while the differences between the fixation probabilities are in the magnitude of . Therefore, the results given in Fig. 1b should be regarded as valid.
For the number of vertices increasing, a larger number of regular graphs are amplifier constructors, and also and the maximal ratio increases, see as another example the quartic graph of size in Fig. 3a, which is the graph with the largest among the quartic graph of size with . A main difference to the example of the graph in Fig. 1a is a lower level of symmetry in the graph. Thus, it matters which of the edges connecting the vertex with the largest remeeting time () with other vertices is removed. For 2 of the 4 edges we obtain a transient amplifier, but with different . For the other two edges, we obtain for , but for some . Thus, such a behavior could be seen as a transient suppressor. The Supporting Information contain further examples of transient amplifiers of cubic graphs with and quartic graphs with , which each produce the largest , see Fig. 11 and Fig. 12.
We now study the relationship between and , see Fig. 4 showing results for all cubic graphs with and all quartic graph with with . Again, the results for other are similar. The values of are calculated from by interpolation using a Lagrange polynomial. There is an almost linear relationship between and . As is the tangential fixation probability at , this means that the curve of is approximately a parabola, whose intersection with at is determined by . The results additionally suggest that instead of searching a large , we may use as a proxy. As calculating has polynomial time complexity, while calculating via is exponential, this relationship may save numerical resources. However, it needs to be checked by additional work if the almost linear relationship between and is still valid for transient amplifiers that are more strongly perturbed with respect to their regularity as the examples considered here with just a single edge removed.
(a) (c)
(b) (d)
The results in Tab. 1 suggest that amplifier constructors are rare compared to the total number of non-isomorphic regular graphs, but their number might not be limited. There is another argument for assuming that there are arbitrary many regular graphs that produce transient amplifiers by the perturbation method. Some regular amplifier constructors can be used as building blocks to obtain more amplifier constructors. The simplest example is the quartic graph on vertices shown in Fig 1a. From this graph another quartic graph on vertices can be obtained by the following procedure. We take two copies of graph and call them a head and a tail, respectively. From the head we remove the edge and from the tail, we remove the edge . We build a single graph from the head and the tail by retaining the indices of the vertices from the head and renaming the vertices of the tail by . All edges apart from those removed remain unchanged. We finally connect head and tail by additional edges and , see Fig. 5a. From the graph a transient amplifier can be constructed by removing the edge (or ) to obtain .
Another example is the cubic graph in Fig. 5b, which is the only cubic graph of size that is an amplifier constructor, compare also to Fig. 2a in Allen et al. [7]. Here we remove the edge from the head and from the tail, and connect head and tail by the edges and , see Fig. 5c. The use of building blocks can be extended by placing mid-sections between the head and the tail. From these mid-sections we need to remove the edges as for the head and the tail, for instance and for the quartic graph on vertices in Fig 1a. We then connect the mid-section to the head on the one side and to the tail on the other. Fig. 1d shows the ratio over for such chains using the building blocks of the quartic graph on vertices, Fig 1a, and the cubic graph on vertices, Fig. 5b, for and . For the number of midsections (and thus the number of vertices) increasing we continue to obtain graphs that are transient amplifiers. However, for getting larger the ratio slowly converges to one from above.
(a) 14 4 (b) 16 3
(a) 14 4 (d) 16 3
(b) 14 4 (e) 16 3
(c) 14 4 (f) 16 3
Spectral analysis of amplifiers constructors
In the previous section it has been argued that regular graphs are a suitable input for a perturbation method to construct transient amplifiers of a dB updating process. In particular, it was shown that a small but significant subset of all pairwise non-isomorphic cubic and quartic regular graphs up to a certain size ( for cubic and for quartic) yields amplifier constructors. The results even suggest that the number of amplifier constructors is not limited on the graph size tested by the experimental settings of this paper. As the population structure is expressed by the graph structure this naturally poses this question: Is there something in the structure of these graphs that makes them prone to construct amplifiers? In the following we approach this question by methods of spectral graph theory [20, 53, 52], adding to the applications of spectral analysis of evolutionary graphs [46, 47, 48, 49, 6].
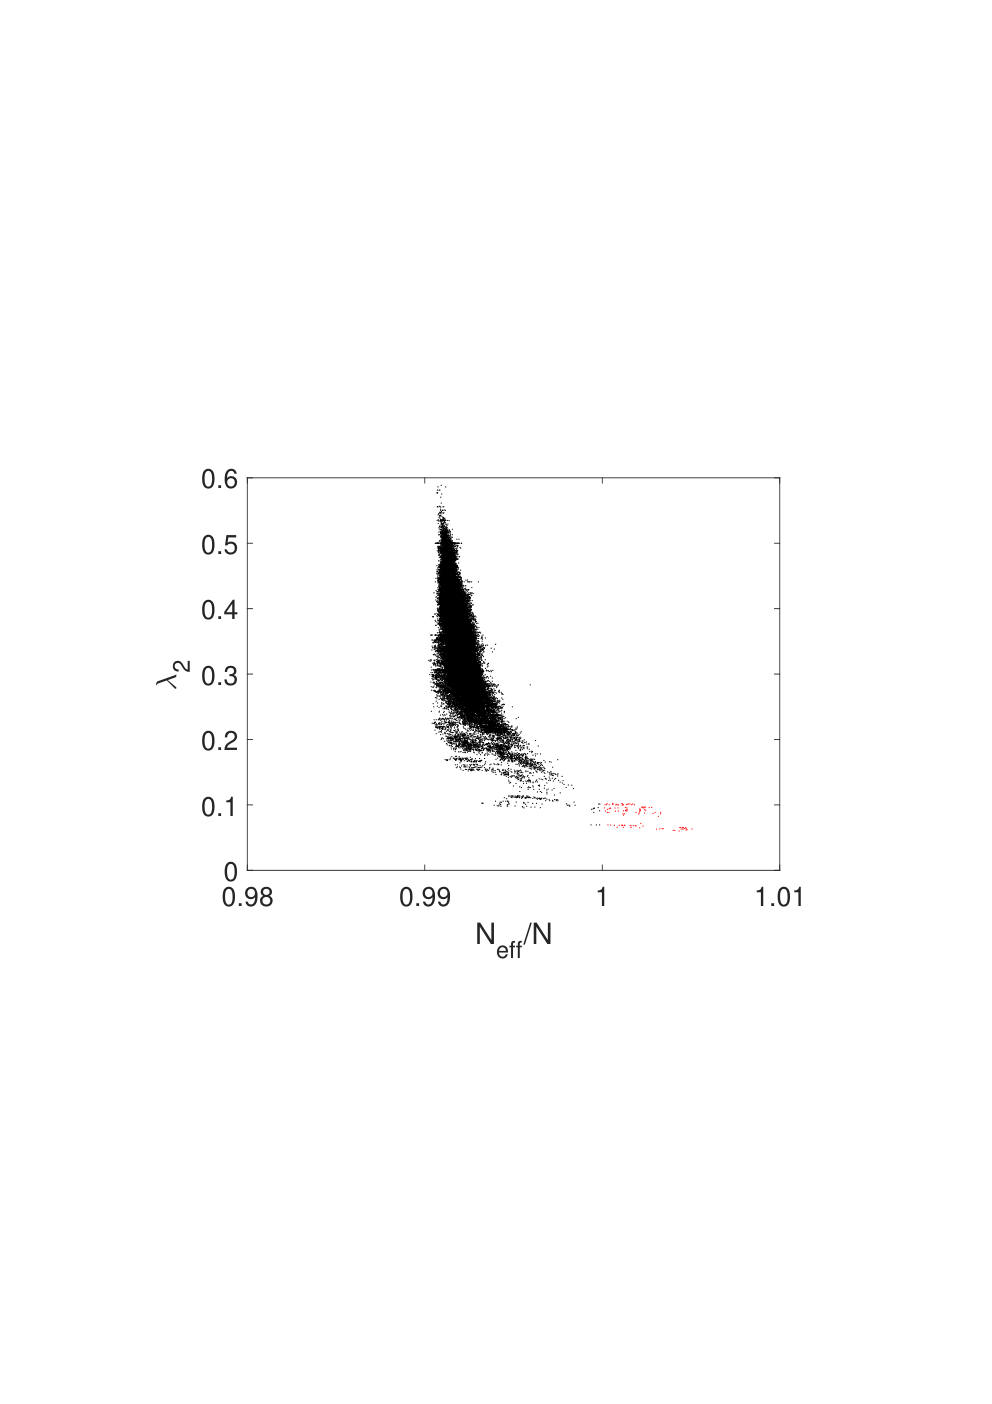
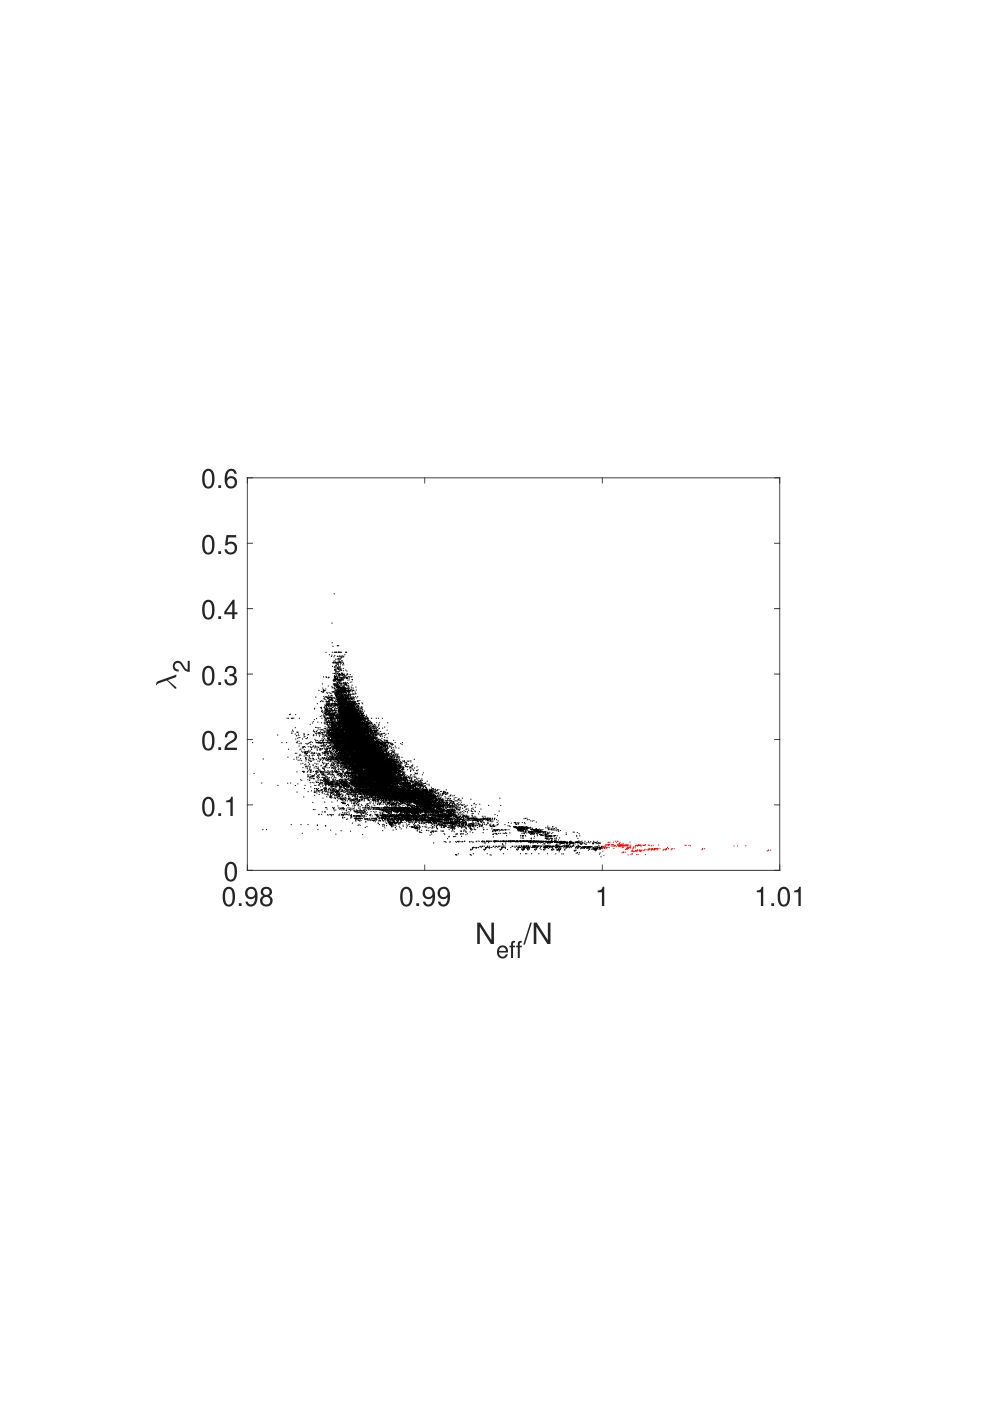
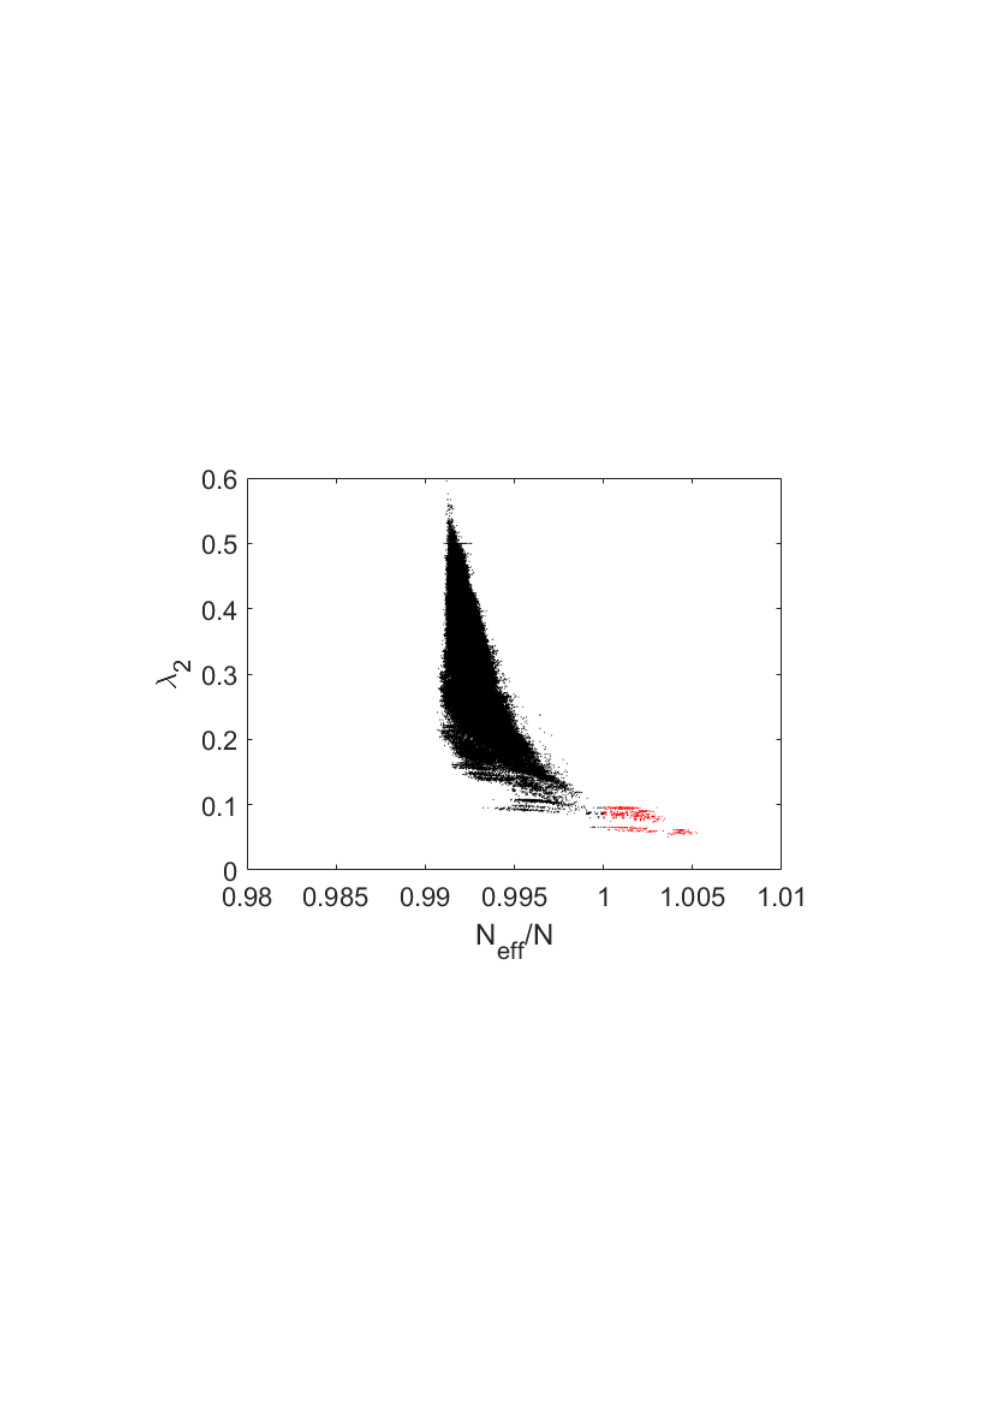
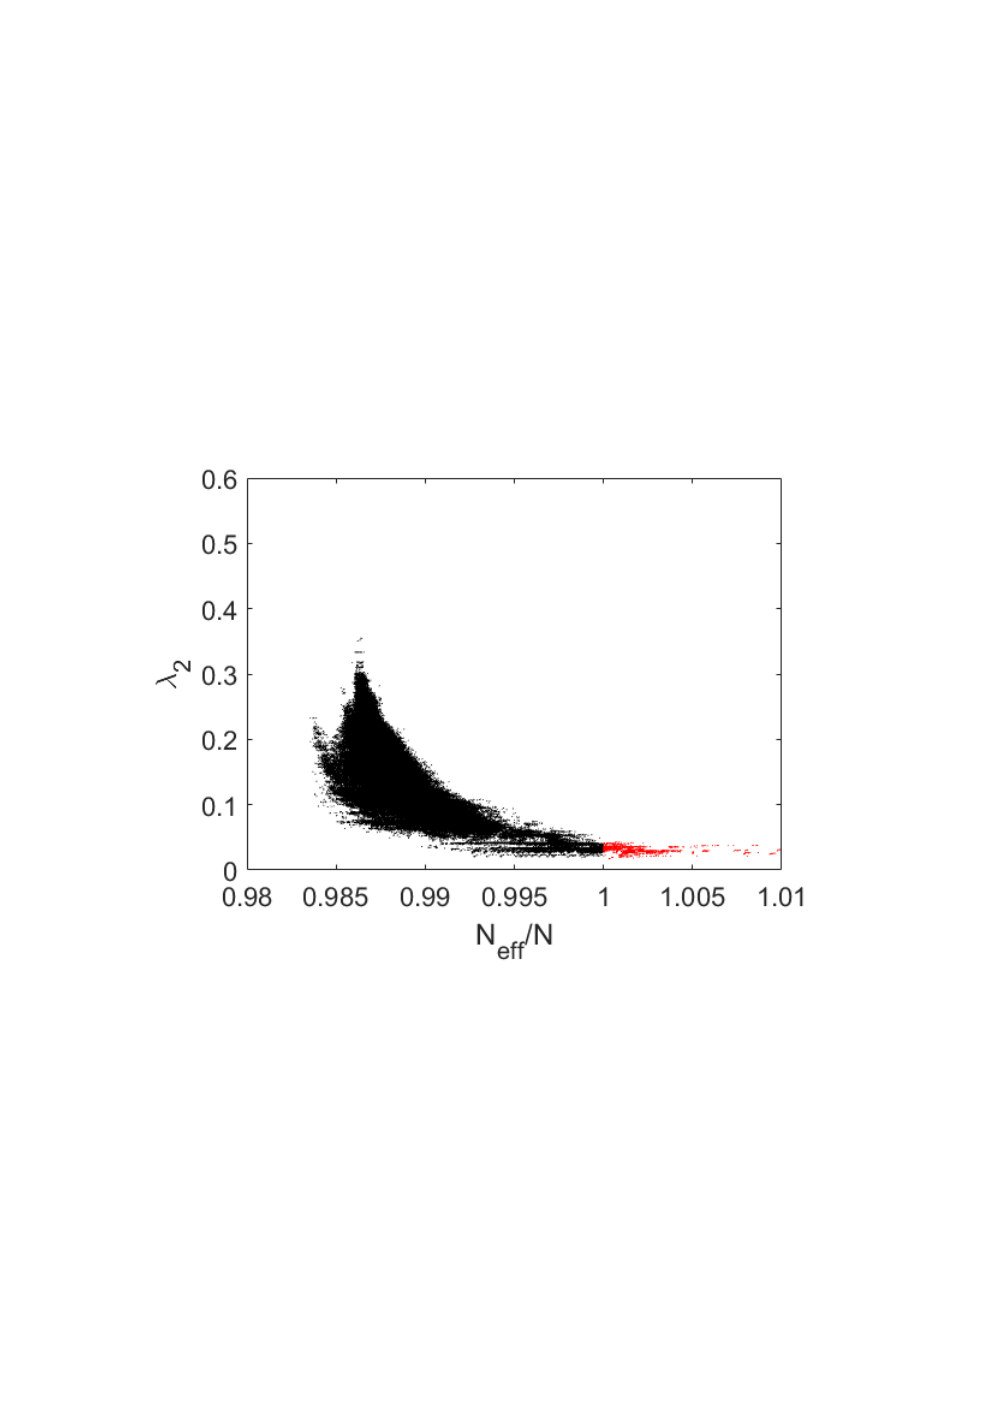
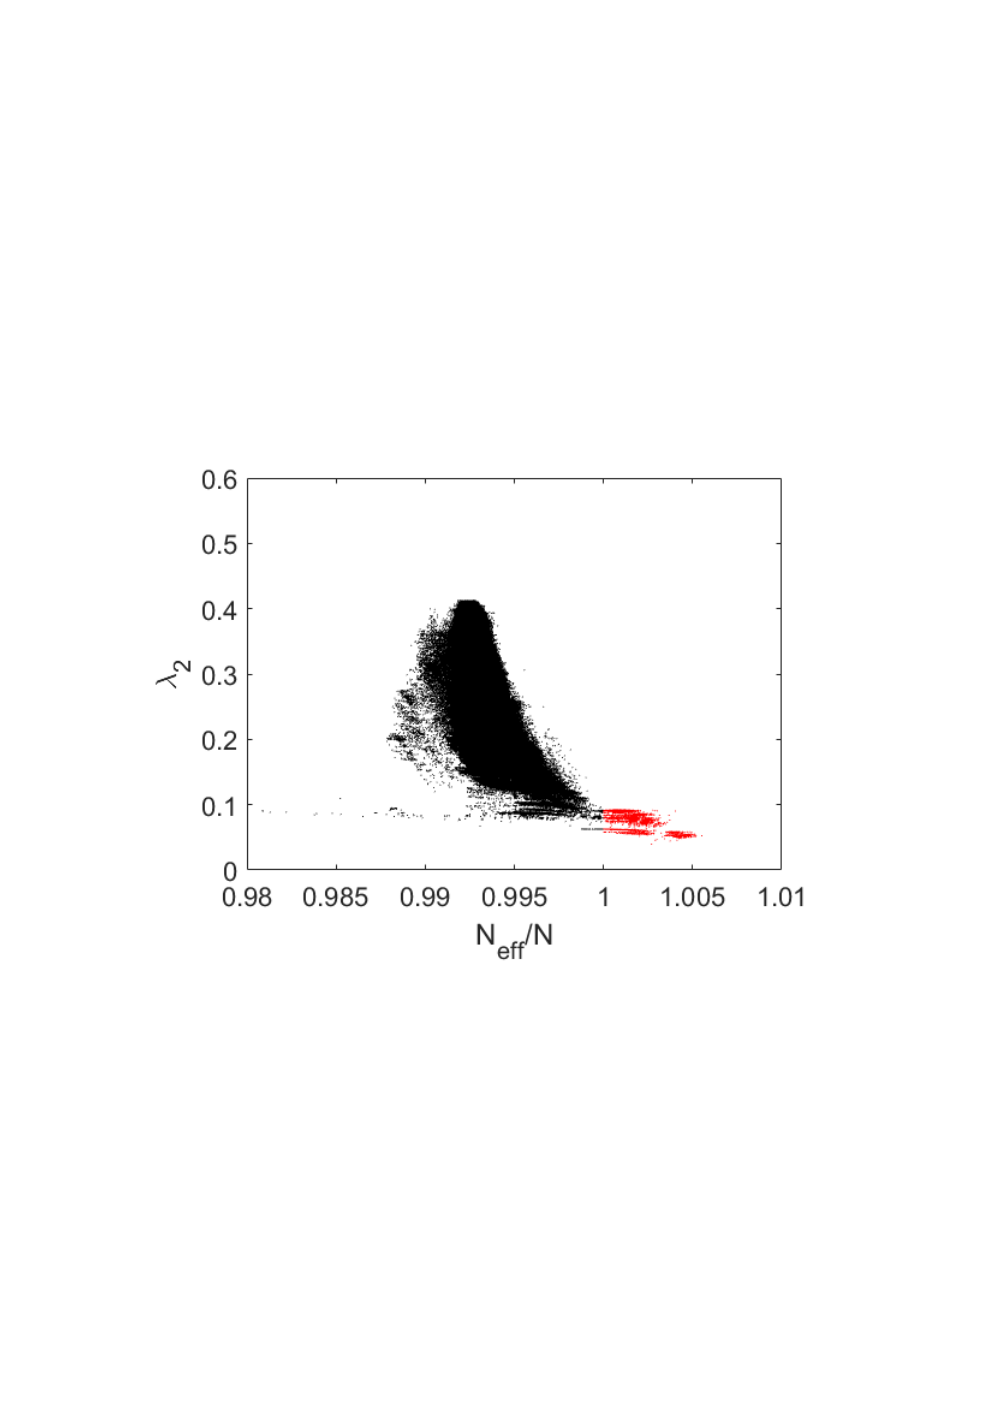
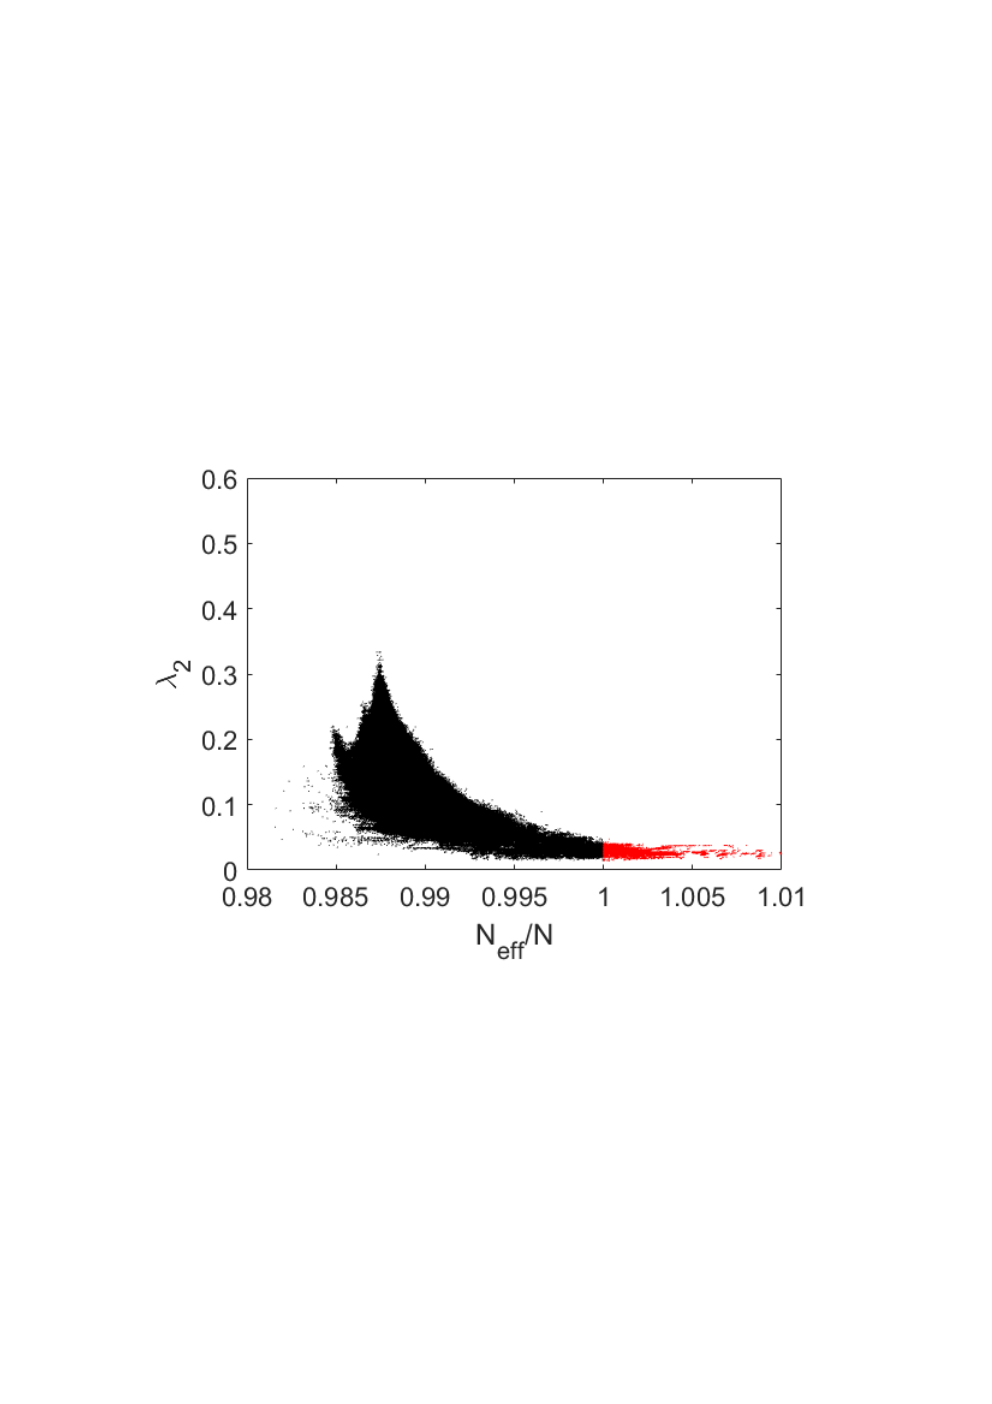
The spectral analysis presented here is based on the eigenvalues of the normalized Laplacian , which gives us the spectrum . The principal quantity for assessing structural properties of the graph is the spectral gap [27, 53, 52]. Fig. 6 gives the spectral gap over for the quartic graphs of size and the cubic graphs with as a scatter plot, for results on the remaining graphs, see Supporting Information, Fig. 10. The value of is the maximal value obtained by perturbing the regular graph by removing a single edge from the vertex with the largest remeeting time . The amplifier constructors producing are given red dots, while the remaining graphs are indicated by black dots. The main characteristics is that all amplifier constructors have small values of . Small values of imply large mixing times, bottlenecks, clusters and low conductance [11, 12, 27, 52]. Moreover, a low spectral gap indicates path-like graphs which are rather easy to divide into disjointed subgraphs by removing edges or vertices. In other words, amplifiers constructors most likely possess cut and/or hinge vertices [17, 26]. There are, however, also a multitude of graphs with low that do not produce transient amplifiers, thus a low spectral gap is necessary but not sufficient for the regular graphs under study to be amplifier constructors. It can be conjectured that this remains true for amplifiers constructors with . Furthermore, it can be noted that the spectral gap versus roughly appears as a half of a parabola with the lowest values of for and that the majority of values are concentrated for medium values of .
As it seems unlikely that a single spectral measure (or any other scalar graph measure such as average path length or clustering coefficient) can uniquely identify an amplifier constructor, we next look at the whole spectrum. Fig. 7 shows the spectral distributions for the quartic graphs of size and the cubic graphs with . The upper four panels give the discrete eigenvalue distributions of the amplifiers constructors () and for the remaining graphs with , while the lower panels show the smoothed spectral densities and according to Eq. (9). The smoothed spectral density for the remaining graphs is given in the Supporting Information, Fig. 13. In all these figures the spectral density of the amplifier constructors is shown as red line, while the black line is for the remaining graphs ().
We can now compare the results for amplifiers constructors with other regular graphs. Most noticeable it is that the spectra of amplifier constructors (upper panels of Fig. 7) differ substantially from the remaining graphs (middle panels of Fig. 7) and also from random regular graphs in general [18, 41, 14]. It is known that for the limit case of , the spectral density of random regular graphs can be described by the Kesten-McKay distribution [35, 41, 14], which for the normalized Laplacian and regular graphs is
| (13) |
with . The distribution and the spectral density obtained for the regular graphs that are no amplifier contractors have at least some similarity to the Kesten-McKay distribution, see the shape of the Kesten-McKay distribution given in the Fig. 7(c) and (d). The distribution and the spectral density obtained for amplifiers constructors do not. According to the Kesten-McKay law (13) the eigenvalue density is evenly and symmetrically distributed on the interval . For low values of we find two maxima close to the upper and lower limits of the distribution. For amplifier constructors the spectra do not conform to such a characteristics. We find two characteristic peaks, one at and another at . This can be found for all cubic and quartic regular graphs tested, see also Fig. 13. These peaks indicate a substantial multiplicity of the eigenvalues. It has been shown that multiplicity of the eigenvalues of the normalized Laplacian is connected to motif doubling and motif attachment, which can be seen as the process of building a graph from joining or repeating identical substructures [11, 12, 34]. In other words, amplifier constructors are graphs which with a high probability contain identical (or at least almost identical) subgraphs and thus exhibit a substantial degree of graph symmetry. The results for the graphs producing highest , see Fig. 11 and Fig. 12, certainly examplify this result.
As the spectral density of amplifier constructors differs from other regular graphs, we finally look at the spectral distance measure , see Eq. (10), to capture and quantify the differences in the graph structure, see Fig. 8. Here the distance measure is given for all cubic graphs with and all quartic graphs with . The distances are calculated by comparing the amplifier constructors of a given size and degree to all graph with the same size and degree. The same is done for the graphs which are no amplifier constructors. We see that amplifier constructors have much higher spectral distances, which remains largely constant for getting larger. By contrast, graphs that are no amplifier constructors have a low spectral distance, are very similar to the set of all regular graphs with given and , and the distance gets small for increasing. This can be interpreted as the increasing number of pair-wise non-isomorphic graphs for getting larger (see Tab. 2 for the values of ) means that the fraction of graphs that are structurally similar increases as well. It is also interesting to note that the spectral distances for quartic graphs are lower than for cubic graphs. A possible interpretation is that cubic regular graphs show a larger structural variety than quartic regular graphs. To conclude amplifiers constructors can be clearly distinguished from regular graphs that do not yield transient amplifiers by their spectral density profile. The distance measure can also be applied to measure the spectral distance between an amplifier constructor and the transient amplifier obtained by the perturbation methods. Additional experiments (results not given in figures due to brevity) have shown that due to the smallness of the perturbation just removing one edge, the results give no further essential information about structural properties.
Discussion
Constructing transient amplifiers
Transient amplifiers of selection are structured networks that increase the fixation probability of beneficial mutations as compared to a well-mixed population. Thus, transient amplifiers provide a mechanism for shifting the balance between natural selection and genetic drift, and therefore have considerable significance in evolutionary dynamics [7, 23, 45, 51]. Until recently, it was assumed that transient amplifiers are rare or nonexistent for death-Birth (dB) updating. In a recent work [7] first examples of transient amplifiers for dB updating were presented together with a procedure executable with polynomial time complexity to decide whether or not a given graph is an amplifier of weak selection. This procedure includes finding the vertex with the largest remeeting time and perturbing the graph by removing an edge from this vertex. There is a certain likelihood that the resulting perturbed graph is a transient amplifier. This paper extends the approach by using the perturbation method and checking all pairwise nonisomorphic cubic and quartic regular graph up to a certain size ( for cubic and for quartic graphs). The results show that a small but significant subset of all these regular graphs produce perturbed graphs that are transient amplifiers. The regular graphs that possess this property are called amplifier constructors.
Thus, a first major finding of this study is that transient amplifiers for dB updating most likely are not as rare as previously assumed. Although the percentage of amplifier constructors is low (for instance for cubic graphs of size or for cubic graphs of size ), the exponential growth with size of the number of pairwise nonisomorphic graphs ensures their number is not negligibly. The given percentages mean and amplifier constructors for the cubic and quartic graphs of size and , respectably. As for the considered sizes the exact number of all connected pairwise nonisomorphic cubic and quartic graphs is known, and all instances have been tested, the study encompasses the whole structural range of these graphs. In other words, if different graph structures constitute the space of different population structures, all possible structural variants expressible by regular graphs have been covered by this study.
The perturbation methods discussed and analyzed here only removes a single edge. Thus, the difference between the transient amplifiers produced by the perturbation method and a regular graph is small. This may also explain why the effective population size of the transient amplifiers remains close to and as a consequence also the maximal fitness for which amplification occurs is relatively close to . Possibly, a modification of the perturbation method that systematically removes a larger number of edges would also yield larger . Also, the transient amplifiers considered here are based on graphs that are not weighted. As unweighted graphs restrict the effect of substantial amplifications [45, 50], combining the perturbation method with designing weights may lead to larger values of . This may be a topic for future work.
Implications of spectral analysis
A spectral analysis revealed that the amplifier constructors share certain structural properties. The low spectral gap indicates that these graphs are path-like and can be easily divided into subgraphs by removing a low number of edges and/or vertices. From a graph-theoretical point of view, amplifier constructors most likely have cut and/or hinge vertices [17, 26]. The examples of the transient amplifiers producing the largest , see Fig. 11 and Fig. 12 in the Supporting Information, are illustrative examples for this property. For instance, the graphs producing the highest for the cubic graphs, see Fig. 11, have a triangular hub as a center, while each of the three vertices forming the triangular hub is a cut vertex.
The analysis of the spectral density of the amplifier constructors has further shown a multiplicity of the eigenvalues of the normalized Laplacian. This spectral property is connected to motif doubling and motif attachment, which can be seen as the process of building a graph from joining or repeating identical substructures [11, 12, 34]. This allows the conclusion that with a high probability amplifier constructors contain identical (or at least almost identical) subgraphs and thus exhibit a substantial degree of graph symmetry. Also this can be clearly seen in the graphs producing highest , see Fig. 11 and Fig. 12. It might be interesting to note that similar results have been reported for other biological networks, for instance metabolistic networks, transcription networks, food-webs and phylogenetic trees [10, 32, 37]. This suggests the speculation that motif doubling and motif attachment is a general property of the mechanisms in biological networks, which also manifests itself in the interplay between the graph structure and the evolutionary dynamics of mutants invading the graph. In this respect, the graph structures identified by Allen et al. [7] and denoted as fans, separated hubs and stars of islands, are also fitting these structural patterns. In each of these three structures, a hub consisting of one (the fan), two (the separated hub) or three (the star of islands) vertices is surrounded by blades which are triangles of vertices. The number of these blades may vary. Clearly, such structures can be build by motif doubling and motif attachment (the motif being the triangular blade) and with some likelihood a spectral analysis would yield similar results as the analysis given here. Similar consideration also apply to other graphs structures identified as (transient) amplifiers such as (super-) stars and comets [28, 44]
The graphs identified in this paper as amplifier constructors have, generally speaking, no expander properties. This is in contrast to the findings of a recent work which deals with evolutionary games on isothermal graphs, analyses relationships to the spectral gap of the graphs and discusses an intriguing link to expanders [6]. Although the spectral gap of the adjacency matrix was studied rather than the spectral gap of the normalized Laplacian , which is considered here, the findings relate to each other as for regular graphs , and thus the spectral gaps scale linearly to each other. The reverse is not necessarily true as all regular graphs are isothermal but not the other way around. For these evolutionary games it was shown that the prevalence of cooperative behavior is connected to the effective degree for random isothermal graphs. Moreover, it was demonstrated that there are bounds on the effective degree in terms of the spectral gap for expander graphs. In other words, expander properties might be particularly relevant for understanding cooperative behaviour on graphs. The results given in this paper do not point at expanders, which suggests some speculations. Isothermal graphs neither amplify nor suppress the effect of selection, as do regular graphs. As demonstrated here perturbed regular graphs (which can be seen as almost regular graphs as the transient amplifiers only have a single edge removed from a regular graph) do yield transient amplifiers. It might be that those “weakly” disturbed and thus “almost regular” graphs require different structural properties as random isothermal graphs which usually have a lesser degree of regularity. Also these relationships should be addressed by future work.
To summarize the transient amplifiers constructed from cubic and quartic regular graphs share certain structural properties. They are rather path-like graphs with low conductance which are relatively easy to divide into subgraphs by removing edges and/or vertices. Frequently, the subgraphs are identical (or at least very similar) and can be viewed as building blocks which are connected by cut and/or hinge vertices. This suggest the question of why and how these structural properties promote the spread of beneficial mutations. A possible explanation for this question comes from viewing these structural properties from the point of evolutionary dynamics on the graph. The dynamics of random walks on graphs with these structural properties implies large mixing times, bottlenecks and the emergence of clusters. On the other hand, it is known that clusters of mutants (or cooperators in the case of evolutionary games) promote survival and facilitate spatial invasion, as shown for lattice grids [21, 22, 31, 42], circle graphs [55] and selected regular graphs [48]. Thus, it appears plausible that for this reason the structural properties identified for amplifier constructors also promote the spread of beneficial mutations. Moreover, searching for these structural properties could also guide the design process of transient amplifiers. This may mean either to look for graphs with prescribed spectral characteristics, or to direct algorithms generating random graphs towards the relevant structural patterns. Additional work is needed to further clarify these relationships.
Acknowledgments
Supporting Information
The results of this paper are calculated and visualized with MATLAB. The adjacency matrices of the set of all amplifier constructors as well as code to produce the results are available at
https://github.com/HendrikRichterLeipzig/TransientAmplifiersRegularGraphs.
Additional graphs and a table with the numbers of simple connected pairwise nonisomorphic -regular graphs on vertices are given in the following
| 3 | 4 | 5 | 6 | |
|---|---|---|---|---|
| 11 | 0 | 265 | 0 | 266 |
| 12 | 85 | 1.544 | 7.848 | 7.849 |
| 13 | 0 | 10.778 | 0 | 367.860 |
| 14 | 509 | 88.168 | 3.459.383 | 21.609.300 |
| 15 | 0 | 805.491 | ||
| 16 | 4.060 | 8.037.418 | ||
| 18 | 41.301 | |||
| 20 | 510.489 | |||
| 22 | 7.319.447 |
(a) Complete graph (b) Cycle graph
(a) 12 4 (e) 14 3
(b) 13 4 (f) 18 3
(c) 15 4 (g) 20 3
(d) 16 4 (h) 22 3
(a) (c)
(b) (d)
(a) (c)
(b)
(a) 12 4 (e) 14 3
(b) 13 4 (f) 18 3
(c) 15 4 (g) 20 3
(d) 16 4 (h) 22 3
References
- [1] Adlam B., Chatterjee K. and Nowak M. A. 2015. Amplifiers of selection Proc. R. Soc. A.47120150114
- [2] Alcalde Cuesta F., González Sequeiros P., Lozano Rojo Á., Vigara Benito R. 2017. An accurate database of the fixation probabilities for all undirected graphs of order 10 or less. In: Rojas I., Ortuño F. (eds) Bioinformatics and Biomedical Engineering. IWBBIO 2017. LNCS 10209. pp 209-220 Springer, Cham
- [3] Alcalde Cuesta F, González Sequeiros P, Lozano Rojo Á 2018. Evolutionary regime transitions in structured populations. PLoS ONE 13(11):
- [4] Allen, B.; Nowak, M.A. 2014. Games on graphs. EMS Surv. Math. Sci. 1, 113–151.
- [5] Allen, B.; Lippner, G., Chen, Y.T., Fotouhi, B., Momeni, N., Yau, S.T., Nowak, M.A. 2017. Evolutionary dynamics on any population structure. Nature 544, 227–230.
- [6] Allen, B.; Lippner, G.; Nowak, M.A. 2019. Evolutionary games on isothermal graphs. Evolutionary games on isothermal graphs. Nature Communications 10, 5107
- [7] Allen, B.; Sample, C.; Jencks, R,; Withers, J.; Steinhagen, P.; Brizuela, L.; Kolodny, J.; Parke, D.; Lippner, G.; Dementieva, Y. A. 2020. Transient amplifiers of selection and reducers of fixation for death-Birth updating on graphs. PLoS Comput Biol 16(1): e1007529.
- [8] Arvind, V, Torán, J. 2005. Isomorphism testing: Perspectives and open problems , Bulletin of the European Association for Theoretical Computer Science, 86: 66–84.
- [9] Babai, L. 2019. Groups, graphs, algorithms: The graph isomorphism problem. In Sirakov, B., Ney de Souza, P., Viana, M. (Eds.) Proc. International Congress of Mathematicians (ICM 2018), World Scientific, Singapore, pp. 3319-3336.
- [10] Banerjee, A., Jost, J. 2007. Spectral plots and the representation and interpretation of biological data. Theory Biosci. 126, 15–21.
- [11] A Banerjee, J Jost , 2008. On the spectrum of the normalized graph Laplacian. Linear Algebra Appl. 428, 3015-3022
- [12] Banerjee, A. Jost, J. 2009. Graph spectra as a systematic tool in computational biology. Discrete Applied Mathematics 157 (10), 2425-2431
- [13] Banerjee, A. 2012. Structural distance and evolutionary relationship of networks. BioSystems 107, 186-196
- [14] Bauerschmidt, R., Huang, J., Yau, H. 2019. Local Kesten–McKay law for random regular graphs. Commun. Math. Phys. 369, 523–636.
- [15] Bayati, M., Kim, J. H., Saberi, A., 2010. A sequential algorithm for generating random graphs. Algorithmica 58, 860–910.
- [16] Broom, M., Rychtar, J. and Stadler, B. 2009. Evolutionary dynamics on small-order graphs. Journal of Interdisciplinary Mathematics, 12, 129-140.
- [17] Chang, J.M.; Hsu, C.C.; Wang, Y.L.; Ho, T.Y. 1997. Finding the set of all hinge vertices for strongly chordal graphs in linear time. Inf. Sci. 99, 173–182.
- [18] Farkas, I.J., Derényi, I. Barabási, A. L., Vicsek, T. 2001. Spectra of “real-world” graphs: Beyond the semicircle law. Phys. Rev. E 64, 026704.
- [19] Fotouhi B., Momeni N., Allen B. Nowak, M. A. 2019. Evolution of cooperation on large networks with community structure. J. R. Soc. Interface. 1620180677.
- [20] Gu, J., Jost, J., Liu, S., Stadler, P. F., 2016. Spectral classes of regular, random, and empirical graphs. Linear Algebra Appl. 489, 30–49.
- [21] Hauert, C. 2001. Fundamental clusters in spatial games. Proc. R. Soc. B 268, 761–769.
- [22] Hauert, C.; Doebeli, M. 2004. Spatial structure often inhibits the evolution of cooperation in the snowdrift game. Nature 428, 643–646.
- [23] Hindersin, L.; Traulsen, A. 2015. Most undirected random graphs are amplifiers of selection for birth-death dynamics, but suppressors of selection for death-birth dynamics. PLoS Comput Biol 11(11): e1004437.
- [24] Hindersin, L.; Möller, M.; Traulsen, A.; Bauer, B. 2016. Exact numerical calculation of fixation probability and time on graphs. BioSystems 150, 87–91.
- [25] Hindersin, L., Wu, B., Traulsen, A., Garcia, J. 2019. Computation and simulation of evolutionary game dynamics in finite populations. Sci Rep 9, 6946.
- [26] Ho, T.Y.; Wang, Y.L.; Juan, M.T. 1996. A linear time algorithm for finding all hinge vertices of a permutation graph. Inf. Process. Lett. 59, 103–107.
- [27] Hoffman, C., Kahle, M. Paquette, E. 2019. Spectral gaps of random graphs and applications. International Mathematics Research Notices, rnz077, 1-52
- [28] Jamieson-Lane, A., Hauert, C. 2015. Fixation probabilities on superstars, revisited and revised. J. Theor. Biol. 382, 44–56.
- [29] Kaveh K., Komarova N. L., Kohandel M. 2015. The duality of spatialdeath–birth and birth–death processes andlimitations of the isothermal theorem. R. Soc. Open Sci.2: 140465
- [30] Klein-Hennig, H. and Hartmann, A. K. 2012. Bias in generation of random graphs Phys. Rev. E 85, 02610.
- [31] Langer, P.; Nowak, M.A.; Hauert, C. 2008. Spatial invasion of cooperation. J. Theor. Biol. 250, 634–641.
- [32] Lewitus, E. Morlon, H. 2016. Characterizing and comparing phylogenies from their Laplacian spectrum, Systematic Biology 65, 495–507.
- [33] Lieberman, E.; Hauert, C.; Nowak, M.A. 2005. Evolutionary dynamics on graphs. Nature 433, 312–316.
- [34] Mehatari, R., Banerjee, A. 2015. Effect on normalized graph Laplacian spectrum by motif attachment and duplication. Applied Math. Comput., 261 382-387.
- [35] . McKay, B. D., 1981. The expected eigenvalue distribution of a large regular graph. Linear Algebra Appl., 40, 203–216.
- [36] Meringer, M. 1999. Fast generation of regular graphs and construction of cages. J. Graph Theory 30, 137–146.
- [37] Milo R., Shen-Orr S., Itzkovitz S., Kashtan N., Chklovskii D., Alon U. 2002. Network Motifs: simple building blocks of complex networks. Science 298(5594), 824–827
- [38] Monk, T. 2018. Martingales and the fixation probability of high-dimensional evolutionary graphs. J. Theor. Biol. 451, 10–18 .
- [39] Möller, M.; Hindersin, L.; Traulsen, A. 2019. Exploring and mapping the universe of evolutionary graphs identifies structural properties affecting fixation probability and time. Commun. Biol. 2, 137.
- [40] Ohtsuki, H.; Pacheco, J.M. 2007. Nowak, M.A. 2007. Evolutionary graph theory: Breaking the symmetry between interaction and replacement. J. Theor. Biol. 246, 681–694.
- [41] Oren, I., Godel, A., Smilansky, U. 2009. Trace formulae and spectral statistics for discrete Laplacians on regular graphs (I) J. Phys. A: Math. Theor.42 415101
- [42] Page, K.M.; Nowak, M.A., Sigmund, K. 2000. The spatial ultimatum game. Proc. R. Soc. B 267, 2177–2182.
- [43] Pattni, K.; Broom, M.; Silvers, L.; Rychtar, J. 2015. Evolutionary graph theory revisited: When is an evolutionary process equivalent to the Moran process? Proc. R. Soc. A 471, 20150334.
- [44] Pavlogiannis, A.; Tkadlec, J.; Chatterjee, K.; Nowak, M.A. 2017. Amplification on undirected population structures: comets beat stars. Scientific Reports 7 (1), 1-8
- [45] Pavlogiannis, A.; Tkadlec, J.; Chatterjee, K.; Nowak, M.A. 2018. Construction of arbitrarily strong amplifiers of natural selection using evolutionary graph theory. Commun. Biol. 1, 71.
- [46] Richter, H., 2017. Dynamic landscape models of coevolutionary games. BioSystems, 153–154, 26–44.
- [47] Richter, H. 2019. Properties of network structures, structure coefficients, and benefit–to–cost ratios. BioSystems 180, 88–100.
- [48] Richter, H. 2019. Fixation properties of multiple cooperator configurations on regular graphs. Theory Biosci. 138, 261–275.
- [49] Richter, H. 2020. Evolution of cooperation for multiple mutant configurations on all regular graphs with players. Games 2020, 11(1), 12
- [50] Tkadlec, J.; Pavlogiannis, A.; Chatterjee, K.; Nowak, M.A. 2019. Population structure determines the tradeoff between fixation probability and fixation time. Commun. Biol. 2, 138.
- [51] Tkadlec, J.; Pavlogiannis, A.; Chatterjee, K.; Nowak, M.A. 2020. Limits on amplifiers of natural selection under death-Birth updating. PLoS Comput Biol 16(1): e1007494.
- [52] Wills P., Meyer F.G., 2020. Metrics for graph comparison: A practitioner’s guide. PLoS ONE 15(2): e0228728.
- [53] Wilson R. C., Zhu P. 2008. A study of graph spectra for comparing graphs and trees. Pattern Recognition. 41(9), 2833–2841.
- [54] Wormald, N. C. 1999. Models of random regular graphs. In: Lamb, J.D., Preece, D.A. (Eds.), Surveys in Combinatorics, London Mathematical Society Lecture Note Series, vol. 267, Cambridge University Press, Cambridge, pp. 239–298.
- [55] Xiao, Y, Wu, B. 2019. Close spatial arrangement of mutants favors and disfavors fixation. PLoS Comput. Biol. 15, e1007212.