Identification of low energy nuclear recoils in a gas TPC with optical readout
Abstract
The search for a novel technology, able to detect and reconstruct nuclear recoil events in the keV energy range, has become more and more important now that vast regions of high mass WIMP-like Dark Matter candidate have been excluded. Gaseous Time Projection Chambers (TPC) with optical readout are very promising candidates combining the complete event information provided by the TPC technique with the high sensitivity and granularity of latest generation light sensors. A TPC with an amplification at the anode, obtained with Gas Electron Multipliers (GEM), was tested at the Laboratori Nazionali di Frascati. Photons and neutrons from radioactive sources were employed to induce recoiling nuclei and electrons with kinetic energy in the range 1–100 keV. A He-CF4 (60/40) gas mixture was used at atmospheric pressure and the light produced during the multiplication in the GEM channels was acquired by a high position resolution and low noise CMOS camera and a photomultiplier. A multi-stage pattern recognition algorithm based on an advanced clustering technique is presented here. A number of cluster shape observables are used to identify nuclear recoils induced by neutrons originated from a AmBe source against X-ray photo-electrons. An efficiency of 18% to detect nuclear recoils with an energy of about 6 keV is reached, while suppressing 96% of the photoelectrons, making this optically read out gas TPC a very promising candidate for future investigations of ultra-rare events as directional direct Dark Matter searches.
24 July 2020
1 Introduction
The advent of a market of single-photon light sensors with high position resolution can open a new opportunity to investigate ultra-low rate phenomena as Dark Matter (DM) particle scattering on nuclei in a gaseous target.
The nature of DM is still one of the key issues to understand our Universe [1, 2]. Different models predict the existence of neutral particles with a mass of few GeV or higher that would fill our Galaxy [3, 4, 5, 6]. They could interact with the nuclei present in ordinary matter producing highly ionizing nuclear recoils but with a kinetic energy as small as few keV. Moreover, given the motion of the Sun in the Milky Way towards the Cygnus constellation, such nuclear recoils would exhibit in galactic coordinates a dipole angular distribution in a terrestrial detector [7]. In this paper the use of a current generation CMOS camera providing very low noise level together with a large granularity (often indicated as scientific CMOS or sCMOS) to capture the light emitted by Gas Electron Multipliers (GEMs) in a Time Projection Chamber (TPC) device is described. The GEMs are located in the TPC gas volume at the anode position and are used to amplify the ionization produced in the gas by the nuclear recoils and other particles. A secondary scintillation light is produced in the amplification of the avalanche process by the GEM. This light and its spatial distribution are reconstructed in the detector and characterized by means of a clustering algorithm.
Different type of particles will produce distinctive and diverse patterns of ionization charge, and therefore of light emitted by the GEMs, given the different way they deposit energy and interact with matter. Therefore, nuclear recoils can be efficiently identified and separated from different kinds of background down to a few keV kinetic energy. The study of the optical readout of a TPC has been recently conducted with several small size prototypes (NITEC [8], ORANGE [9, 10], Lemon [11, 12, 13]) with various particle sources, in the context of the Cygno project [14, 15], as well as for other experiments, as ARIADNE [16]. In the following, the study of nuclear recoils excited by neutrons from an AmBe source and electron recoils from a source in the gas volume of the Lemon prototype is presented.
2 Experimental layout
A 7 liter active sensitive volume TPC (named Lemon) was employed to detect the particle recoils. A sketch (not to scale) of the detector setup is shown in Fig. 1 (left), while an image of the detector in the experimental area is shown in Fig. 1 (right).


The sensitive volume, where the ionization electrons are drifting, features a 200240 mm2 elliptical field cage with a 200 mm distance between the anode and the cathode. The anode side is instrumented with a mm2 rectangular triple GEM structure. Standard LHCb-like GEMs (70 m diameter holes and 140 m pitch) [17] were used with two 2 mm wide transfer gaps between them. The light emitted from the GEMs is detected with an ORCA-Flash 4.0 camera [18] through a mm3 transparent window and a bellows of adjustable length. This camera is positioned at a 52 cm distance from the outermost GEM layer and is based on a sCMOS sensor with high granularity ( pixels), very low noise (around two photons per pixel), high sensitivity (70% quantum efficiency at 600 nm) and good linearity [19]. This camera is instrumented with a Schneider lens, characterized by an aperture f/0.95 and a focal length of 25 mm. The lens is placed at a distance cm from the last GEM in order to obtain a de-magnification to image a surface cm2 onto the cm2 sensor. In this configuration, each pixel is therefore imaging an effective area of m2 of the GEM layer. The fraction of the light collected by the lens is evaluated to be [19]. A semi-transparent mesh was used as a cathode in order to collect light on that side also with a mm2 HZC Photonics XP3392 photomultiplier [20] (PMT) detecting light through a transparent mm3 fused silica window. More details on the Lemon detector can be found in Ref. [21].
A 5 cm thick lead shielding was mounted around the Lemon field cage to reduce the environmental natural radioactivity background. From the measurements of the GEM current with and without the lead shielding, a factor two reduction in the total ionization within the sensitive volume, very likely due to environmental radioactivity, was estimated.
3 Particle images in the Lemon gas volume
The Lemon detector was operated in an overground location at Laboratori Nazionali di Frascati (LNF) with a He-CF4 (60/40) gas mixture at atmospheric pressure. The triple GEM system was operated with a voltage across each GEM sides of 460 V and with a transfer field between the GEM layers of 2.5 kV/cm. A CAEN SY1527 high-voltage module with six independent channels ensured an adequate voltage stability, and monitored the bias currents with a precision of 20 nA. The gas mixture was kept under a continuous flow of about 200 cc/min and with the GEMs operated at a electric gain. The typical photon yield for this type of gas mixtures has been measured to be around 0.07 photons per avalanche electron[19, 22, 23], and therefore the overall light gain is about . The field cage was powered by a CAEN N1570 [24], generating an electric field of 0.5 kV/cm.
The motion of particles within the gas mixtures was studied by means of different simulation tools. In particular, the Garfield [25, 26] program was used to evaluate the transport properties for ionization electrons in the sensitive volume for an electric field of 0.5 kV/cm.
Given the diffusion in the gas, ionization electrons produced at a distance from the GEM will distribute over a region on the GEM surface with a Gaussian transverse profile having :
| (1) |
where is the transverse diffusion coefficient, whose value at room temperature 140 was obtained with this simulation. The value of was measured to be about 300 m [27, 28]. Therefore, in average, a point-like ionization will result in a spot of 3–4 mm2.
The expected effective ranges of electron and nuclear recoils were evaluated respectively with Geant4 [29] and with Srim [30] simulation programs. The recoil range estimated from simulation, as a function of the impinging particle kinetic energy, is shown in Fig. 2 for electrons and -as an example- for He-nuclei.
These results show that:
- •
He-nuclei recoils have a sub-millimeter range up to energies of 100 keV and are thus expected to produce bright spots with sizes mainly dominated by diffusion;
- •
low energy (less than 10 keV) electron recoils are in general longer than He-nucleus recoils with same energy and are expected to produce sparse and less intense spot-like signals. For a kinetic energy of 10 keV, the electron range becomes longer than 1 mm and for few tens of keV, tracks of few cm are expected.
The images collected by the sCMOS camera contain several instances of the particles tracks described above. The sCMOS sensor was operated in continuous mode with a global exposure time of 30 ms. Example images are shown in Fig. 3.


The PMT waveform was sent to a digitizer board with a sampling frequency of 4 GS/s. The trigger scheme of the detector is based on the PMT signal: if, during the exposure time window, the PMT waveform exhibits a peak exceeding a threshold of 80 mV, it is acquired in a time window of 25 s and the corresponding sCMOS image is stored. The digitizer is operated in single-event mode. No more than one 25 s long PMT waveform is recorded in each sCMOS exposure time, even if during the sCMOS exposure time several PMT signals are produced. Therefore, the PMT information was mainly exploited only to select frames with a cosmic-ray track.
Several light spots are visible with different ionization patterns due to different types of particles interacting in the gas. Figure 3 (left) shows an image with typical long tracks from cosmic rays traveling through the full gas volume, where clusters of light with larger energy deposition are clearly visible, superimposed to low energy electrons, very likely due to natural radioactivity. Figure 3 (right) shows an example of a cleaner event with two straight cosmic ray tracks, that can be used for energy calibration purposes, since the energy releases along the path, , can be predicted given the gas mixture and pressure.
Two different artificial radioactive sources were employed for testing and studying the detector responses.
A neutron source, based on a MBq activity 241Am source contained in a Beryllium capsule (AmBe) was placed at a distance of 50 cm from the sensitive volume side. Because of the interactions between particles produced by the 241Am and the Beryllium nuclei, the AmBe source isotropically emits:
- •
photons with an energy of 59 keV produced by 241Am;
- •
neutrons with a kinetic energy mainly in a range 1–10 MeV
- •
photons with an energy of 4.4 MeV produced along with neutrons in the interaction between and Be nucleus.
The presence of a lead shield around the sensitive volume absorbed almost completely the 59 keV photon component. A small faction of it reached the gas through small gaps accidentally present between the lead bricks.
A source emitting X-rays with a main energy peak at 5.9 keV. This is the standard candle for calibration and performance evaluation of Lemon, and its extensive use is documented in Ref. [31].
Four different sets of runs have been recorded: (i) without any source and no electric signal amplification in the GEMs, to study the sensor electronic noise; (ii) without any source, but the detector fully active, to study the ambient background, mainly muons from cosmic rays and natural radioactivity; runs with either the (iii) source, to study the detector response to a known signal or with the AmBe source, to study the Lemon performances in presence of nuclear recoils.
Figure 4 shows images recorded with the same 30 ms exposure time, in presence of one of the two sources. The left panel shows an example of several light spots, characteristic of energy deposits due to low energy photons. The right panel shows a frame recorded in presence of the AmBe radioactive source: the short and bright track well visible in the center is very likely due to an energetic nuclear recoil induced by a neutron scattering.


4 Cluster reconstruction algorithm
The light produced in the multiplication process through the GEMs and detected by the sCMOS sensor is associated in clusters of neighboring pixels. This is achieved by following the trail of energy deposition of the particle traveling through the gas of the sensitive volume. The energy released as ionization electrons is estimated by the amount of the light collected by the sensor. In the range from few keV to tens of keV for stopped electrons, the deposited energy is equivalent to their total kinetic energy, while for stopped nuclei it represent only a fraction of their initial kinetic energy. Therefore, it is of primary importance to have a reconstruction algorithm that includes all the camera pixels hit by the real photons originating from the energy deposits, while rejecting most of the electronic noise from the camera sensor. Noise can either create fake clusters or, more likely, add pixels in the periphery of clusters originated by real photons, thus biasing the energy estimate. Possible additional noise, arising for example from GEM stages, was already demonstrated be negligible [31].
The energy reconstruction follows a three-steps procedure: the single-pixel noise suppression is briefly described in Section 4.1. This is followed by the proper clustering: first the algorithm to form basic clusters from single small deposits is described in Section 4.2, then the supercluster method, aiming to follow the full particle track, and seeded by the basic clusters found in the previous step, is described in Section 4.3.
The results of this paper are based on the properties of the reconstructed superclusters and are described in Section 5.
4.1 Sensor noise suppression
The electronic noise of the sensor was estimated in data-taking runs acquired with the sensor in complete dark, obtained by covering the camera lens with its own cap or, equivalently, lowering the voltage across the GEM electrodes to 300 V (pedestal runs). The latter option, which was demostrated to be fully equivalent to the former, is a valuable method to measure the sensor noise periodically, and track its evolution, during the periods without data taking of the Cygno experiment.
For each pixel, the pedestal was computed as the average of the counts over many frames, while the electronic noise was estimated as their standard deviation (SD). The distribution of the pixels SD is shown in Fig. 5. The mode of this distribution is about 1.8 photons per pixel, but a tail is present, with pixels having a noise of more than 5 photons per pixel. For such pixels, a very non-Gaussian distribution was observed, while for the pixels in the bulk of the distribution, the pedestal distribution followed a Gaussian shape. To form the pedestal-subtracted image, the pedestal mean was subtracted to the image for each pixel, to account for the non-uniformity of the pedestal mean across the sensor. An initial noise suppression was applied by neglecting the pixels with counts less than .
On such pedestal-subtracted zero-suppressed images an upper threshold was applied to reject hot pixels, which are more likely due to sensor instabilities than to a real energy release. They are found to be not malfunctioning pixels since this behavior disappears after a power cycle of the camera and their response to light becomes homogeneous to the neighbors: therefore a dynamic (run-by-run) suppression is needed. They are efficiently identified as high-intensity, isolated pixels, and distinguished by a true energy deposit, for which each pixel is surrounded by some other active pixels. A threshold is applied on the ratio between the pixel and the average of the counts in a pixels matrix surrounding it, and a minimum number of two pixels above noise in that matrix is required to discriminate good pixels from hot ones. Only good pixels are retained for the subsequent clustering.
The resolution of the resulting image is initially reduced by forming macro-pixels, by averaging the counts in pixel matrices. This is needed to reduce the combinatorics of the subsequent clustering algorithm, in order to be executed in a reasonable time for each image. On such pixel map, a median filter [32] is applied, which is effective in suppressing the electronics noise fluctuations in a pixel matrix and it is computationally efficient, as described in more details in Ref. [33]. The output image is passed to the basic clustering algorithm, described in the following.
4.2 Basic cluster reconstruction
The basic clustering algorithm, called Idbscan and described in details in Ref. [34], represents an improvement of the neighboring pixels clusters, called Nnc, previously used to study the performance of the Lemon detector with radioactive source [31]. It is briefly described also here, since it represents the seeding for the final clustering algorithm.
The energy deposition in the sensitive volume of the TPC is estimated from the two-dimensional (2D) projection on the – axes of the light emitted in the multiplication process within the GEMs planes. The pattern shows a large variation, depending on the interacting particle. For images recorded with the calibration source, the signature of the typical 5.9 keV photons is a spot of few mm2, with the exact size depending on the diffusion in the gas, i.e., on the distance from the anode, along , of the point where the energy release happens (see Fig. 4 left). Muons from cosmic rays travel across the gas volume and leave a typical signature of a straight track, shown in Fig. 3 (right), but with several agglomeration with larger density along the path. Natural radioactivity shows an irregular pattern, sometimes curly, with several kinks along the path. Finally, the signal from nuclear recoils due to neutrons, originated by the AmBe source, is expected to be spot-like, or to emerge as short straight tracks with a length smaller than 1 mm for energies below 100 keV, as shown by Fig. 2.
Their track length and their size is found to depend a lot on the initial energy of the impinging neutron, and also on the mass of the recoiling nucleus in the He-CF4 gas mixture utilized in the Lemon detector.
Thus, the clustering algorithm needs to be flexible enough to efficiently reconstruct a diverse set of patterns, from small round spots to long and kinky tracks. A first step of the clustering, called seeding, is used: it focuses in the clustering of spot-like neighboring pixels. The method applied for the Lemon detector is an evolution of the classic dbscan algorithm [35]. This is a non-parametric, density-based clustering, which groups together pixels above threshold with many neighbors, within a circle with a radius . Its distinctive characteristics making this method very suitable to the Lemon case is its ability to label as outliers, and so not to include in the clusters, pixels that lie isolated in low-density regions, i.e., pixels from electronic noise of the sensor surviving the zero suppression. The extension of dbscan used for Lemon data analysis consists in including a third dimension to the phase space of the points considered, adding to the pixel position (– coordinates) the measured number of photons in that pixel, . This approach improves the combinatorial background rejection and the energy resolution with respect the previously used Nnc algorithm, as described in details in Ref. [34].
To be as inclusive as possible, and since different interactions may have vastly different intensities, even varying along the track, the clustering procedure is iterated three times. First, the dbscan parameters were tuned to form clusters of dense (in – dimension) and intense (in the dimension) pixels. The density in 3D is called sparsity. This step typically identifies either rare hot spots of the GEMs, or, efficiently, short nuclear recoils. The pixels belonging to the reconstructed clusters are then removed from the image, and the dbscan procedure is repeated, with looser sparsity parameters. The second iteration is tuned to efficiently reconstruct round spots and slices of tracks from nuclear recoils with lower intensity. It also collects the agglomeration with larger density along cosmic tracks, clearly visible in the example in Fig. 3 (right). A third iteration of dbscan with even looser parameters is finally executed, targeting faint portions of a cluster. These are especially used as a proxy for the characterization of clustered noisy pixels, while the first two are used as seeds for the final clustering step, described in Sec. 4.3.
To be computationally viable, the Idbscan basic clustering is performed on the image with reduced resolution, 512512. In typical images this allows the basic cluster reconstruction to be run in approximately 1 s on an Intel Xeon E5-2620 2.00 GHz and 64 GB RAM. The reconstruction algorithm is implemented in Python3 [36], and interfaced with CERN Root v6 [37].
Examples of clustered pixels in two cases are shown in Fig. 6. The left panel shows an example of clusters reconstructed on the low-resolution image of one event with source. Three spots are clearly visible: one, as typical for events with this calibration source with a moderate activity, is reconstructed by a single cluster of the second iteration. The other two are close enough that are merged in a single cluster of the same iteration. The cases of merged spots containing twice the energy of a single X-ray deposit, given the activity of the source, represent about one tenth of the clusters in this set of runs. The energy resolution is good enough to distinguish statistically the single and merged spots, as will be described in Sec. 4.4. The optimization of the Idbscan parameters is done assuming a low pileup of events, typical of the running conditions for a future underground run of the Cygno project, of which Lemon is the prototype, where the occurrences of such cases are expected to be negligible.
The right panel shows the outcome of the Idbscan algorithm on a longer track, presumably from natural radioactivity, and one possible short nuclear recoil. The nuclear recoil candidate is very dense, highly-energetic, and isolated. Therefore, it is reconstructed as a single cluster in the first iteration. The long track shows several clusters with higher intensity. One of them has a large energy, and it is reconstructed as an isolated single iteration-1 cluster. The rest of the track is reconstructed by multiple iteration-2 clusters, which are split where the energy deposition has a minimum extending across too many pixels to be joined together in the same cluster. Events like these, which are frequent for muons, natural radioactivity, but also signals from -particles with higher energy, originating by the possible interaction of neutrons with the plastic material of the field cage, justify the need of the subsequent step of the superclustering, which follows the track without splitting it in parts. This is described in the following section.


4.3 Supercluster reconstruction
The aim of the superclustering procedure is to collect the majority of the pixels belonging to a track which is long and can be split in multiple parts in the clustering step described before. Indeed, the main limitation of Idbscan to follow a long track is mainly originated by the non uniform energy release along the path length. As can be clearly seen in Fig. 6 (right), or even in the example of a raw image of an event with two long cosmic rays in Fig. 3 (right), clusters with larger energy release are followed by regions along the path with a lower or even a zero release. These local minima are sometimes as large, in the 2D space, as the typical size of the parameter of dbscan [35]. Despite the low electronic noise of the ORCA-Flash 4.0 camera sensor, the energy releases in these local minima are similar in magnitude to the average single-pixel noise.
The Idbscan is limited in connecting the full length of an extended path, because of two reasons. First, inflating parameter as much as needed to cover the areas of local minima conflicts with the need to reject noise around the cluster. The basic cluster parameters were optimized for the Lemon running conditions to collect most of the signals with an energy as low as few keVs and to reject the typical noise of photon per pixel. This avoids collecting extra noise in the cluster, biasing the energy scale and worsening its resolution, and keeps the rate of fake clusters at a negligible level [34]. Second, the iterative nature of the algorithm, with different parameters for each iteration, each tuned for very different intensity, makes it convenient and efficient for a deposition of a fixed energy density (like the spots originating from the source), but not for the cases as in Fig. 6 (right), where the same track is split in several parts, some of them belonging to different iterations. This requires a method that can continuously follow the pattern of the track, profiting of the full resolution image, where the gradients of the energy deposition along the track trajectory are smaller than the ones in the transverse direction, but still give information on the energy release pattern. Several existing algorithms were tested to profit of this, but executing any of them on the full image is not manageable CPU-wise, due to the huge pixel combinatorics.
Therefore, the procedure adopted for the final supercluster reconstruction in the Lemon detector starts from defining the interesting regions in the image that may contain pixels from an energy deposit. These are identified by the basic cluster algorithm Idbscan previously described, which is applied on the reduced-resolution image. In order to gather the peripheral pixels, especially along the track trajectory where breaks into small basic clusters may have happened, a window of pixels is considered, around each pixel belonging to a macro-pixel clustered in a basic cluster. A full resolution image formed only by the interesting pixels passing the simple initial filtering described in Sec. 4.1 is created. The gradients of the intensity in such image are computed pixel-by-pixel to look for the edge region where the image turns from signal to noise-only:
| (2) |
while the gradient direction is given by:
| (3) |
In order to reduce the effect of the noise, which induces fluctuations in the first derivatives of Eq. 2, a Gaussian filter is applied, which smoothen the response by convolving the pixel intensity with a Gaussian function, having as the SD of the intensities of all the pixels considered, and rejecting the ones falling outside a 5 window.
The superclustering algorithm, applied on the filtered image, is an application of the morphological geodesic active contours[38, 39], called Gac in the following. This method uses an active contour finding, widely used in computer vision, where the boundary curve of an object is detected by minimizing the energy associated to :
| (4) |
where is the arc-length parameterization of the curve in the 2D space, and is the stopping edge function, which allows to select the boundary of the cluster. In the Gac method used for the Lemon images, the function is purely geometrical, and uses the geodesics of the image, i.e., the local minimal distance path joining points with the same light intensity gradient. The function is given by:
| (5) |
which is minimal in the edges of the image. The is the aforementioned Gaussian filter, and the parameter , which regulates the strength of the filter, was tuned on typical Lemon images to be .
This method was chosen because it allows to follow patterns that may vary from convex to concave shape, eventually with kinks, e.g. in cases of -ray emissions. To improve the shrinking of the cluster boundary in the cases of tracks turning from concave to convex along their trail, the balloon force [39], which is a term added to Eq. 4 to smooth the cluster contour, is set to -1, in order to push the contour towards a border in the areas where the gradient is too small. A number of 300 iterations is used to evolve the supercluster contour.
The example track shown in Fig. 6 (right) after the basic clustering step, is shown again in full resolution, zoomed around the cluster, in Fig. 7 (left). The output of the superclustering with the Gac algorithm is shown on the right panel of the same figure. The splitting of the cluster, happening at the basic clusters step, is recovered: the portions with high and low density along the path of the energy release are joined together. Other three examples of superclustered images are shown in Fig. 8, in runs without any artificial radioactive source. The top left panel shows an example of a cosmic ray track fully reconstructed by the Gac superclustering, which also includes a -ray in the middle of the track length. The top right panel shows an example of curly track from a candidate of natural radioactivity interaction; bottom panel shows an example where both a cosmic ray and a curly track are present. In this case, the extremes of the long and straight track are still split, but this is much rarer than after the basic clustering, and it happens when the local minima along the trajectories are compatible with noise-only for more than 1 cm.


4.4 Energy scale calibration using source
The containment of the energy in the supercluster was verified with simulations of nuclear and electron recoils within the gas mixture of the Lemon detector, performed with Srim [30]. For both types of recoils, for the energy range of interest for DM search, i.e., keV, when considering deposits without electronics noise and no diffusion in the gas, the peak of the distribution is within 5%. Adding a noise approximated as a Gaussian function with a mean and a SD equal to the ones observed in the pedestal runs, and a diffusion following the parameterization in Eq. 1, the fraction of the true energy contained in the supercluster decreases to about 80%. The decrease in the energy containment in the supercluster is due to the smearing of the 2D track pattern around the periphery of the cluster, mostly due to the diffusion effect. This decreases the gradients in Eq. 2 around the edges, and so the supercluster can shrink more around the crest, loosing part of the tails that can be confused more easily with the noise. A more realistic noise description, and an improved diffusion model, based on the one measured in data is necessary to tune the supercluster parameters in simulation to recover part of the containment. The energy resolution found in simulation (around 4%) is far from the measured one in data, around 18%, because of the absence, in the simulation, of the dominant contribution of the response fluctuations: Poissonian distribution of the number of primary electrons ionized in the gas and exponential behavior of the number of secondary electrons produced in each GEM amplification stage [17]. Both of them are expected to give rise to fluctuations of the order to 10%, that, once added in quadrature, can account for a large part of the measured energy resolution.
The absolute energy scale was then calibrated with the energy distribution measured in data with the source, which provides monochromatic photons of 5.9 keV, with the procedure described in Ref. [31]. The supercluster integral is defined as:
| (6) |
where is the number of counts (photons) in the pixel, and the sum runs over all the pixels of the supercluster. While to perform the basic- and super-clustering only pixels passing the zero suppression are considered, for the energy estimate in Eq. 6 all the pixels within the cluster contours are counted, eventually having negative after the pedestal subtraction. This choice is meant to avoid a bias on the energy estimate, since after the pedestal subtraction the distribution of the noise is centered around zero. The distribution of , for a run taken in presence of source, is shown in Fig. 9. In addition to the main peak, with a mean of about 2500 counts, a broader peak is clearly distinguished, which represents the cases of two merged spots, with an integral twice the single spot one. An example of such a merged spot is given in Fig. 6 (left).
The position of the maximum in the single-spot distribution in runs with source allowed to calibrate the absolute energy scale of the Lemon detector. The energy resolution for the reconstructed Gac superclusters is about 18%, similar to the one that can be obtained with only the basic clustering step with Idbscan [34], and improving the one with the simple Nnc algorithm previously used [31].
Using runs with this monochromatic, high rate source, positioned at different distances from the GEM planes, a decrease of the light response for lower distances from the GEM was observed. This effect is opposite to the expected behavior of a lower light yield at larger distances. Indeed, it is expected that, during the drift along the -direction, the ionization charge undergoes a diffusion in the TPC gas, and some electrons are removed by attachment to the gas molecule. Consequently, some loss in the light collection may be expected. The opposite behavior, instead, is clearly observed. While this effect is currently under study in more detail, it was attributed to a possible saturation effect of the GEMs, especially in the third stage of multiplication, where the charge density in one GEM hole is maximal. Under this hypothesis, an effective, empirical correction was developed, which relies on the charge density of a cluster from a deposit. The light density, , is defined as:
| (7) |
where is the number of pixels passing the zero-suppression threshold (differently from the definition of , where all the pixels in the supercluster are considered). This effective calibration returns the absolute energy of a spot-like region, similar in size to the clusters, as a function of the supercluster density, : . In the hypothesis of saturation, the local density along the track is the parameter which regulates the magnitude of the effect, thus the correction has to be applied dynamically for slices of the supercluster having a size similar to the spots. This is achieved with the procedure described in the following.
First, the supercluster skeleton, i.e., the 1-pixel-wide representation along the path, is reconstructed. This is achieved through a morphological thinning of the superclusters with the iterative algorithm from Ref. [40, 41]. Second, a pruning of the obtained skeleton is done, to remove residual small branches along the main pattern, using a hit-or-miss transform. The output of this process for one example track is shown in Fig. 10.

For the calibration procedure, the found skeleton is followed, starting from one of the two end points, and circles having their center on a pixel of the skeleton and their radius equal to the average spot size of the clusters are defined. It was checked that this procedure includes all the pixels of the original cluster for the vast majority of the clusters considered. The local density of the slice is computed, and its integral is calibrated to an absolute energy through the effective correction . The pixels of the supercluster used for the slice calibration are removed (including the skeleton ones), and the procedure is iterated, until having included all the pixels. The sum of the energies of all the slices is the estimate of the calibrated energy of the supercluster:
| (8) |
As a closure test of this procedure, the calibrated energy of the superclusters reconstructed in the runs with the source is obtained. The value of the energy peak was obtained by fitting the distribution with the same function used in Fig. 9, and equals to keV, compatible with the expected value. The calibration procedure is an overkill for the case of the small spots, but it is necessary for very long cosmic ray tracks or even for medium-length superclusters from nuclear and electron recoils. The energy resolution worsen after the calibration (, i.e., 25% energy resolution), as a sign that the empiric correction is still suboptimal.
The skeletonization procedure provides a general method to estimate the track length (), accurate both in the case of straight and curving track. As a check, it has been verified that, in the case of straight tracks, the length extracted in this way coincides with the length of the major axis estimated with a singular value decomposition (SVD), described in the following section. For exactly round spots, the skeleton would collapse in the center of the cluster and the resulting length would be 1 pixel, but this completely symmetric case never happens in the considered samples.
5 Cluster shape observables
The interaction of different particles with the nuclei or the electrons in the gas of the TPC produces different patterns of the 2D projection of the initial 3D particle trajectory. These cluster shape observables are useful to discriminate different ionizing particles. In particular, they were used to select a pure sample of nuclear recoil candidates produced by the interaction of the neutrons originating from the AmBe source and to identify various sources of backgrounds. The main cluster shape observables are described in the following:
- •
projected length and width: a SVD on the matrix of the pixels belonging to the supercluster is performed. The eigenvectors found can be interpreted as the directions of the two axes of an ellipse in 2D. The eigenvalues represent the magnitudes of its semiaxes: the major one is defined as length, the minor one as width, . These are well defined for elliptic clusters, or for long and straight tracks. The directions along the major and the minor axis are defined as longitudinal and transverse in the following. The longitudinal and transverse supercluster profiles, for the cosmic ray track candidates shown as an example in Fig. 8 (bottom) are shown in Fig. 11. The longitudinal profile shows the typical pattern of energy depositions in clusters, while the transverse profile, dominated by the diffusion in the gas, shows a Gaussian shape. It has to be noted that the cluster sizes represent only the projection of the 3D track in the TPC on the 2D – plane;
Figure 11: Supercluster profile in the longitudinal (left) or transverse (right) direction, for a long and straight cosmic ray track candidate shown in Fig. 8 (bottom). The longitudinal profile shows an energy deposition in sub-clusters, while the transverse direction shows the typical width of the diffusion in the gas. For the longitudinal profile, the line represent the average number of photons per slice. For the transverse profile, it represents a fit with a Gaussian PDF. - •
projected path length: for curly and kinky tracks the values returned by the SVD of the supercluster are not an accurate estimates of their size. While the width is dominated by the diffusion, the length for patterns like the one shown in the example of Fig. 7 is ill-defined. Thus, the more general path length, , computed with the skeletonization procedure in Fig. 10 is used to estimate the linear extent for both straight and curved tracks.
- •
Gaussian width: the original width of the track in the transverse direction is expected to be much lower than the observed width induced by the diffusion in the gas. Thus, as shown in Fig. 11 (right), the standard deviation, , can estimated by a fit with a Gaussian probability density function (PDF). This modelling is appropriate for the cases of straight tracks, typical of cosmic-ray background, or energetic nuclear recoils, and also for spot-like clusters. Tracks with kinks are badly modeled by a Gaussian function: if the of the convergence of the fit is below a threshold, the estimated width from the SVD method described earlier is used;
- •
slimness: the ratio of the width over the path length, , represents the aspect ratio of the cluster. It is very useful to discriminate between cosmic-ray-induced background (long and thin) from low energy nuclear or electron recoils (more elliptical or round, as the spots);
- •
integral: the total number of photons detected by all the pixels gathered in the supercluster, , as defined in Eq. 6;
- •
pixels over threshold: the number of pixels in the supercluster passing the zero-suppression threshold, ;
- •
density: the ratio of , divided by , as defined in Eq. 7;
- •
energy: the calibrated energy, expressed in keV. The calibration method simultaneously performs both the per-slice correction as a function of the local , and the absolute energy scale calibration, which corrects the non perfect containment of the cluster, i.e., the bias in the distribution of , using with source.
The distributions of the projected supercluster path length, , and Gaussian transverse size, , are shown in Fig. 12, for data taken in different types of runs. During the data-taking approximately 3000 frames were recorded in absence of any external radioactive source (no-source sample). In these frames the interaction of ultra-relativistic cosmic ray particles (mostly muons) are clearly visible as very long clusters. Internal radioactivity of the Lemon materials also contributes with several smaller size clusters. About 1500 frames were acquired with the AmBe source, and approximately calibration images with source. In Fig. 12, as well as in the following ones showing other cluster properties, the distributions obtained in runs without radioactive sources are normalized to the AmBe data total CMOS exposure time. For the data with source, since the activity of the source is such to produce about 15 clusters/event, the data are scaled by a factor one-tenth with respect to the AmBe exposure time for clearness. Tracks originating from cosmic-ray interactions are present also in the data with both types of radioactive sources, with an efficiency scale factor slightly different from unity because of the trigger. Considerations about the trigger efficiency, affecting the background normalization in data with a radioactive source are given in Sec. 5.1. The distributions in this section aim to show the different cluster shape observables among the different kinds of events.
Figure 12 shows the cluster sizes distributions in the longitudinal and transverse directions for different sets of runs. Data show an average Gaussian width for the spots m (dominated by the diffusion in the gas), while it is larger, approximately 625 m, for data with AmBe source. The contribution of cosmic rays, present in all the data, is clearly visible in the data without any radioactive source, corresponding to clusters with a length similar to the detector transverse size (22 cm).
Other observables are the slimness, , and the light density, , shown in Fig. 13. The former is a useful handle to reject tracks from cosmic rays, which typically have a slim aspect ratio, i.e., low values of , while the clusters from are almost round, with values . By construction, , since the width is computed along the minor axis of the cluster, and for round spots it peaks at around 0.9. The apparent threshold effect is purely geometrical, due to the minimal size of the macro-pixel () used at the basic clustering step which can be larger than a round spot from . Data with AmBe source, which contains a component of nuclear recoils, show a component of round spots, similar in size to the ones of , and a more elliptical component, with values. Aside from the slightly different normalization of the cosmic-ray background in the region dominated by these interactions, , which is discussed in Sec. 5.1, the shape of the distribution shows some differences. This can be attributed to the cases of clusters induced by the radiation from the source which may overlap with a long track from a cosmic ray, changing its shape or, rarely, inducing a track splitting. The effect on the following statistical analysis is an underestimation of the signal efficiency, since a loose selection on this variable is used to discard cosmic-rays background. Given that the signal concentrates at values of , this effect is assumed to be negligible.
Finally, the light density, , is the variable expected to better discriminate among different candidates: cosmic-ray-induced background, electron recoils and nuclear recoil candidates. This is the variable used in this paper for the final particle identification. Due to electron diffusion in gas along the drift path, the measured depends on the position of the cluster.
Because the spot size is expected to increase by about a factor 4 from =0 cm to =20 cm (equation 1), assuming an uniform distribution of clusters within the sensitive volume, size distribution is expected to have a relative standard deviation of about 35%. This spoils the precision in the evaluation of the real both for the signal and for the background cluster resulting in a deterioration of the selection performance. Different methods to evaluate the cluster are under development and will allow a more effective determination of .
Moreover, the identification results can be improved using additional cluster shape variables, also profiting of their different correlations for signal and background clusters, via a multivariate approach, but in this early analysis a simple cut-based approach is chosen, for simplicity.
Finally, Fig. 14 (left) shows the calibrated energy () spectrum for the reconstructed superclusters. The energy spectrum shows the peak in the first bin of the distribution for data with source, and the expected broad peak for minimum ionizing particles traversing the 20 cm gas volume at around 60 keV. The distribution of the observed average projected for the no-source sample and for the AmBe samples is shown in Fig. 14 (right). The broadening of the distribution is mainly due to the specific energy loss fluctuation in the gas mixture of the cosmic ray particles. Its modal value, corrected for the effect of the angular distribution (an average inclination of 56∘ was measured from track reconstruction) is 2.5 keV/cm, in good agreement with the Garfield prediction of 2.3 keV/cm.
5.1 Background normalization
The data with AmBe source, taken on the Earth surface, suffers from a large contribution of interactions of cosmic rays, and from ambient radioactivity, whose suppression is not optimized for the Lemon detector. The cluster shape observables provide a powerful handle to discriminate them from nuclear recoils candidates, but the small residual background needs to be statistically subtracted. The distributions shown earlier, where the different types of data are normalized to the same exposure time, demonstrate that the live-time normalization provides already a good estimate of the amount of cosmic rays in data with radioactive sources. This approach does not account for a possible bias from the trigger, which is generated by the PMT signals, as described in Sec. 2. Indeed, in runs with the AmBe source, the PMT can trigger both on signals from neutron recoils or photons produced by the 241Am, and on ubiquitous signals from cosmic rays, while in the sample without source only the latter are possible. Therefore, during the same exposure time, the probability to trigger on cosmic rays is lower in events with AmBe than in no-source events. The trigger efficiency scale factor, , can be obtained as the ratio of the number of clusters selected in pure control samples of cosmic rays () obtained on both types of runs:
| (9) |
The control region is defined by selecting clusters with cm, , mm, and having an energy within a range dominated by the cosmic rays contribution, . The selected clusters show small values of , well compatible with the small specific ionization of ultra-relativistic particles. This sample is limited in statistics, but it is expected to be almost 100% pure. The scale factor obtained is . A possible consequence of occasional nearby clusters from nuclear recoils changing the distribution of is considered. The effect is expected to be reduced for the long clusters selected in the control region. A systematic uncertainty due to the different shape of is estimated by applying the selection on the AmBe clusters where the slimness is substituted, cluster-by-cluster, sampling the distribution in the no-source data. The difference in the is about 1%, small with respect to the statistical uncertainty of .
In addition to the normalization correction of the cosmic-ray background to be applied before subtracting it from the source data, it has been mentioned earlier that occasional overlap of long tracks from this background and signal tracks moderately distort the cluster shape distributions. Splitting of a long track in the data with the source may happen because of a gradient change in the region of the overlap with a dense nuclear recoil cluster. The typical track lengths of cosmic rays and signal tracks are so different that in these occurrences the split tracks are still much longer than the signal ones, thus they are rejected. In other cases, when the overlap is close to the edges, the track length is increased, and the selection dismisses those clusters. Since the requirement on the track length is very loose, the effect on the signal efficiency is assumed to be negligible.
In Fig. 15 the typical light density and polar angle (with respect the horizontal axis) distributions for long clusters selected with the requirements, except the energy one are shown for the AmBe and for the no-source sample, after having applied the scale factor to the latter. Clusters with are thus expected to be mostly coming from muon tracks, and they show indeed a polar angle which is shifted at values towards .
6 Nuclear recoil identification results
As mentioned in the previous Section, the 1D observable chosen to distinguish the signal of nuclear recoils from the various types of background is the energy density of the cluster.
6.1 Signal preselection
To enhance the purity of the signal sample, a preselection was applied, prior to a tighter selection on : clusters with cm or were rejected to primarily suppress the contribution from cosmic rays. A further loose requirement photons/pixel was also applied to remove the residual cosmic rays background based on their low specific ionization. These thresholds, which only reject very long and narrow clusters, are very loose for nuclear recoils with energies, given the expected range in simulated events, shown in Fig. 2, of less than 1 cm. Thus the preselection efficiency for signal is assumed to be 100%. For electron recoils it can be estimated on data by using the data sample, and is measured to be . Since the X-ray photo-electrons of this source are monochromatic, the estimate of the electron recoils rejection is only checked for an energy around keV. The spectrum of nuclear recoils from AmBe source, instead, extends over a wider range of energies, around [1–100] keV.
With this preselection, the distribution in the 2D plane – is shown in Fig. 16 for AmBe source and no-source data and for the resulting background-subtracted AmBe data. The latter distribution shows a clear component of clusters with short length ( cm) and high density (), expected from nuclear recoils deposits.
In addition, it shows a smaller component, also present only in the data with AmBe source, of clusters with a moderate track length, cm, and a lower energy density than the one characteristic of the nuclear recoils (). Since the density is inversely proportional to the number of active pixels , which is correlated to the track length, the almost linear decrease of as a function of points to a component with fixed energy. The 241Am is expected to produce photons with . This hypothesis is verified by introducing an oblique selection in the plane: , where , for the clusters with pixels, defining the photon control region, . The approximate oblique region in the plane corresponding to is also shown in Fig. 16. The obtained energy spectrum for these clusters is shown in Fig. 17, which indeed shows a maximum at , within the expected resolution. These events are thus rejected from the nuclear recoils candidates by vetoing the phase space.
6.2 PMT-based cosmic ray suppression
An independent information to the light detected by the sCMOS sensor of the camera is obtained from the PMT pulse, used to trigger the image acquisition. For each image acquired, the corresponding PMT pulse waveform is recorded. Tracks from cosmic rays, which typically have a large angle with respect the cathode plane, as shown in Fig. 15 (right), show a broad PMT waveform, characterized by different arrival times of the several ionization clusters produced along the track at different . Conversely, spot-like signals like deposits or nuclear recoils are characterized by a short pulse, as shown in Fig. 18.
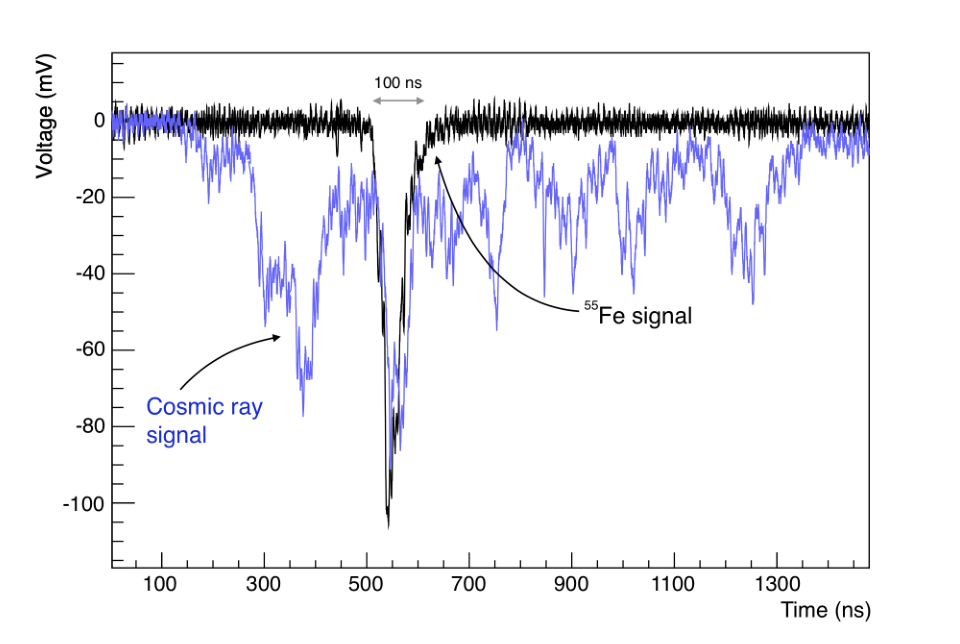
The Time Over Threshold (TOT) of the PMT pulse was measured, and is shown in Fig. 19. It can be seen from the region around 270 ns, dominated by the cosmic rays also in the data with the AmBe source, that the trigger scale factor also holds for the PMT event rate.
As expected, spot-like clusters (in 3D) correspond to a short pulse in the PMT, while cosmic ray tracks have a much larger pulse. The contribution of cosmic ray tracks is clearly visible in the data with radioactive sources. A selection on this variable is helpful to further reject residual cosmic rays background present in the AmBe or data, in particular tracks which may have been split in multiple superclusters, like the case shown in Fig. 8 (bottom), and thus passing the above preselection on the cluster shapes. A selection ns is then imposed. It has an efficiency of 98% on cluster candidates in AmBe data (after muon-induced background subtraction), while it is only 80% efficient on data with source. This larger value is expected because of the residual contamination of signals from cosmic rays, which fulfill the selection because their track is split in multiple sub-clusters, or because they are only partially visible in the sCMOS sensor image. These can be eventually detected as long, in the time dimension, by the PMT. The light density and the energy spectrum of the preselected clusters are shown in Fig. 20.
6.3 Light density and events rejection
The light density distributions, after the above preselection and cosmic ray suppression, for the data taken with AmBe source, data with source, and data without any artificial source, are different. The cosmic-background-subtracted distributions of in AmBe data and data, shown in the bottom panel of Fig. 20 (left), are used to evaluate a curve of 5.9 keV electron recoils rejection () as a function of signal efficiency (), obtained varying the selection on , shown in Fig. 21. The same procedure could be applied to estimate the rejection factor against the cosmic-ray-induced background, but this is not shown because of the limited size of the no-source data. This kind of background will however be negligible when operating the detector underground, in the context of the Cygno project, so no further estimates are given for this source.
Table 1 shows the full signal efficiency and electrons rejection factor for two example working points, and , having 40% and 50% signal efficiency for the selection on , averaged over the full energy spectrum exploited in the AmBe data. They correspond to a selection and , respectively. While this cut-based approach is minimalist, and could be improved by profiting of the correlations among and the observables used in the preselection in a more sophisticated multivariate analysis, it shows that a rejection factor approximately in the range [-] of electron recoils at with a gaseous detector at atmospheric pressure can be obtained, while retaining a high fraction of signal events.
| working point | Signal efficiency | Background efficiency | ||||
|---|---|---|---|---|---|---|
| 0.98 | 0.51 | 0.50 | 0.70 | 0.050 | 0.035 | |
| 0.98 | 0.41 | 0.40 | 0.70 | 0.012 | 0.008 | |
6.4 Nuclear recoil energy spectrum and differential efficiency
The energy spectrum for the candidates with =50% in the AmBe sample is shown in Fig. 22 (left). The signal efficiency is then computed for both the example working points in bins of the visible energy. The efficiency, , represents a background efficiency at a fixed energy , i.e., the energy of the photons emitted by the source. For the , the efficiency for very low-energy recoils, , is still 18%, dropping to almost zero at . The efficiencies reported here only account for analysis selection efficiency, while an absolute trigger efficiency should be also considered. Since the trigger will be probably different in the final CYGNO experiment, where the cosmic-ray-induced background would be much reduced, this estimate is not attempted for this study.
Two candidate nuclear recoils images, fulfilling the selection (with a light density photons/pixels and with energies of 5.2 and 6.0 keV) are shown in Fig. 23. The displayed images are a portion of the full-resolution frame, after the pedestal subtraction. While the determination of the direction of detected nuclear recoil is still under study, it appears pretty clear from the image that some sensitivity to their direction, even at such low energies, is retained and can be further exploited.


7 Conclusion and outlook
A method to efficiently identify recoiling nuclei after an elastic scattering with fast neutrons with an optically readout TPC was presented in this paper. A 7 liter prototype was employed by exposing its sensitive volume to two kinds of neutral particles in an overground location:
- •
photons with energy of 5.9 keV and 59 keV respectively provided by a radioactive source of and by one of 241Am able to produce electron recoils with equal energy by means of photoelectric effect;
- •
neutrons with kinetic energy of few MeV produced by an AmBe source that can create nuclear recoils with kinetic energy lower than the neutron ones.
The high sensitivity of the adopted sCMOS optical sensor allowed a very good efficiency in detecting events with an energy released in gas even below 10 keV.
Moreover, the possibility of exploiting the topological information (shape, size and more) of clusters of emitted light allowed to develop algorithms able to reconstruct not only the total deposited energy, but also to identify the kind of the recoiling ionizing particles in the gas (either an electron or a nucleus). Cosmic ray long tracks are also clearly separated.
Because of their larger mass and electric charge, nuclear recoils are expected to release their energy by ionizing the gas molecules in a few hundred m while the electrons are able to travel longer paths. For this reason, by exploiting the spatial distribution of the collected light, it was possible to identify 5.9 keV electron recoils with an efficiency of 96.5% (99.2%) against nuclear recoils by retaining a capability of detecting them with an efficiency of 50% (40%), averaged across the measured AmBe spectrum.
In particular, the nuclear recoil detection efficiency was measured to be 40% for deposited energies lower than 20 keV and 14% in the range (5–10) keV.
The results obtained in the studies presented in this paper can be improved by means of more sophisticated analyses exploiting a multivariate approach, which combines a more complete topological information about the light distribution along the tracks. Additional enhancement of sensitivity can be achieved with a DAQ system collecting single PMT waveforms to be correlated with the track reconstructed in the sCMOS images.
8 Acknowledgments
We are grateful to “Servizio Sorgente LNF”. This work was supported by the European Research Council (ERC) under the European Union’s Horizon 2020 research and innovation program (grant agreement No 818744).
References
- [1] B. W. Lee and S. Weinberg, “Cosmological lower bound on heavy-neutrino masses,” Phys. Rev. Lett., vol. 39, pp. 165–168, Jul 1977.
- [2] T. M. Undagoitia and L. Rauch, “Dark matter direct-detection experiments,” Journal of Physics G: Nuclear and Particle Physics, vol. 43, p. 013001, dec 2015.
- [3] Y. Hochberg, E. Kuflik, T. Volansky, and J. G. Wacker, “Mechanism for thermal relic dark matter of strongly interacting massive particles,” Phys. Rev. Lett., vol. 113, p. 171301, Oct 2014.
- [4] D. E. Kaplan, M. A. Luty, and K. M. Zurek, “Asymmetric dark matter,” Phys. Rev. D, vol. 79, p. 115016, Jun 2009.
- [5] K. PETRAKI and R. R. VOLKAS, “Review of asymmetric dark matter,” International Journal of Modern Physics A, vol. 28, no. 19, p. 1330028, 2013.
- [6] K. M. Zurek, “Asymmetric dark matter: Theories, signatures, and constraints,” Physics Reports, vol. 537, no. 3, pp. 91 – 121, 2014. Asymmetric Dark Matter: Theories, signatures, and constraints.
- [7] F. Mayet, A. Green, J. Battat, J. Billard, N. Bozorgnia, G. Gelmini, P. Gondolo, B. Kavanagh, S. Lee, D. Loomba, J. Monroe, B. Morgan, C. O’Hare, A. Peter, N. Phan, and S. Vahsen, “A review of the discovery reach of directional dark matter detection,” Physics Reports, vol. 627, pp. 1 – 49, 2016. A review of the discovery reach of directional Dark Matter detection.
- [8] E. Baracchini, G. Cavoto, G. Mazzitelli, F. Murtas, F. Renga, and S. Tomassini, “Negative ion time projection chamber operation with SF6 at nearly atmospheric pressure,” Journal of Instrumentation, vol. 13, pp. P04022–P04022, Apr. 2018.
- [9] M. Marafini, V. Patera, D. Pinci, A. Sarti, A. Sciubba, and E. Spiriti, “ORANGE: A high sensitivity particle tracker based on optically read out GEM,” Nucl. Instrum. Meth., vol. A845, pp. 285–288, 2017.
- [10] V. C. Antochi, E. Baracchini, G. Cavoto, E. D. Marco, M. Marafini, G. Mazzitelli, D. Pinci, F. Renga, S. Tomassini, and C. Voena, “Combined readout of a triple-GEM detector,” JINST, vol. 13, no. 05, p. P05001, 2018.
- [11] D. Pinci, E. Di Marco, F. Renga, C. Voena, E. Baracchini, G. Mazzitelli, A. Tomassini, G. Cavoto, V. C. Antochi, and M. Marafini, “Cygnus: development of a high resolution TPC for rare events,” PoS, vol. EPS-HEP2017, p. 077, 2017.
- [12] G. Mazzitelli, V. A. Antochi, E. Baracchini, G. Cavoto, A. De Stena, E. Di Marco, M. Marafini, D. Pinci, F. Renga, S. Tomassini, and C. Voena, “A high resolution TPC based on GEM optical readout,” in 2017 IEEE Nuclear Science Symposium and Medical Imaging Conference (NSS/MIC), pp. 1–4, Oct 2017.
- [13] D. Pinci, E. Baracchini, G. Cavoto, E. Di Marco, M. Marafini, G. Mazzitelli, F. Renga, S. Tomassini, and C. Voena, “High resolution TPC based on optically readout GEM,” Nuclear Instruments and Methods in Physics Research Section A: Accelerators, Spectrometers, Detectors and Associated Equipment, 2018.
- [14] I. A. Costa, E. Baracchini, R. Bedogni, F. Bellini, L. Benussi, S. Bianco, M. Caponero, G. Cavoto, E. D. Marco, G. D’Imperio, G. Maccarrone, M. Marafini, G. Mazzitelli, A. Messina, F. Petrucci, D. Piccolo, D. Pinci, F. Renga, G. Saviano, and S. Tomassini, “CYGNO: Triple-GEM optical readout for directional dark matter search,” Journal of Physics: Conference Series, vol. 1498, p. 012016, apr 2020.
- [15] C. Collaboration, “CYGNO Phase-I: One cubic meter demonstrator.” https://web.infn.it/cygnus/cygno, 2020.
- [16] A. Roberts, P. Svihra, A. Al-Refaie, H. Graafsma, J. Küpper, K. Majumdar, K. Mavrokoridis, A. Nomerotski, D. Pennicard, B. Philippou, S. Trippel, C. Touramanis, and J. Vann, “First demonstration of 3d optical readout of a TPC using a single photon sensitive timepix3 based camera,” Journal of Instrumentation, vol. 14, pp. P06001–P06001, jun 2019.
- [17] D. Pinci, A triple-GEM detector for the muon system of the LHCb experiment. PhD thesis, Cagliari University, CERN-THESIS-2006-070, 2006.
- [18] Hamamatsu, ORCA-Flash4.0 V3 Digital CMOS camera, 2018. http://www.hamamatsu.com/jp/en/C13440-20CU.html.
- [19] M. Marafini, V. Patera, D. Pinci, A. Sarti, A. Sciubba, and E. Spiriti, “High granularity tracker based on a Triple-GEM optically read by a CMOS-based camera,” JINST, vol. 10, no. 12, p. P12010, 2015.
- [20] HZC Photonics, XP3392 Photomultiplier. http://www.hzcphotonics.com/products/XP3392.pdf.
- [21] V. C. Antochi, G. Cavoto, I. Abritta Corsta, E. Di Marco, G. D’Imperio, F. Iacoangeli, M. Marafini, A. Messina, D. Pinci, F. Renga, C. Voena, E. Baracchini, A. Cortez, G. Dho, L. Benussi, S. Bianco, C. Capoccia, M. Caponero, G. Maccarrone, G. Mazzitelli, A. Orlandi, E. Paoletti, L. Passamonti, D. Piccolo, D. Pierluigi, F. Rosatelli, A. Russo, G. Saviano, S. Tomassini, R. A. Nobrega, and F. Petrucci, “A GEM-based optically readout time projection chamber for charged particle tracking,” 2020.
- [22] R. Campagnola, “Study and optimization of the light-yield of a triple-GEM detector ,” Master’s thesis, Sapienza University of Rome, 2018.
- [23] N. Torchia, “Development of a tracker based on GEM optically readout ,” Master’s thesis, Sapienza University of Rome, 2016.
- [24] CAEN, 2 Channel 15 kV/1 mA (10 W) NIM HV Power Supply Module, 2017. http://www.caen.it/csite/CaenProd.jsp?parent=21\&idmod=894.
- [25] R. Veenhof, “GARFIELD, recent developments,” Nucl. Instrum. Meth. A, vol. 419, pp. 726–730, 1998.
- [26] R. Veenhof, “GARFIELD, a drift chamber simulation program,” Conf. Proc. C, vol. 9306149, pp. 66–71, 1993.
- [27] G. Mazzitelli, A. Ghigo, F. Sannibale, P. Valente, and G. Vignola, “Commissioning of the DANE beam test facility,” Nuclear Instruments and Methods in Physics Research Section A: Accelerators, Spectrometers, Detectors and Associated Equipment, vol. 515, no. 3, pp. 524 – 542, 2003.
- [28] I. Abritta Costa, E. Baracchini, F. Bellini, L. Benussi, S. Bianco, M. A. Caponero, G. Cavoto, G. D’Imperio, E. Di Marco, G. Maccarrone, M. Marafini, G. Mazzitelli, A. Messina, F. Petrucci, D. Piccolo, D. Pinci, F. Renga, F. Rosatelli, G. Saviano, and S. Tomassini, “Stability and detection performance of a GEM-based optical readout TPC with He/CF4 gas mixtures,” Journal of Instrumentation, vol. xx, p. xxx, jul 2020.
- [29] S. Agostinelli et al., “GEANT4—a simulation toolkit,” Nucl. Instrum. Meth. A, vol. 506, p. 250, 2003.
- [30] J. Ziegler, “Srim – 2003,” Nuclear Instruments and Methods in Physics Research Section B: Beam Interactions with Materials and Atoms, vol. 219-220, no. 3, pp. 1027–1036, 2004.
- [31] I. Abritta Costa, E. Baracchini, F. Bellini, L. Benussi, S. Bianco, M. A. Caponero, G. Cavoto, G. D’Imperio, E. Di Marco, G. Maccarrone, M. Marafini, G. Mazzitelli, A. Messina, F. Petrucci, D. Piccolo, D. Pinci, F. Renga, F. Rosatelli, G. Saviano, and S. Tomassini, “Performance of optically readout GEM-based TPC with a 55Fe source,” Journal of Instrumentation, vol. 14, pp. P07011–P07011, jul 2019.
- [32] Y. Dong and S. Xu, “A new directional weighted median filter for removal of random-valued impulse noise,” IEEE Signal Processing Letters, vol. 14, no. 3, pp. 193–196, 2007.
- [33] G. S. P. Lopes, E. Baracchini, F. Bellini, L. Benussi, S. Bianco, G. Cavoto, I. A. Costa, E. Di Marco, G. Maccarrone, M. Marafini, G. Mazzitelli, A. Messina, R. A. Nobrega, D. Piccolo, D. Pinci, F. Renga, F. Rosatelli, D. M. Souza, and S. Tomassini, “Study of the impact of pre-processing applied to images acquired by the cygno experiment,” in Pattern Recognition and Image Analysis (A. Morales, J. Fierrez, J. S. Sánchez, and B. Ribeiro, eds.), (Cham), pp. 520–530, Springer International Publishing, 2019.
- [34] I. Abritta et al., “A density-based clustering algorithm for the cygno data analysis,” In preparation, vol. 00, no. 0, pp. 00–00, 2020.
- [35] M. Ester, H.-P. Kriegel, J. Sander, and X. Xu, “A density-based algorithm for discovering clusters in large spatial databases with noise,” pp. 226–231, AAAI Press, 1996.
- [36] G. Van Rossum and F. L. Drake, Python 3 Reference Manual. Scotts Valley, CA: CreateSpace, 2009.
- [37] R. Brun and F. Rademakers, “ROOT: An object oriented data analysis framework,” Nucl. Instrum. Meth. A, vol. 389, pp. 81–86, 1997.
- [38] V. Caselles, R. Kimmel, and G. Sapiro, “Geodesic Active Contours,” International Journal of Computer Vision, vol. 22, pp. 61–79, 1997.
- [39] P. Márquez-Neila, L. Baumela, and L. Alvarez, “A morphological approach to curvature-based evolution of curves and surfaces,” IEEE Transactions on Pattern Analysis and Machine Intelligence, vol. 36, no. 1, pp. 2–17, 2014.
- [40] Z. Guo and R. W. Hall, “Parallel thinning with two-subiteration algorithms,” Commun. ACM, vol. 32, p. 359–373, Mar 1989.
- [41] L. Lam, S. Lee, and C. Y. Suen, “Thinning methodologies - a comprehensive survey,” IEEE Transactions on Pattern Analysis and Machine Intelligence, vol. 14, no. 9, pp. 869–885, 1992.