Gas Content Regulates the Lifecycle of Star Formation and Black Hole Accretion in Galaxies
Abstract
Active galactic nucleus (AGN) feedback is expected to impact the amount of cold gas in galaxies by driving strong galactic winds, by preventing external gas inflows, or by changing the thermodynamical state of the gas. We use molecular gas mass estimates based on dust absorption (H/H) to study gas content of large samples of type 2 AGN host galaxies in comparison with inactive galaxies. Using sparse principal component and clustering analysis, we analyze a suite of stellar and structural parameters of face-on, central galaxies at redshift and with stellar mass . We identify four galaxy groups of similar mass and morphology (mass surface density, velocity dispersion, concentration, and Sérsic index) that can be evolutionarily linked through a lifecycle wherein gas content mediates their star formation rate (SFR) and level of AGN activity. Galaxies first consume their gas mostly through bursty star formation, then enter into a transition phase of intermediate gas richness in which star formation and AGNs coexist, before settling into retirement as gas-poor, quiescent systems with residual levels of AGN activity (LINERs). Strongly accreting black holes (Seyferts) live in gas-rich, star-forming hosts, but neither their gas reservoir nor their ability to form stars seem to be impacted instantaneously (timescales Gyr) by AGN feedback. Our results are inconsistent with AGN feedback models that predict that central, bulge-dominated, Seyfert-like AGNs in massive galaxies have significantly lower molecular gas fractions compared to inactive galaxies of similar mass, morphology, and SFR.
Keywords:
galaxies: evolution — galaxies: nuclei — galaxies: Seyfert — galaxies: star formation — ISM: molecules — (ISM:) dustI INTRODUCTION
There are two main types of galaxies in the local Universe: star-forming, gas-rich spiral galaxies, and quiescent, gas-poor elliptical and lenticular galaxies. Nearly all massive local galaxies harbor supermassive black holes () at their centers. Through feeding and feedback mechanisms, they evolve with their host galaxies, and perhaps modulate each other’s growth (Kormendy & Ho 2013).
The exact nature of (feedback) mechanisms that transform galaxies from star-forming to quiescent is unknown. Star formation can be quenched by removing or heating gas in galaxies or their surrounding halos (Dekel & Silk 1986; Silk & Rees 1998; Di Matteo et al. 2005; Dekel & Birnboim 2006; Hopkins et al. 2006; Martig et al. 2009; Peng et al. 2010; Fabian 2012; Peng et al. 2015; Dubois et al. 2016; Pillepich et al. 2018), either through external mechanisms that are governed by the dark matter halo or the environment, or through internally driven processes such as AGN feedback, stellar feedback, and morphological quenching.
Studying gas in the interstellar medium is critical for understanding the coevolution between supermassive black holes and their host galaxies. However, directly measuring gas content using radio telescopes for large, representative galaxy samples is difficult and time-consuming. Thus, to date, small and heterogenous samples of AGN hosts with cold gas measurements have yielded mixed results on the impact of AGN feedback. While some studies report suppressed gas content in AGNs (Haan et al. 2008; Brusa et al. 2015; Kakkad et al. 2017; Perna et al. 2018), others find that active galaxies have similar or even higher gas content relative to inactive galaxies (Maiolino et al. 1997; Bertram et al. 2007; Ho et al. 2008; Fabello et al. 2011; Geréb et al. 2015; Saintonge et al. 2017; Husemann et al. 2017; Yesuf et al. 2017a; Rosario et al. 2018; Ellison et al. 2019; Shangguan et al. 2018; Shangguan & Ho 2019; Zhuang & Ho 2020; Jarvis et al. 2020).
We recently proposed a cost-effective method to predict molecular gas masses using dust absorption as inferred from the Balmer decrement (Yesuf & Ho 2019). Here we apply this method, in tandem with a multitude of other galaxy properties, to study the evolution of the molecular gas content of large samples of AGN host galaxies in comparison with inactive galaxies. Although it is important to test specific model predictions (Harrison 2017; Scholtz et al. 2018, e.g.,), we take a data-driven approach and do not aim to test specific AGN feedback models. To our knowledge, comprehensive, quantitative predictions that can be compared with our approach and observations have not been made yet. It can be inferred, nevertheless, that different models make generally different predictions of the relationships between AGN activity, gas fractions, star formation rates (SFRs), and galaxy morphology. We hope our approach and general results inspire follow-up, direct comparisons.
Accretion onto a black hole may release % of its rest mass energy, which is comparable to the binding energy of gas in the halo (Silk & Rees 1998; Fabian 2012, e.g.,). Even if a small fraction of the energy can be coupled to the gas, an AGN can have very significant effects on the evolution of its host galaxy (Fabian 2012; Kormendy & Ho 2013). Depending on the black hole accretion rate, AGN feedback is modeled using two main modes (Schaye et al. 2015, although see). At high accretion rates, a radiative mode (also called quasar mode) is used (Di Matteo et al. 2005; Hopkins et al. 2006, e.g.,), while at low accretion rates, a kinetic mode (also called radio mode), producing high-velocity winds and/or radio jets, is used (Croton et al. 2006; Weinberger et al. 2017, e.g.,). Galaxy formation models that do not include AGN feedback form stars too efficiently and fail to reproduce even basic properties of massive galaxies.
Previous work related to IllustrisTNG simulations suggest that the transition between star-forming and quenched galaxies is tied to the onset of kinetic mode feedback (Weinberger et al. 2017; Habouzit et al. 2019; Nelson et al. 2019; Terrazas et al. 2020; Zinger et al. 2020). Kinetic feedback removes gas from the star-forming regions as well as leads to hotter, more dilute and higher entropy circumgalactic medium (CGM) with long cooling times (Zinger et al. 2020). Hence, the AGN feedback in TNG simulations ejects and heats up the gas within and around galaxies. The cumulative wind energy from a low-accretion rate black hole is crucial to produce gas-deficient, compact, quiescent galaxies, above a threshold of or . Below this threshold most simulated central galaxies are star-forming, and above the threshold most are quiescent (Terrazas et al. 2020; Zinger et al. 2020).
In contrast, in the EAGLE simulations (Bower et al. 2017) it is proposed that star formation-driven outflows regulate the amount of gas reaching the black holes and set the characteristic stellar mass or halo mass . Outflows are efficient in low-mass galaxies, making it difficult for the build-up of cool gas in the central regions of galaxies. In massive galaxies, which are surrounded by hot halos, outflows cease to be buoyant and are less efficient, and thus the unrestrained central gas build up leads to rapid black hole growth. In turn, the black holes become effective at heating the halo gas, disrupt the infalling cool gas supply, and slowly starve the galaxies of the fuel for future star formation.
Compared to those in the EAGLE simulations, the winds in TNG simulations eject significantly larger amounts of gas from the centers of massive galaxies (Nelson et al. 2019; Mitchell et al. 2020). Likewise, EAGLE simulations do not predict a negative trend between SSFR and AGN luminosity; AGN feedback does not reduce galaxy-wide instantaneous SFRs of luminous, simulated AGN host galaxies (Scholtz et al. 2018). The signature of AGN feedback is instead imprinted on the overall SSFR distributions of massive galaxies. Thus, there may be implicit/subtle relationships between the SFRs, gas fractions and AGN luminosities since the timescale of an AGN episode is shorter than the timescale for the suppression of star formation by possibly multiple AGN episodes (Harrison 2017; McAlpine et al. 2017; Scholtz et al. 2018; Schulze et al. 2019).
In Section II, we describe the data, sample selection and the methods used to identify our proposed evolutionary sequence. In Section III, we present relationships among nuclear activity, gas, stellar, and structural properties, along the sequence. Section IV presents a discussion of our results. A summary of this work and its main conclusions are given in Section V.
II DATA AND METHODOLOGY
II.1 Data
Our galaxy sample is taken from the Seventh Data Release of the Sloan Digital Sky Survey (Abazajian et al. 2009; Alam et al. 2015, SDSS DR7;). The publicly available Catalog Archive Server (CAS) 11
1
http://skyserver.sdss.org/casjobs/
We use CAS in the context of data release 13 (DR13) to retrieve various measurements in different catalogs. However, the sample of galaxies we use is restricted to those in DR7, because the axis ratio and Sérsic index measurements from Simard et al. 2011 are only available for DR7 galaxies. The following tables are queried: photoobjall, galSpecIndx, galSpecInfo, galSpecLine, galSpecExtra, and specDR7. is used to collate some of the measurements used in this work (e.g., emission-line fluxes and spectral indices). These data are supplemented with stellar mass and SFR from version 2 of the GALEX-SDSS-WISE Legacy Catalog22
2
http://pages.iu.edu/salims/gswlc/ (Salim et al. 2016; Salim et al. 2018, GSWLC-2;), along with structural parameters (Sérsic index and ellipticity/axial ratio) derived from single-component Sérsic function fits (Simard et al. 2011), and environmental information from the SDSS group catalog (Lim et al. 2017). To assess the importance of bars on AGN fueling, we use a bar classification catalog based on machine learning (Domínguez Sánchez et al. 2018). The deep learning model was trained on visual classifications of SDSS images by expert astronomers (Nair & Abraham 2010). For the th galaxy in a given sample of size , the machine classification outputs a probability that it has a bar. Assuming a Poisson-binomial distribution for the number of barred galaxies in the given sample, we estimate its mean bar fraction, , and its standard deviation, . The binomial distribution is a special case of the Poisson-binomial distribution, when all probabilities are the same.

We define the effective mass surface density as , where is the total stellar mass, and is the -band half-light radius. The concentration index is defined as the ratio of 90% Petrosian radius to the 50% Petrosian radius in the band, .
In our adopted group catalog 33
3
https://gax.sjtu.edu.cn/data/Group.html
The group catalog is based on SDSS DR13. (Lim et al. 2017), the groups were identified with an iterative halo-based group finder (Yang et al. 2007), which used the stellar mass of a central galaxy as well as the stellar mass difference between the central galaxy and the th most massive satellite as halo-mass proxies. An abundance matching technique was used to assign final halo masses to distinct groups. For groups that were not assigned masses by the abundance matching, due to mass incompleteness, halo masses were assigned based on the mean relation between the halo mass and its proxies obtained from the group finder. Mock galaxy samples constructed from EAGLE simulations were used to test and calibrate the group finder.


II.2 The main sample selection
The following steps are taken to select the main sample used in this work:
- •
Select galaxies in the redshift range and stellar mass range from the four narrow-mass samples shown in Figure 1. The four samples, denoted by S1 to S4, have stellar mass , , , and , respectively, and , , , and , respectively.
- •
Include only central galaxies (not satellites) in the group catalog (Lim et al. 2017). The results are similar if we only use isolated galaxies, with no nearby neighbors.
- •
Exclude edge-on galaxies (axis ratio ). The orientation effect may complicate the estimation of gas mass from dust absorption in edge-on galaxies.
- •
Exclude type 1 AGNs by restricting the velocity dispersions of the Balmer emission lines to values less than km s-1, below which very few type 1 AGNs exist (Greene & Ho 2007). For these objects, the AGN may significantly affect the measurements of the host galaxy properties.
- •
Select galaxies with signal-to-noise ratio SNR for the flux densities of H, H, [O III] 5007, [O II] 3726, 3729, and [O I] 6300 44 4 If the requirement of the faint [O I] 6300 line is omitted, the sample size increases significantly but the results that do not depend on [O I] do not change significantly.. These criteria ensure that the molecular gas mass, AGN luminosity, and the ionization parameter are reliable.
- •
Select galaxies with well-measured (fiber) stellar velocity dispersion (SNR ).
The main results are similar for all four samples and we take the sample S2 [] as the fiducial sample. To avoid redundancy, we selectively present some of the results for the other samples.
II.3 Estimation of molecular gas masses
We calculate the -band dust absorption using the observed H/H ratio and the dust attenuation curve Charlot & Fall 2000, as follows:
| (1) |
Assuming that the intrinsic Balmer decrement H/H = 2.86 for inactive galaxies and H/H = 3.1 for AGNs (Ferland & Netzer 1983; Gaskell & Ferland 1984, e.g.,),
| (2) |
where . If the observed ratio of an object is below the intrinsic ratio (2.86 or 3.1), we set mag55 5 This might cause the object’s predicted gas mass to be lower by up to dex than it actually is. Such small changes are not important for our application. An object with H/H might have .. For reference, mag corresponds to .
We estimate the molecular gas mass using our empirical (median) estimator presented in our previous work (Yesuf & Ho 2019). In particular, we use nebular dust absorption, the average gas-phase metallicity, which is inferred from the stellar mass-metallicity relation (Tremonti et al. 2004), and the half-light radius to estimate , with uncertainty of dex. The results on the gas masses are similar if we use the dust absorption derived from fitting the stellar continuum alone or in combination with H/H.
II.4 Estimation of black hole accretion rate
We combine dust-corrected [O III] 5007 and [O I] 6003 luminosities to estimate the total bolometric luminosity () of the AGN, with an uncertainty of dex (Netzer 2009). We calculate the Eddington luminosity, , using black hole masses () derived from the fiber stellar velocity dispersions (Kormendy & Ho 2013). The SDSS fiber spans different regions of galaxies for different redshifts; we do not correct for this effect in our black hole estimates, which has a nominal uncertainty of dex. Thus, the resulting Eddington ratio (), a rough approximation of the mass accretion rate, has an uncertainty of dex.
II.5 SPCA & clustering analysis in narrow mass ranges
Star formation and AGN activities evolve on timescales that are much shorter than a galaxy merger timescale (Fang et al. 2013; Yesuf et al. 2014; Rodriguez-Gomez et al. 2015; Trayford et al. 2016; Hahn et al. 2017). Most local star-forming galaxies are unlikely to grow more than 0.3 dex in stellar (or black hole) mass by mergers in the time it takes them to cease forming stars. Galaxies that have similar masses but different internal mass distributions and environments are also unlikely to be immediate progenitors and descendants. Thus, to select candidate galaxies that are likely to be directly evolutionarily linked, we choose central, massive galaxies in four narrow stellar mass ranges.
Even in a restricted mass range and environment, galaxies are diverse in their gas content, SFR, and star formation history (SFH), stellar population age, internal kinematics, morphology (mass/light distribution), and AGN activity. Some of these properties not only correlate with each other, but also may be sensitive to multiple, slightly different indicators. To explore statistically the evolution of central, massive galaxies in the four samples of approximately constant mass, we perform sparse principle component analysis (SPCA) and clustering analysis of 12 variables that describe the morphology and the AGN and star formation activities of galaxies (Figure 2). PCA seeks a reduced set of new, uncorrelated variables, called principal components (PCs), which are linear combinations of the original variables. PCs sequentially capture the maximum variance in the data, and the first PC accounts for the highest variance. Because each PC is a linear combination of all variables, usually with non-zero weights, it is generally difficult to interpret the derived PCs. SPCA is a modern variant of PCA in which the PCs are derived from only a few of the most important variables. Furthermore, the clustering analysis aims to partition the reduced set of variables into ‘‘clusters,’’ such that galaxies assigned to the same cluster are less dissimilar than those in different clusters66 6 The “clusters” identified through the clustering analysis should not be confused with gravitationally bound galaxy clusters.. After efficiently identifying the clusters using all the relevant information, we visualize how they distribute in two-dimensional spaces of well-known diagrams to reveal evolutionary paths. Stellar spectral indices are used to gauge the average stellar population age of each cluster, and to determine its position on the evolutionary sequence.
We implement SPCA using the sparsepca package (Erichson et al. 2018) in R. SPCA can be formulated as a regularized regression-type problem (Zou et al. 2006). Given the data matrix , SPCA attempts to minimize the function , subject to , where is a sparse weight matrix, is an orthonormal matrix, and is the identity matrix. So, the PC matrix is . The last two terms of the function are known as the elastic net regularizer. The first term shrinks the weights toward zero if is large enough. We use four PC components, accounting for % of the variance, and . The main results do not change significantly if we instead use a value of for both and . We also center and scale the variables to have unit variance.
We perform -means clustering of the PC scores in R to group the data into or clusters. One of the simplest and most popular clustering algorithms, -means aims to iteratively partition a given dataset of observations into optimal clusters. In the end, each observation is assigned to the nearest cluster, such that the squared Euclidian distances of the observations from the cluster centers are minimized. Determining objectively the optimal number of clusters in a dataset is not an easy problem. Different metrics (the gap statistics, the elbow method, etc.) indicate . Using gives similar results in which three of the four bulge-dominated groups (C1-C3) are merged together. While this reinforces the fact that these clusters are evolutionary related, this choice, unlike or , does not provide sufficiently fine distinction to illustrate the evolutionary stages discussed in Section 3.
II.6 Toy stellar population models
To illustrate how a recent burst of star formation evolves in the diagram (Balogh et al. 1999; Kauffmann et al. 2003), we use the updated version of the Bruzual & Charlot 2003 stellar population code to model the SFHs of galaxies as a superposition of an old stellar population initially formed at time Gyr () and a young population that formed in a recent burst at Gyr (). The recent burst fraction is 5%, 10% or 30%. The old population formed following a delayed exponential SFH of the form with e-folding time Gyr, while the young population has SFH of the form with Gyr (Yesuf et al. 2014). The single stellar population models assume a Chabrier 2003 stellar initial mass function and solar metallicity before the recent burst and 2.5 times solar after the burst.
III RESULTS
III.1 Relationships among nuclear activity, gas, stellar, and structural properties
Figure 3 shows how the morphology (mass surface density, velocity dispersion, concentration or Sérsic ) of the five clusters relates to their SFRs. The cluster C0 mostly contains less dense (), lower velocity dispersion (), and less concentrated ( and ) galaxies compared to the other clusters. The galaxies in C0 are exclusively star-forming galaxies. The clusters from C1 to C4 span a wide range in SFR and gas mass, at a constant morphology. C1 has the highest average SFR while C4 has the lowest average SFR; the SFRs of C2 and C3 are intermediate between those of C1 and C4. The galaxies in C0 are likely pseudo bulges, and the rest classical bulges or ellipticals (Yesuf et al. 2020b). Although our current theoretical understanding of bulges is incomplete, the common view is that classical bulges and ellipticals are formed mainly by early dissipative mergers, while pseudo bulges are formed by disk-related, internal secular processes (Kormendy & Kennicutt 2004; Brooks & Christensen 2016). Black holes also correlate differently with the properties of the two bulge types (Kormendy & Ho 2013). The correlations with pseudo bulge properties are weak and imply no close coevolution. Thus, galaxies in C0 may have undergone different formation histories than those in the other clusters. While they may eventually evolve to become galaxies in C1, this is unlikely to happen in a short period of time.
Simulations show that the evolution tracks in the plane (Figure 3) have a characteristic “L” shape (Zolotov et al. 2015; Tacchella et al. 2016; Choi et al. 2018). Gas consumption by star formation and gas ejection by stellar and supernova feedback lead to quenching of star formation at a critical value of . Further gas accretion is prevented because the galaxies have reached the critical halo mass to form a stable viral shock, which keeps the CGM at the virial temperature (Dekel & Birnboim 2006). The halo mass for our fiducial sample is (Lim et al. 2017). In the EAGLE simulations, Correa et al. 2019 found that the time when galaxies move to the red sequence depends on their morphology, and AGN feedback is important for quenching central ellipticals, but not for disks. Next, we show the nature of the nuclear activities in groups C0 to C4.

The optical emission-line intensity ratio diagnostic diagrams effectively discriminate whether the source of ionization in a galaxy arises from recently formed hot, massive stars or accretion onto a black hole (Baldwin et al. 1981; Veilleux & Osterbrock 1987; Ho et al. 1997a; Kewley et al. 2001; Kauffmann et al. 2003; Kewley et al. 2006). Figure 4a shows the most sensitive of the line-ratio diagrams, involving [O III] /H and [O I] /H. AGN-dominated galaxies occupy the upper-right corner of the diagram, while star formation-dominated galaxies lie in the lower-left corner. Galaxies hosting AGNs lie on two branches associated with Seyferts and LINERs, whose difference in ionization stems from their difference in accretion rate (Ho 2009b). Our clusters occupy distinct loci normally assigned to standard galaxy spectral classes, even though the line-ratio classification criteria were not among the parameters used in the SPCA analysis.
For the fiducial sample with stellar mass , nearly all of the members in C1 (98%) and 86% of C2 are classified as star-forming galaxies, with the former systematically more luminous than the latter owing to their larger SFRs. By contrast, AGNs comprise most () of the galaxies in C3 and C4, predominantly Seyferts in C3 (74%) and LINERs in C4 (74%), whose difference in AGN power is reflected in their [O III] luminosity (Heckman et al. 2004). The four classes segregate quite cleanly in a plot of versus [O III]/H (Figure 4b). An additional, similar result for [N II] /H and [S II] /H diagrams is given in the Appendix.
| Sample | Cluster | Seyferts | LINERs | Star-forming Galaxies | |
|---|---|---|---|---|---|
| C0a | |||||
| C0b | |||||
| S1 | C1 | ||||
| C2 | |||||
| C3 | |||||
| C4 | |||||
| C0 | |||||
| C1 | |||||
| S2 | C2 | ||||
| C3 | |||||
| C4 | |||||
| C0 | |||||
| C1 | |||||
| S3 | C2 | ||||
| C3 | |||||
| C4 | |||||
| C0 | |||||
| C1 | |||||
| S4 | C3 | ||||
| C4a/C2 | |||||
| C4b |
Note. — There some variations between clusters in different mass samples. We use numbers 0 to 4 to group the clusters into five approximately distinct categories, across different masses ranges. The cluster C4a/C2 of the most massive sample shows overlapping properties with both clusters C2 and C4 in the fiducial sample, S2, and cluster C4b in the same mass range.
Table 1 quantifies the AGN fractions (divided into Seyferts and LINERs) and star-forming galaxy fractions for the four samples. Throughout this work, we use the [O III]/H and [O I]/H line intensity ratios to define the activity types (Kewley et al. 2006). For a cluster of a given sample, we estimate the standard errors of the fractions of the activity types in the cluster as , where is either the fraction of Seyferts or LINERs or star-forming galaxies in the cluster, and is the sample size of the cluster. For all samples, the C2 and C1 clusters are dominated by star-forming galaxies, C3 by Seyferts, and C4 by LINERs. In other words, there is a broad correspondence between our classification and those of previous work. However, there are significant differences because our clusters contain mixtures of activity types of varying proportions. The aim of the previous classifications was to cleanly separate the activity types based on emission-line ratios using photoionization models or empirical data analysis (Kauffmann et al. 2003; Kewley et al. 2006; de Souza et al. 2017). In contrast, our aim is to study the correlation among activity type, gas content, SFR, and structural properties. The clear correspondence between the four galaxy populations identified through the SPCA analysis with distinct spectral classes and luminosity states strongly suggests that some physical parameter controls the relative dominance and evolutionary trajectory of the two principal energy mechanisms (star formation and black hole accretion) during the lifecycle of galaxies. What could that be?
Answer: gas content. Figure 5a shows that AGN-dominated galaxies (C3 and C4) exhibit a moderately strong relationship (Spearman correlation coefficient ) between the molecular gas fraction () and the Eddington ratio, such that more gas results in higher levels of black hole accretion. Seyferts (C3) possess roughly twice as much molecular gas as LINERs (C4). Thus, while the quiescence of LINERs has been attributed to their radiatively inefficient central engines (Ho 2008; Ho 2009b), their host galaxies also suffer from a starvation diet. The sizable scatter in Figure 5a cautions that the causal link between global gas supply and black hole feeding is not one-to-one, but likely stochastic (Hopkins & Hernquist 2006; Novak et al. 2011; Yuan et al. 2018). After all, galaxies in C2 and C3 enjoy similar gas reservoirs (%) and yet those in C3 have higher ; likewise, C1 is more gas-rich than C3 despite having lower on average.
As expected (Genzel et al. 2015; Saintonge et al. 2017), the specific SFR (SSFR SFR/) of star-forming galaxies scales with . But so, too, do the hosts of bright AGNs (C3), which completely overlap with galaxies with moderate levels of star formation (C2) that lie at the lower end of the blue cloud or main sequence (Figure 5b). Indeed, the trend continues to hold even for gas-poor passive galaxies (C4). The observation that AGNs preferentially sit below the main sequence has been routinely (mis)interpreted as evidence for AGN feedback (Schawinski et al. 2007; Leslie et al. 2016, e.g.,). That C2 and C3 have similar and SSFR, despite their difference in nuclear activity, argues against instantaneous negative AGN feedback, perhaps contravening the idea that AGN-driven outflows remove large amounts of gas from galaxies in a short period of time. Galaxies in C1 to C3 likely evolve to C4 when star formation depletes their gas on a timescale Gyr. Galaxies in C3 and C2 have median (16%, 84%) depletions times and , respectively. The amount of gas needed to power the Seyfert activity observed in C3 is small ( yr-1), and even continuous accretion onto the black hole would not deplete gas in several Gyr. AGN-driven outflows with mass outflow rates of several yr-1 can do the job, but the mass outflow rate is highly uncertain (Harrison et al. 2018) and difficult to estimate. Fluetsch et al. 2019 found depletion times of molecular gas between few times and yr for small samples of local AGNs.
Black hole accretion and star formation are closely intertwined but not coeval. The significant scatter in the –H diagram (Figure 5c) requires a bursty SFH (Kauffmann et al. 2003). Our toy stellar population models can reproduce the data with recent bursts with mass fractions of superposed on an underlying old population. The AGN activity may be linked but delayed with respect to the most recent burst (Kauffmann et al. 2003; Yesuf et al. 2014) by Myr (Davies et al. 2007; Wild et al. 2010; Yesuf et al. 2014). This is corroborated by the clear separation of the distributions of and H for C1 and C3. The time delay can be attributed to stellar feedback or dynamical and viscous lags experienced by the gas as it journeys from kpc scales en route to the central black hole (Wild et al. 2010; Hopkins 2012; Blank & Duschl 2016).
Tables 2 provides summary statistics for the distributions of H/H, gas mass, gas fraction, SFR, the 4000 Å break, morphological parameters, and the numbers of galaxies in the five clusters for each of the four samples. As expected, for a given cluster, SFRs and molecular gas masses increase and gas fractions decrease as the mass range of the sample increases. C2 and C3 have similar gas, stellar and structural properties in all four samples. Their gas mass is . This indicates that AGN feedback does not significantly impact cold gas content of galaxies instantaneously. Substantial amounts of cold gas still remain in strong AGNs. Note that the total gas mass, including H I, is likely (Catinella et al. 2018).


=6cm {rotatetable*}
| Sample | Cluster | H/H | H | Sérsic | Gal. | |||||||
|---|---|---|---|---|---|---|---|---|---|---|---|---|
| (1) | (2) | (3) | (4) | (5) | (6) | (7) | (8) | (9) | (10) | (11) | (12) | (13) |
| C0a | 1478 | |||||||||||
| C0b | 1729 | |||||||||||
| S1 | C1 | 938 | ||||||||||
| C2 | 1139 | |||||||||||
| C3 | 301 | |||||||||||
| C4 | 385 | |||||||||||
| C0 | 2824 | |||||||||||
| C1 | 2374 | |||||||||||
| S2 | C2 | 1808 | ||||||||||
| C3 | 699 | |||||||||||
| C4 | 796 | |||||||||||
| C0 | 2509 | |||||||||||
| C1 | 1991 | |||||||||||
| S3 | C2 | 1969 | ||||||||||
| C3 | 1061 | |||||||||||
| C4 | 1345 | |||||||||||
| C0 | 861 | |||||||||||
| C1 | 758 | |||||||||||
| S4 | C3 | 487 | ||||||||||
| C4a/C2 | 803 | |||||||||||
| C4b | 883 |
Note. — (1) Narrow mass samples. (2) Cluster names from the SPCA+clustering analysis. (3) Balmer decrement. (4) Molecular gas mass in (5) Gas fraction, . (6) Star formation rate in . (7) The 4000 Å break. (8) The equivalent width of H absorption in Å. (9) Concentration index, , (10) Stellar velocity dispersion in km s-1. (11) Global Sérsic index. (12) Stellar mass density in (13) Number of galaxies in a cluster. We use the notation to denote median (50%), , and of a distribution.
Table 3 presents the Spearman correlation coefficients () for the quantities plotted in Figure 5 and for the four samples. We provide values of the relations including all four clusters, only the AGN-dominated clusters C3 and C4, and only using AGNs classification according to Figure 4. In all four samples, AGNs show moderate () correlations between and SSFR, and between and .
IV DISCUSSION
IV.1 Strong AGNs are gas-rich and dusty
In Yesuf & Ho 2019, we showed that dust absorption is a dirt-cheap method to estimate molecular gas masses for large samples of galaxies. This method can be applied to a variety of problems. Here, we use it to study central, massive galaxies in narrow stellar mass ranges in order to identify galaxy populations that are likely to be evolutionarily related. We identify four galaxy groups that can be evolutionarily linked through a lifecycle wherein gas content modulates their SFR and level of AGN activity. We find that strongly accreting black holes (Seyferts) live in gas-rich, young, and star-forming hosts, unlike their weakly accreting counterparts (LINERs). Thus, we do not find evidence for rapid or instantaneous impact of AGN feedback on the molecular gas and dust in nearby galaxies. Our result supports the observational (Netzer 2009; Diamond-Stanic & Rieke 2012; Esquej et al. 2014; Delvecchio et al. 2015; Izumi et al. 2016; Shimizu et al. 2017; Shangguan et al. 2020; Zhuang & Ho 2020) and theoretical (Hopkins & Quataert 2010; Thacker et al. 2014; Volonteri et al. 2015; McAlpine et al. 2017) claim that strong AGNs co-habitate in (gas-rich) star-forming galaxies.
In a companion paper (Yesuf & Ho 2020, submitted), we also apply our method to study a large sample of post-starburst galaxies (PSBs). They are rare but important class of galaxies that are rapidly quenching. We find that large reservoirs of molecular gas are present in significant numbers of post-starburst AGNs, and that they are not removed or destroyed by AGN feedback in some PSBs. Next, we discuss the nature of outflows in the AGNs in the current sample, and whether AGNs are preferentially powered by bar-driven inflows.
IV.2 AGN-driven outflows
Simulations have shown that AGN feedback may drive strong outflows with little impact on the dense gas in the galaxy disk (Gabor & Bournaud 2014; Roos et al. 2015). AGNs mainly affect the diffuse gas in the interstellar and CGM. AGN-driven outflows in these simulations do not cause rapid quenching of star formation, but they may remove significant amounts of gas over long timescales ( yr). It is widely accepted that AGN feedback plays an important role in keeping the CGM hot and in maintaining long-term quenching (Croton et al. 2006; Fabian 2012). Although based on small samples and uncertain assumptions, Fluetsch et al. 2019 found a scaling relation with the bolometric luminosity of AGN or SFR that predict average gas outflow rates in AGN hosts. Using these relations with median yr-1 = 0.3 or median , we estimate an outflow rate for the C3 cluster in the S2 sample of yr-1 or yr-1, respectively. These estimates seem too high for the observed change in gas mass from C3 to C4 of . If the average time between C3 and C4 is years, then the AGN outflow rate is yr-1, even ignoring the gas consumption by a SFR of yr-1. Modeling the observed SFR by a SFH with Myr, . Likewise, in rapidly quenching galaxies, the time interval between the Seyfert and LINER post-starburst phases is yr (Yesuf et al. 2014). Furthermore, the AGN lifetime is likely yrs for AGNs similar to those in C3 (Martini & Weinberg 2001; Gonçalves et al. 2008; Hopkins & Hernquist 2009; Borisova et al. 2016). Thus, while the current work cannot rule out significant gas loss due to AGN-driven outflows, we do not find a compelling reason to invoke it, in addition to gas consumption by star formation. Likewise, Jarvis et al. 2020 recently showed that some type 2 quasars with strong, kpc-scale ionized gas outflows and jets are star-forming and gas rich, and that there is no evidence for immediate appreciable impact of AGN feedback on the global molecular gas reservoirs of these powerful AGNs. Next, we briefly discuss the role of AGNs in regulating new gas accretion according to cosmological simulations (Davies et al. 2020; Oppenheimer et al. 2020; Terrazas et al. 2020; Zinger et al. 2020).
| Sample | vs. SSFR | vs. |
|---|---|---|
| S1 without C0 | 0.45 | |
| S2 without C0 | 0.54 | |
| S3 without C0 | 0.63 | |
| S4 without C0 | 0.66 | |
| S1 C3 and C4 only | 0.44 | 0.57 |
| S2 C3 and C4 only | 0.51 | 0.61 |
| S3 C3 and C4 only | 0.54 | 0.66 |
| S4 C3 and C4b only | 0.59 | 0.73 |
| S4 C3, C4a and C4b only | 0.51 | 0.66 |
| S1 AGNs only | 0.44 | 0.62 |
| S2 AGNs only | 0.47 | 0.60 |
| S3 AGNs only | 0.48 | 0.63 |
| S4 AGNs only | 0.49 | 0.70 |

Although there are quantitative differences between them, both EAGLE and TNG simulations indicate that the expulsion of rapidly cooling gas may lead to a long CGM cooling time, effectively depleting the halo of gas that would otherwise replenish the interstellar medium and fuel future star formation (Davies et al. 2020). In both sets of simulations, central halos with high CGM gas fractions () preferentially host galaxies that are more star-forming and have greater rotational support than typical halos. In addition, halos with lower at fixed mass have more massive black holes and higher ratios of cumulative black hole feedback energy to halo binding energy (Oppenheimer et al. 2020; Terrazas et al. 2020). At a fixed halo mass, is lower in the EAGLE simulations because the black holes, which are hosted by early-assembled halos, reach high accretion rates sooner. In contrast, in TNG simulations is lower at fixed mass when the central black holes reach the mass threshold at which AGN feedback switches from the thermal to kinetic mode. In EAGLE simulations, the scatter about the median is not correlated with the AGN luminosity/accretion rate, but TNG simulations predict strong correlation between these quantities, especially for the characteristic halo mass . How these differences translate to the molecular gas in the interstellar medium and which simulations agree better with the trends presented in this work are yet to be seen in future studies. To interpret our results in the meantime, both simulations indicate that the CGM cooling times for the present-day galaxies near the characteristic mass are Gyr (Davies et al. 2020; Zinger et al. 2020). Hence, it may be assumed that the net inflow rates to the interstellar medium are not changing rapidly as local massive galaxies quench. The evolution of gas fraction already in the interstellar medium governs the observed rates of star formation and black hole accretion.
IV.3 The effect of galactic bars
Stellar bars can efficiently transfer angular momentum and instigate radial inflow of gas to trigger nuclear activity (Shlosman et al. 1989). However, the four evolutionary classes defined in our study have similar bar fractions (Table 4). Within sample S2, the bar fractions are for clusters C1 to C3, for C4, and for C0. Bar classifications using low resolution images are highly uncertain. The values of may increase by up to % for . Similar to our results, previous attempts to connect AGN fueling to bars have yielded negative (Ho et al. 1997b; Cisternas et al. 2013; Cheung et al. 2015; Galloway et al. 2015; Goulding et al. 2017; Neumann et al. 2019) or at best ambiguous (Laine et al. 2002; Alonso et al. 2018) results.
IV.4 Caveats
Our method can only predict gas masses within a factor of 2.5 (Yesuf & Ho 2019). For this reason, the intrinsic correlation of AGN activity or star formation with gas fraction may be stronger than reported here. Furthermore, we can only estimate the global gas content. We do not have information on the interstellar medium on nuclear scales. Lastly, our current study does not include quasars and unobscured, type 1 AGNs. It is unclear whether our main conclusions extend to these AGN populations. We should bear in mind, however, that a recent far-infrared study indicates that the gas content of the host galaxies of type 1 and type 2 quasars are similar, and neither type is gas-deficient relative to normal, inactive galaxies (Shangguan & Ho 2019). This is supported by the work of Zhuang & Ho 2020, which is also based on the method of Yesuf & Ho 2019.
| Sample | Clusters | () | |
|---|---|---|---|
| C0a | |||
| C0b | |||
| S1 | C1 | ||
| C2 | |||
| C3 | |||
| C4 | |||
| C0 | |||
| C1 | |||
| S2 | C2 | ||
| C3 | |||
| C4 | |||
| C0 | |||
| C1 | |||
| S3 | C2 | ||
| C3 | |||
| C4 | |||
| C0 | |||
| C1 | |||
| S4 | C3 | ||
| C4a/C2 | |||
| C4b |
V SUMMARY AND CONCLUSIONS
Utilizing our recent method to estimate the molecular gas mass using dust absorption (Yesuf & Ho 2019), we study the connection between gas content, star formation, and black hole accretion in face-on, central galaxies at and with stellar mass . Principal component and clustering analysis of a large number of physical observables reveal four populations of galaxies that are evolutionarily linked.
Figure 6 presents a schematic, unifying picture of how the availability of interstellar gas affects the joint evolution of star formation and black hole accretion. Gas-rich galaxies first consume their fuel through vigorous star formation (C1). This is followed by an intermediate phase during which moderate gas supply sustains a reduced rate of star formation (C2) in concert with strong Seyfert activity mediated by stochastic accretion (C3). AGN feedback, however, does not seem to have instantaneous, observable effects on the molecular gas content or SFR. Finally, gas exhaustion extinguishes star formation and reduces black hole accretion to the levels seen in LINERs (C4).
AGN-dominated galaxies (C3 and C4) exhibit a moderately strong relationship (Spearman ) between the molecular gas fraction and the Eddington ratio, such that more gas results in higher levels of black hole accretion. Seyferts live in young, star-forming, and gas-rich () hosts, with median (16%, 84%) depletion times .
Our study adopts a data-driven approach and is not meant to test specific AGN feedback models. Future comparisons with our results may be useful to discriminate between different models. Our results would be inconsistent with AGN feedback models that predict that central, bulge-dominated, Seyfert-like AGNs in massive galaxies have significantly lower molecular gas fractions compared to inactive galaxies of similar mass, morphology, and SFR. In addition, future observational work can expand upon the current work by (1) directly measuring the molecular gas masses in a carefully selected, representative sample of galaxies (including low-luminosity AGNs and low-SFR AGNs) and repeating the correlations reported here, (2) estimating resolved gas masses either directly or indirectly and studying the effects of AGNs on the gas in nuclear regions, (3) using hard X-ray luminosity, which is less affected by strong star formation, instead of as a proxy for black hole accretion rate, and (4) utilizing bar classifications based on higher resolution images than those provided by SDSS to robustly study the connection between AGN fueling and bars.
References
- Abazajian et al. (2009) Abazajian, K. N., Adelman-McCarthy, J. K., Agüeros, M. A., et al. 2009, ApJS, 182, 543
- Alam et al. (2015) Alam, S., Albareti, F. D., Allende Prieto, C., et al. 2015, ApJS, 219, 12
- Alonso et al. (2018) Alonso, S., Coldwell, G., Duplancic, F., Mesa, V., & Lambas, D. G. 2018, A&A, 618, A149
- Audibert et al. (2019) Audibert, A., Combes, F., García-Burillo, S., et al. 2019, A&A, 632, A33
- Baldwin et al. (1981) Baldwin, J. A., Phillips, M. M., & Terlevich, R. 1981, Publications of the Astronomical Society of the Pacific, 93, 5
- Balogh et al. (1999) Balogh, M. L., Morris, S. L., Yee, H. K. C., Carlberg, R. G., & Ellingson, E. 1999, ApJ, 527, 54
- Bertram et al. (2007) Bertram, T., Eckart, A., Fischer, S., et al. 2007, A&A, 470, 571
- Blank & Duschl (2016) Blank, M., & Duschl, W. J. 2016, MNRAS, 462, 2246
- Borisova et al. (2016) Borisova, E., Lilly, S. J., Cantalupo, S., et al. 2016, ApJ, 830, 120
- Bower et al. (2017) Bower, R. G., Schaye, J., Frenk, C. S., et al. 2017, MNRAS, 465, 32
- Brooks & Christensen (2016) Brooks, A., & Christensen, C. 2016, Galactic Bulges, 418, 317
- Brusa et al. (2015) Brusa, M., Feruglio, C., Cresci, G., et al. 2015, A&A, 578, A11
- Bruzual & Charlot (2003) Bruzual, G., & Charlot, S. 2003, MNRAS, 344, 1000
- Catinella et al. (2018) Catinella, B., Saintonge, A., Janowiecki, S., et al. 2018, MNRAS, 476, 875
- Chabrier (2003) Chabrier, G. 2003, PASP, 115, 763
- Charlot & Fall (2000) Charlot, S., & Fall, S. M. 2000, ApJ, 539, 718
- Cheung et al. (2015) Cheung, E., Trump, J. R., Athanassoula, E., et al. 2015, MNRAS, 447, 506
- Choi et al. (2018) Choi, E., Somerville, R. S., Ostriker, J. P., Naab, T., & Hirschmann, M. 2018, ApJ, 866, 91
- Cisternas et al. (2013) Cisternas, M., Gadotti, D. A., Knapen, J. H., et al. 2013, ApJ, 776, 50
- Correa et al. (2019) Correa, C. A., Schaye, J., & Trayford, J. W. 2019, MNRAS, 484, 4401
- Croton et al. (2006) Croton, D. J., Springel, V., White, S. D. M., et al. 2006, MNRAS, 365, 11
- Davies et al. (2020) Davies, J. J., Crain, R. A., Oppenheimer, B. D., & Schaye, J. 2020, MNRAS, 491, 4462
- Davies et al. (2007) Davies, R. I., Müller Sánchez, F., Genzel, R., et al. 2007, ApJ, 671, 1388
- de Souza et al. (2017) de Souza, R. S., Dantas, M. L. L., Costa-Duarte, M. V., et al. 2017, MNRAS, 472, 2808
- Dekel & Birnboim (2006) Dekel, A., & Birnboim, Y. 2006, MNRAS, 368, 2
- Dekel & Silk (1986) Dekel, A., & Silk, J. 1986, ApJ, 303, 39
- Delvecchio et al. (2015) Delvecchio, I., Lutz, D., Berta, S., et al. 2015, MNRAS, 449, 373
- Di Matteo et al. (2005) Di Matteo, T., Springel, V., & Hernquist, L. 2005, Nature, 433, 604
- Diamond-Stanic & Rieke (2012) Diamond-Stanic, A. M., & Rieke, G. H. 2012, ApJ, 746, 168
- Domínguez Sánchez et al. (2018) Domínguez Sánchez, H., Huertas-Company, M., Bernardi, M., Tuccillo, D., & Fischer, J. L. 2018, MNRAS, 476, 3661
- Dubois et al. (2016) Dubois, Y., Peirani, S., Pichon, C., et al. 2016, MNRAS, 463, 3948
- Ellison et al. (2019) Ellison, S. L., Brown, T., Catinella, B., & Cortese, L. 2019, MNRAS, 482, 5694
- Erichson et al. (2018) Erichson, N. B., Zheng, P., Manohar, K., et al. 2018, arXiv e-prints, arXiv:1804.00341
- Esquej et al. (2014) Esquej, P., Alonso-Herrero, A., González-Martín, O., et al. 2014, ApJ, 780, 86
- Fabello et al. (2011) Fabello, S., Kauffmann, G., Catinella, B., et al. 2011, MNRAS, 416, 1739
- Fabian (2012) Fabian, A. C. 2012, ARA&A, 50, 455
- Fang et al. (2013) Fang, J. J., Faber, S. M., Koo, D. C., & Dekel, A. 2013, ApJ, 776, 63
- Ferland & Netzer (1983) Ferland, G. J., & Netzer, H. 1983, ApJ, 264, 105
- Fiore et al. (2017) Fiore, F., Feruglio, C., Shankar, F., et al. 2017, A&A, 601, A143
- Fluetsch et al. (2019) Fluetsch, A., Maiolino, R., Carniani, S., et al. 2019, MNRAS, 483, 4586
- Gabor & Bournaud (2014) Gabor, J. M., & Bournaud, F. 2014, MNRAS, 441, 1615
- Galloway et al. (2015) Galloway, M. A., Willett, K. W., Fortson, L. F., et al. 2015, MNRAS, 448, 3442
- Gaskell & Ferland (1984) Gaskell, C. M., & Ferland, G. J. 1984, Publications of the Astronomical Society of the Pacific, 96, 393
- Genzel et al. (2015) Genzel, R., Tacconi, L. J., Lutz, D., et al. 2015, ApJ, 800, 20
- Geréb et al. (2015) Geréb, K., Morganti, R., Oosterloo, T. A., Hoppmann, L., & Staveley-Smith, L. 2015, A&A, 580, A43
- Gonçalves et al. (2008) Gonçalves, T. S., Steidel, C. C., & Pettini, M. 2008, ApJ, 676, 816
- Goulding et al. (2017) Goulding, A. D., Matthaey, E., Greene, J. E., et al. 2017, ApJ, 843, 135
- Greene & Ho (2005) Greene, J. E., & Ho, L. C. 2005, ApJ, 627, 721
- Greene & Ho (2007) —. 2007, ApJ, 667, 131
- Haan et al. (2008) Haan, S., Schinnerer, E., Mundell, C. G., García-Burillo, S., & Combes, F. 2008, AJ, 135, 232
- Habouzit et al. (2019) Habouzit, M., Genel, S., Somerville, R. S., et al. 2019, MNRAS, 484, 4413
- Hahn et al. (2017) Hahn, C., Tinker, J. L., & Wetzel, A. 2017, ApJ, 841, 6
- Harrison (2017) Harrison, C. M. 2017, Nature Astronomy, 1, 0165
- Harrison et al. (2018) Harrison, C. M., Costa, T., Tadhunter, C. N., et al. 2018, NatAs, 2, 198
- Heckman et al. (2004) Heckman, T. M., Kauffmann, G., Brinchmann, J., et al. 2004, ApJ, 613, 109
- Ho (2008) Ho, L. C. 2008, ARA&A, 46, 475
- Ho (2009a) —. 2009a, ApJ, 699, 638
- Ho (2009b) —. 2009b, ApJ, 699, 626
- Ho et al. (2008) Ho, L. C., Darling, J., & Greene, J. E. 2008, ApJS, 177, 103
- Ho et al. (1993) Ho, L. C., Filippenko, A. V., & Sargent, W. L. W. 1993, ApJ, 417, 63
- Ho et al. (1997a) —. 1997a, ApJS, 112, 315
- Ho et al. (1997b) —. 1997b, ApJ, 487, 591
- Ho et al. (2003) —. 2003, ApJ, 583, 159
- Hopkins (2012) Hopkins, P. F. 2012, MNRAS, 420, L8
- Hopkins & Hernquist (2006) Hopkins, P. F., & Hernquist, L. 2006, ApJS, 166, 1
- Hopkins & Hernquist (2009) —. 2009, ApJ, 698, 1550
- Hopkins et al. (2006) Hopkins, P. F., Hernquist, L., Cox, T. J., et al. 2006, ApJS, 163, 1
- Hopkins & Quataert (2010) Hopkins, P. F., & Quataert, E. 2010, MNRAS, 407, 1529
- Husemann et al. (2017) Husemann, B., Davis, T. A., Jahnke, K., et al. 2017, MNRAS, 470, 1570
- Izumi et al. (2016) Izumi, T., Kawakatu, N., & Kohno, K. 2016, ApJ, 827, 81
- Jarvis et al. (2020) Jarvis, M. E., Harrison, C. M., Mainieri, V., et al. 2020, arXiv e-prints, arXiv:2007.10351
- Kakkad et al. (2017) Kakkad, D., Mainieri, V., Brusa, M., et al. 2017, MNRAS, 468, 4205
- Kauffmann et al. (2003) Kauffmann, G., Heckman, T. M., Tremonti, C., et al. 2003, MNRAS, 346, 1055
- Kewley et al. (2001) Kewley, L. J., Dopita, M. A., Sutherland, R. S., Heisler, C. A., & Trevena, J. 2001, ApJ, 556, 121
- Kewley et al. (2006) Kewley, L. J., Groves, B., Kauffmann, G., & Heckman, T. 2006, MNRAS, 372, 961
- Kong & Ho (2018) Kong, M., & Ho, L. C. 2018, ApJ, 859, 116
- Kormendy & Ho (2013) Kormendy, J., & Ho, L. C. 2013, ARA&A, 51, 511
- Kormendy & Kennicutt (2004) Kormendy, J., & Kennicutt, Robert C., J. 2004, ARA&A, 42, 603
- Laine et al. (2002) Laine, S., Shlosman, I., Knapen, J. H., & Peletier, R. F. 2002, ApJ, 567, 97
- Leslie et al. (2016) Leslie, S. K., Kewley, L. J., Sanders, D. B., & Lee, N. 2016, MNRAS, 455, L82
- Lim et al. (2017) Lim, S. H., Mo, H. J., Lu, Y., Wang, H., & Yang, X. 2017, MNRAS, 470, 2982
- Maiolino et al. (1997) Maiolino, R., Ruiz, M., Rieke, G. H., & Papadopoulos, P. 1997, ApJ, 485, 552
- Martig et al. (2009) Martig, M., Bournaud, F., Teyssier, R., & Dekel, A. 2009, ApJ, 707, 250
- Martini & Weinberg (2001) Martini, P., & Weinberg, D. H. 2001, ApJ, 547, 12
- McAlpine et al. (2017) McAlpine, S., Bower, R. G., Harrison, C. M., et al. 2017, MNRAS, 468, 3395
- Mitchell et al. (2020) Mitchell, P. D., Schaye, J., Bower, R. G., & Crain, R. A. 2020, MNRAS, 494, 3971
- Nair & Abraham (2010) Nair, P. B., & Abraham, R. G. 2010, ApJ, 714, L260
- Nelson et al. (2019) Nelson, D., Pillepich, A., Springel, V., et al. 2019, MNRAS, 490, 3234
- Netzer (2009) Netzer, H. 2009, MNRAS, 399, 1907
- Neumann et al. (2019) Neumann, J., Gadotti, D. A., Wisotzki, L., et al. 2019, A&A, 627, A26
- Novak et al. (2011) Novak, G. S., Ostriker, J. P., & Ciotti, L. 2011, ApJ, 737, 26
- Oppenheimer et al. (2020) Oppenheimer, B. D., Davies, J. J., Crain, R. A., et al. 2020, MNRAS, 491, 2939
- Peng et al. (2015) Peng, Y., Maiolino, R., & Cochrane, R. 2015, Nature, 521, 192
- Peng et al. (2010) Peng, Y.-j., Lilly, S. J., Kovač, K., et al. 2010, ApJ, 721, 193
- Perna et al. (2018) Perna, M., Sargent, M. T., Brusa, M., et al. 2018, A&A, 619, A90
- Pillepich et al. (2018) Pillepich, A., Springel, V., Nelson, D., et al. 2018, MNRAS, 473, 4077
- Rodriguez-Gomez et al. (2015) Rodriguez-Gomez, V., Genel, S., Vogelsberger, M., et al. 2015, MNRAS, 449, 49
- Roos et al. (2015) Roos, O., Juneau, S., Bournaud, F., & Gabor, J. M. 2015, ApJ, 800, 19
- Rosario et al. (2018) Rosario, D. J., Burtscher, L., Davies, R. I., et al. 2018, MNRAS, 473, 5658
- Saintonge et al. (2017) Saintonge, A., Catinella, B., Tacconi, L. J., et al. 2017, ApJS, 233, 22
- Salim et al. (2018) Salim, S., Boquien, M., & Lee, J. C. 2018, ApJ, 859, 11
- Salim et al. (2016) Salim, S., Lee, J. C., Janowiecki, S., et al. 2016, ApJS, 227, 2
- Schawinski et al. (2007) Schawinski, K., Thomas, D., Sarzi, M., et al. 2007, MNRAS, 382, 1415
- Schaye et al. (2015) Schaye, J., Crain, R. A., Bower, R. G., et al. 2015, MNRAS, 446, 521
- Scholtz et al. (2018) Scholtz, J., Alexander, D. M., Harrison, C. M., et al. 2018, MNRAS, 475, 1288
- Schulze et al. (2019) Schulze, A., Silverman, J. D., Daddi, E., et al. 2019, MNRAS, 488, 1180
- Shangguan & Ho (2019) Shangguan, J., & Ho, L. C. 2019, ApJ, 873, 90
- Shangguan et al. (2020) Shangguan, J., Ho, L. C., Bauer, F. E., Wang, R., & Treister, E. 2020, arXiv e-prints, arXiv:2007.11286
- Shangguan et al. (2018) Shangguan, J., Ho, L. C., & Xie, Y. 2018, ApJ, 854, 158
- Shimizu et al. (2017) Shimizu, T. T., Mushotzky, R. F., Meléndez, M., et al. 2017, MNRAS, 466, 3161
- Shlosman et al. (1989) Shlosman, I., Frank, J., & Begelman, M. C. 1989, Nature, 338, 45
- Silk & Rees (1998) Silk, J., & Rees, M. J. 1998, A&A, 331, L1
- Simard et al. (2011) Simard, L., Mendel, J. T., Patton, D. R., Ellison, S. L., & McConnachie, A. W. 2011, ApJS, 196, 11
- Tacchella et al. (2016) Tacchella, S., Dekel, A., Carollo, C. M., et al. 2016, MNRAS, 457, 2790
- Terrazas et al. (2020) Terrazas, B. A., Bell, E. F., Pillepich, A., et al. 2020, MNRAS, 493, 1888
- Thacker et al. (2014) Thacker, R. J., MacMackin, C., Wurster, J., & Hobbs, A. 2014, MNRAS, 443, 1125
- Trayford et al. (2016) Trayford, J. W., Theuns, T., Bower, R. G., et al. 2016, MNRAS, 460, 3925
- Tremonti et al. (2004) Tremonti, C. A., Heckman, T. M., Kauffmann, G., et al. 2004, ApJ, 613, 898
- Veilleux & Osterbrock (1987) Veilleux, S., & Osterbrock, D. E. 1987, ApJS, 63, 295
- Volonteri et al. (2015) Volonteri, M., Capelo, P. R., Netzer, H., et al. 2015, MNRAS, 449, 1470
- Weinberger et al. (2017) Weinberger, R., Springel, V., Hernquist, L., et al. 2017, MNRAS, 465, 3291
- Wild et al. (2010) Wild, V., Heckman, T., & Charlot, S. 2010, MNRAS, 405, 933
- Wild et al. (2011) Wild, V., Groves, B., Heckman, T., et al. 2011, MNRAS, 410, 1593
- Yang et al. (2007) Yang, X., Mo, H. J., van den Bosch, F. C., et al. 2007, ApJ, 671, 153
- Yesuf et al. (2020a) Yesuf, H. M., Faber, S. M., Koo, D. C., & Lee, L. L. 2020a, MNRAS, submitted, arXiv:1706.09500
- Yesuf et al. (2020b) Yesuf, H. M., Faber, S. M., Koo, D. C., et al. 2020b, ApJ, 889, 14
- Yesuf et al. (2014) Yesuf, H. M., Faber, S. M., Trump, J. R., et al. 2014, ApJ, 792, 84
- Yesuf et al. (2017a) Yesuf, H. M., French, K. D., Faber, S. M., & Koo, D. C. 2017a, MNRAS, 469, 3015
- Yesuf & Ho (2019) Yesuf, H. M., & Ho, L. C. 2019, ApJ, 884, 177
- Yesuf et al. (2017b) Yesuf, H. M., Koo, D. C., Faber, S. M., et al. 2017b, ApJ, 841, 83
- Yuan et al. (2018) Yuan, F., Yoon, D., Li, Y.-P., et al. 2018, ApJ, 857, 121
- Zhuang & Ho (2019) Zhuang, M.-Y., & Ho, L. C. 2019, ApJ, 882, 89
- Zhuang & Ho (2020) —. 2020, ApJ, 896, 108
- Zinger et al. (2020) Zinger, E., Pillepich, A., Nelson, D., et al. 2020, arXiv e-prints, arXiv:2004.06132
- Zolotov et al. (2015) Zolotov, A., Dekel, A., Mandelker, N., et al. 2015, MNRAS, 450, 2327
- Zou et al. (2006) Zou, H., Hastie, T., & Tibshirani, R. 2006, Journal of Computational and Graphical Statistics, 15, 265
Appendix A Additional diagnostics
For completeness, Figure 7 plots the [N II] /H and [S II] /H diagrams (Kewley et al. 2001; Kauffmann et al. 2003; Kewley et al. 2006; Schawinski et al. 2007) color-coded by the four clusters. The results are similar to Figure 4a. AGN-dominated galaxies occupy the upper-right corners of the diagrams, while star-forming galaxies occupy the lower-left corners. In the [N II]/H diagram, composite/transition galaxies with some mixture of AGN and star formation activity lie in between (Ho et al. 1993). The composite region is populated by all four classes. In other words, composite galaxies are heterogeneous and span a wide range in star formation, age, and gas content.
Figure 8a shows that, overall, the stellar velocity dispersion is correlated () with gas velocity dispersion measured using all forbidden lines simultaneously. We simply denote it as . This correlation is also observed in previous work (Greene & Ho 2005; Ho 2009a). Galaxies in C3, however, exhibit more turbulent gas motions relative to their stellar velocity dispersions. This may be due to AGN-driven outflows (Ho 2009a; Kong & Ho 2018), which are commonly observed in AGN hosts (see Fiore et al. 2017; Yesuf et al. 2017b; Harrison et al. 2018; Yesuf et al. 2020a, and references therein). However, without spatially resolved kinematics, the possibility of inflows of low-angular momentum gas powering nuclear activity in C3 galaxies cannot be ruled out (Ho et al. 2003). High spatial resolution data show that both inflow and outflow can co-exist in the same AGN host (Audibert et al. 2019). The fact that the distributions of stellar velocity dispersions for the four clusters are similar implies that their black hole mass distributions are similar (Kormendy & Ho 2013). Their inferred median (16%, 84%) black hole mass is .
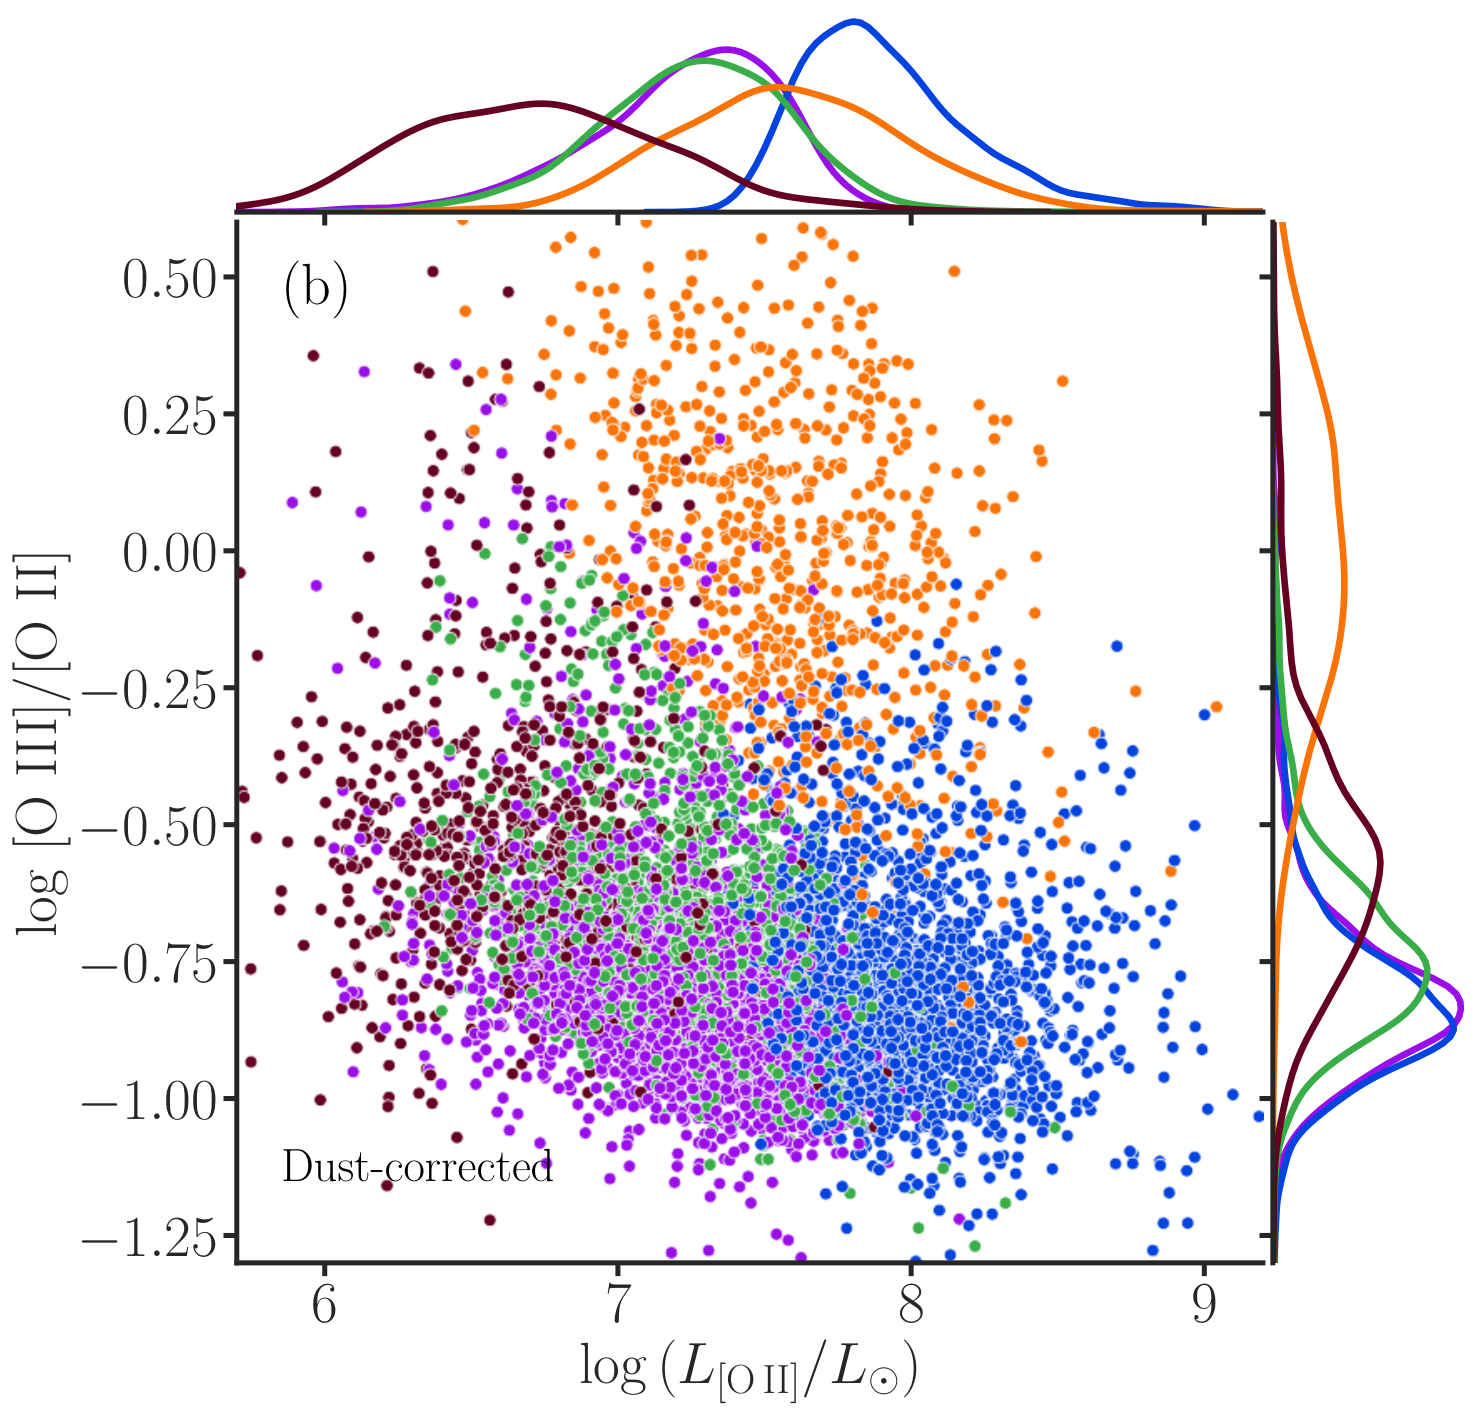
Figure 8b shows dust-corrected [O II] luminosity and [O III]/[O II] ratio. This figure aims to particularly show that the [O II] and [O III] luminosities of C1 galaxies are consistent with ionization by newly formed, massive stars, and that the [O II] luminosities of these galaxies agree with the expectation from their SFRs (Zhuang & Ho 2019) given in Table 2.