Magnetic Reconnection During the Post-Impulsive Phase of a Long-Duration Solar Flare: Bi-Directional Outflows as a Cause of Microwave and X-ray BurstsJournal: ApJFacilities: OVRO:SA, SDO, SoHO, K-Cor, RHESSI, Fermi
Abstract
Magnetic reconnection plays a crucial role in powering solar flares, production of energetic particles, and plasma heating. However, where the magnetic reconnections occur, how and where the released magnetic energy is transported, and how it is converted to other forms remain unclear. Here we report recurring bi-directional plasma outflows located within a large-scale plasma sheet observed in extreme ultraviolet emission and scattered white light during the post-impulsive gradual phase of the X8.2 solar flare on 2017 September 10. Each of the bi-directional outflows originates in the plasma sheet from a discrete site, identified as a magnetic reconnection site. These reconnection sites reside at very low altitudes ( Mm, or 0.26 ) above the top of the flare arcade, a distance only 3% of the total length of a plasma sheet that extends to at least 10 . Each arrival of sunward outflows at the looptop region appears to coincide with an impulsive microwave and X-ray burst dominated by a hot source (10–20 MK) at the looptop, which is immediately followed by a nonthermal microwave burst located in the loopleg region. We propose that the reconnection outflows transport the magnetic energy released at localized magnetic reconnection sites outward in the form of kinetic energy flux and/or electromagnetic Poynting flux. The sunward-directed energy flux induces particle acceleration and plasma heating in the post-flare arcades, observed as the hot and nonthermal flare emissions.
Keywords:
Solar flares (1496), Solar coronal mass ejections (310), nonthermal radiation sources (1119), Solar magnetic reconnection (1504), Solar radio flares (1342)I Introduction
The most powerful explosive phenomena in the solar system, solar flares accompanied by plasma eruptions, are powered by magnetic energy release in the solar corona facilitated by fast magnetic reconnection. In the standard CSHKP model of eruptive solar flares (Carmichael 1964; Sturrock 1966; Hirayama 1974; Kopp & Pneuman 1976), reconnection occurs in the diffusion region of a reconnection current sheet (RCS) formed in the wake of the eruption of a magnetic flux rope. The latter, when observed by a coronagraph as a large-scale eruptive structure, is referred to as a coronal mass ejection (CME). At both sides of the RCS, magnetized plasma is drawn toward the RCS, where oppositely-directed magnetic fields reconnect, producing bi-directional plasma outflows along the RCS directed away from the reconnection site. Electrons and ions are accelerated at or in the close vicinity of the RCS to high energies (Masuda et al. 1994; Chen et al. 2018; Chen et al. 2020b; Fleishman et al. 2020). The downward propagating accelerated electrons arrive at the dense chromosphere and drive chromospheric evaporation. Hard X-ray (HXR) emission is produced at the footpoints of the newly reconnected magnetic loops via bremsstrahlung. The dense chromospheric plasma heated to 10 MK is driven upward by the over-pressure and fills the flare arcade, which produces intense emission in extreme ultraviolet (EUV) and soft X-ray (SXR) wavelengths.
The magnetic reconnection is a driver of the magnetic energy release. The released energy is converted to other forms of energy—bulk flows, heated plasma, and accelerated particles (Benz 2017, see, e.g., a review by ). Observational signatures of magnetic reconnection include -shaped (Su et al. 2013; Sun et al. 2015; Zhu et al. 2016) or -shaped (Shibata et al. 2007) magnetic field lines, fan-spine-type structures (Liu et al. 2009; Zeng et al. 2016), supra-arcade fan or outflows (McKenzie & Hudson 1999; Savage et al. 2010; Savage & McKenzie 2011; Reeves et al. 2017), and large-scale thin plasma-sheet-like structures (Reeves & Golub 2011; Savage et al. 2012; Warren et al. 2018; Cheng et al. 2018; Longcope et al. 2018; French et al. 2019; Chen et al. 2020b). However, details of the magnetic reconnection, the associated energy release, and its conversion have yet to be clarified.
Bi-directional plasma outflows help in probing the magnetic reconnection. The sunward (downward) reconnection outflows usually exhibit as supra-arcade plasma downflows or fast-contracting loops in EUV and SXR data (Forbes & Acton 1996; Reeves et al. 2008; Liu et al. 2013; Takasao et al. 2012; McKenzie & Hudson 1999). Anti-sunward (upward) outflows have also been reported trailing the erupting flux rope (Nishizuka et al. 2010; Chae et al. 2017; Cheng et al. 2018). Occasionally, both the upward and downward plasma outflows are observed simultaneously (Savage et al. 2010; Takasao et al. 2012; Liu et al. 2013), which allows pinpointing the reconnection site. A similar pinpointing of the reconnection site with a very high positional accuracy (of 1 Mm) has been achieved by Chen et al. 2018 using radio imaging spectroscopy observations of decimetric type III radio bursts.
These plasma outflows carry a significant energy in the form of bulk kinetic energy flux, enthalpy flux, and electromagnetic Poynting flux (Fletcher & Hudson 2008; Birn et al. 2009). To convert these forms of energy into that of accelerated particles and heated flare plasma, various mechanisms have been proposed involving turbulence or plasma waves (Hamilton & Petrosian 1992; Miller et al. 1996; Petrosian & Liu 2004; Liu et al. 2008; Liu et al. 2013; Fleishman & Toptygin 2013a; Fleishman et al. 2020), fast-mode termination shocks (Forbes 1986; Masuda et al. 1994; Tsuneta & Naito 1998; Guo & Giacalone 2012; Nishizuka & Shibata 2013; Takasao et al. 2015; Chen et al. 2015; Chen et al. 2019; Shen et al. 2018; Kong et al. 2019), collapsing magnetic traps formed by fast-contracting post-reconnection loops (Somov & Kosugi 1997; Karlický & Kosugi 2004; Giuliani et al. 2005; Karlický & Bárta 2006; Grady et al. 2012), magnetic islands (Drake et al. 2006; Oka et al. 2010), or Fermi-type acceleration from plasma compression (Li et al. 2018).

Occasionally, HXR (and sometimes -ray) sources are observed at or above the top of bright EUV/SXR flare arcades (Masuda et al. 1994; Battaglia & Benz 2006; Veronig et al. 2006; Krucker et al. 2008a; Krucker et al. 2008b; Krucker et al. 2010; Chen & Petrosian 2012; Simões & Kontar 2013; Liu et al. 2013; Krucker & Battaglia 2014; Dennis et al. 2018; Petrosian 2018). They have been regarded as an evidence of electron acceleration in the above-the-looptop (ALT) region (Battaglia & Benz 2006; Krucker et al. 2010; Chen & Petrosian 2013; Liu et al. 2013, e.g.,). Recently, microwave imaging spectroscopy data from the Expanded Owens Valley Solar Array (EOVSA) have offered unprecedented spatially- and temporally-resolved measurements of nonthermal electrons and magnetic field in the flaring region (Gary et al. 2018). Fleishman et al. 2020 reported a fast decay of magnetic field in the ALT region. Chen et al. 2020b found that this region coincides with a local minimum of magnetic field strength, referred to as a “magnetic bottle”, where microwave-emitting, mildly relativistic electrons are concentrated. These observations imply that the ALT region, where plasma outflows interact with the underlying flare arcade, plays a crucial role in magnetic energy release and electron acceleration. Reported temporal correlation between the outflows and impulsive X-ray and/or radio emission (Asai et al. 2004; Karlický & Bárta 2007; Nishizuka et al. 2010; Chen et al. 2015; Takasao et al. 2016) further supports the role of the plasma outflows.
In this study, we report well-connected signatures of magnetic reconnection, plasma heating, and electron acceleration observed during the post-impulsive gradual phase of the X8.2-class eruptive solar flare on 2017 September 10. The combined white light and EUV imaging observations allow us to identify the timing and location of multiple intermittent reconnection events by bi-directional plasma outflows in an extremely long plasma sheet. The arrivals of the plasma downflows at the looptop correlate with plasma heating events that manifest as impulsive X-ray bursts. In the meantime, nonthermal microwave bursts, obtained by EOVSA, are detected in the loopleg region, which have no response in RHESSI hard X-rays. Such a chain of reconnection-associated observational signatures offers a new view of the energy release and conversion processes with a level of clarity not previously achieved.
In Section 2.1, we present imaging spectroscopy observations of impulsive microwave and X-ray bursts in the flare looptop and arcade (Section 2.2). In Section 2.3, we examine the microwave and X-ray bursts using spectral analysis. In Section 2.4, we present the detection of multitudes of bi-directional plasma outflows using white light and EUV imaging data that appear to correlate with the microwave and X-ray bursts. We discuss the implications of the observational results in Section 3, particularly on the role of the plasma outflows in energy transport and conversion.
II Observations
The long-duration X8.2-class eruptive flare occurred close to the west solar limb on 2017 September 10. The event is associated with a fast white-light coronal mass ejection (CME), which has a speed of 4000 km (Gopalswamy et al. 2018) and is accompanied with a type II radio burst (Morosan et al. 2019). The eruption is well observed in microwaves by EOVSA (Gary et al. 2018) in 2.5–18 GHz, in EUV by the Atmospheric Imaging Assembly on board the Solar Dynamics Observatory (SDO/AIA; Lemen et al. 2012) and Solar Ultraviolet Imager on board the NOAA GOES-R satellite (Seaton & Darnel 2018), in white-light by the COSMO K-Coronagraph of the Mauna Loa Solar Observatory (MLSO/K-Cor; Elmore et al. 2003) and the Large Angle and Spectrometric Coronagraph Experiment on board the solar and heliospheric observatory (SoHO/LASCO; Brueckner et al. 1995), and in X-Rays by Reuven Ramaty High-Energy Solar Spectroscopic Imager (RHESSI; Lin et al. 2002) and the Gamma-ray Burst Monitor aboard the Fermi spacecraft (Fermi/GBM; Meegan et al. 2009).

The event began at 15:35 UT when a pre-existing filament started to erupt. After 15:50 UT, the erupting filament developed into a teardrop-shaped dark cavity as seen in SDO/AIA images (Yan et al. 2018; Veronig et al. 2018) and microwaves (Chen et al. 2020a). The acceleration of the flux rope peaked at around 15:54 UT (Veronig et al. 2018), which coincided with an early impulsive peak in microwaves and HXRs (Chen et al. 2020a). The main peak of the impulsive microwave/HXR emission occurred at around 16:00 UT (Gary et al. 2018; Fleishman et al. 2020). By 17:30 UT well into the decay phase of the event, the CME front has already propagated to more than 20 solar radii (R⊙) above the solar surface (Figure 1(a)). A long and thin plasma sheet structure is present in the wake of the CME above the flare arcade (Figure 1; see also Yan et al. 2018; Warren et al. 2018; Longcope et al. 2018; French et al. 2019; Chen et al. 2020b), which extends into the SOHO/LASCO C3 field of view with a total length of at least 8 (Cheng et al. 2018; Lee et al. 2020). A RHESSI 6–12 keV X-ray source is present at the looptop region (open contours in Fig. 1c). No footpoint X-ray source is detected at this time.
II.1 Impulsive Microwave and X-ray Bursts
An overview of the long-duration event based on EOVSA and RHESSI data was provided by Gary et al. 2018. More detailed studies of the flux rope morphology, magnetic field variation along the RCS feature, and magnetic field decay during the initial and main impulsive phase have been reported in our earlier publications (Chen et al. 2020a; Chen et al. 2020b; Fleishman et al. 2020). In this study, we focus on the post-impulsive, long-duration gradual phase between 16:20 and 20:15 UT (Fig. 2(b)), shortly after the main impulsive phase at 16:00 UT (c.f., Fig. 2(a), when the brightest microwave emission of over 10,000 solar flux unit, or sfu, is present). During this period, the EOVSA total-power (full-disk integrated) microwave dynamic spectrum contains multiple broadband bursts. These bursts have an impulsive appearance in the dynamic spectrum and light curves. The relative amplitudes of the bursts at 5 GHz, represented as the ratio of the peak brightness of each burst to the pre- and post-burst background , is between 1.5%–30% (solid curves in Fig. 2(b)). These bursts have an average duration of 4 minutes and an average recurrence period of 5.6 minutes. The individual microwave bursts correlate with weak X-ray bursts at 6–50 keV observed by RHESSI and at 15-100 keV by Fermi/GBM. The X-ray bursts, however, have very small amplitudes of only a few percent and can only be distinguished in the detrended light curves, after the slow-varying background has been removed (Fig. 2(c)). Some of the microwave bursts correspond to quasi-periodic impulsive peaks in the detrended GOES 1–8 Å SXR light curve after the slow-varying back-ground has been removed (Fig. 2(c)). The latter was reported in a recent paper by Hayes et al. 2019, who attributed these quasi-periodic features with a period of 150 seconds to magnetohydrodynamic (MHD) oscillations in the post-flare arcade.
To explore the temporal relation of the bursts seen in the X-rays and microwave quantitatively, we perform cross-correlation analysis between the detrended X-ray light curves obtained by RHESSI, Fermi, and GOES at a variety of energy ranges, and the detrended 5.0 GHz EOVSA light curve in 17:15–17:50 UT (Fig. 3a). Figure 3(b) shows that the X-ray and microwave light curves are well correlated with a high correlation coefficient of 0.62–0.83. No time lag is found between the bursts seen in the X-ray and microwave within the uncertainty of the cross-correlation peak location. The latter is determined by ), where is the noise level in the cross-correlation function, and and are the height and the half-width at half-maximum of the peak in the function, respectively (Tonry & Davis 1979; Gaskell & Peterson 1987). In Fig. 3(c), we show that all the peaks of the cross-correlation coefficients are in the range of 10 s to 10 s, which fall within the uncertainties (horizontal error bars).
II.2 X-ray spectroscopy and imaging
We analyze the RHESSI full-disk-integrated X-ray spectrum during the peak of a selected burst at around 17:35 UT integrated over a 28-s interval (indicated by a white arrow in Figure 2(b)) using the standard X-ray spectral analysis tool OSPEX available in the SolarSoft Ware (Freeland & Handy 1998, SSW;) IDL package. Ning et al. 2019 reported a significant pulse pileup effect on the RHESSI spectra in this event. Pileup results when two lower-energy photons arrive at the detector within a short time and are counted by the detector as a single higher-energy photon (Smith et al. 2002). We check the impact of the pulse pileup effect at 17:35 UT using the standard routine hsi_pileup_check in SSW. We find while pileup strongly affects the spectrum above 20 keV, the lower-energy range is almost pileup-free. Such pileup effect on relatively higher energies is also implied by the similar temporal behavior of the light curves between RHESSI/Fermi 6–50 keV and GOES detrended 1–8 Å SXR (as mentioned in section II.1), which is consistent with a dominant thermal plasma at lower energies and some pileup at higher energies. We restrict our spectral fit to only the low-energy range (6–25 keV). We include the pileup in the detector response matrix for spectral fitting by adding the pileup module pileup_mod as a fitting component. Figure 4 shows the observed X-ray count flux spectrum and the spectral fit result that corresponds to an isothermal model with a temperature of and a volume emission measure (red curve), together with pulse pileup correction (blue curve). We note that the uneven pattern in the residuals (particularly those in 6–9 keV; Figure 4(b)) may be an indication of unaccounted contributions from, e.g., the emission line complexes at 6.65 keV (Fe) and 8 keV (Fe/Ni) or imperfect pileup corrections. We explore the uncertainties in the best-fit parameters by employing the Monte Carlo analysis implemented in ospex. The estimated uncertainties in the fit results and are relatively small (shown in Figure 4). We caution that, however, these uncertainties should be considered as lower limits due to the simplifications made in the model (isothermal continuum) as noted earlier. Nevertheless, the X-ray spectrum below 20 keV favors a thermal source of 19 MK. While the pileup effect renders the spectral analysis difficult for the energy range above 20 keV, there is a hint for the possible presence of a weak nonthermal component in the 30–40 keV range, where the observed HXR counts exceed the pileup component and the background.

We reconstruct RHESSI X-ray images using the CLEAN algorithm (Hurford et al. 2002) with measurements from detectors 3, 6 and 8. Time-series images were made in three energy bands, 6–12 keV, 12–25 keV, and 25–50 keV, over two RHESSI observing windows in 17:28–17:55 UT and 19:02–19:35 UT with an integration time of 60 s for each individual image. Figure 5 shows an example of RHESSI images at the three energy bands. There is a persistent X-ray looptop source in 6–12 keV and 12–25 keV located near the apex of the flare arcade. Spectral analysis described above suggests that this source is dominated by thermal emission from a hot source with a temperature MK. The higher-energy 25–50 keV X-ray source appears co-spatial with the lower-energy source (Fig. 5(d)). However, this band is severely affected by the pileup effect (c.f., Fig. 4). Thus we choose not to perform an in-depth analysis on the images of this band.
In the RHESSI 6–12 keV and 12–25 keV images, a weaker secondary coronal source is present above the primary source by 27 Mm. The secondary source is located near the tip of the cusp-shaped flare arcade, seen by SDO/AIA 131 Å (Fig. 5(a)), and is persistent over nearly the entire time of interest. Although its higher-energy counterpart is elusive due to the pileup effect, this secondary source appears reminiscent of the ALT HXR sources seen in the “Masuda-type” flares, where a HXR source is located slightly above the bright SXR/EUV flare arcade (Masuda et al. 1994; Veronig et al. 2006; Liu et al. 2013; Krucker & Battaglia 2014). We estimate the full width at half-maximum (FWHM) size of the primary and secondary source as 11 Mm and 9 Mm, respectively. Since the primary looptop source dominates the X-ray flux, we adopt its source area to estimate an average column emission measure of in the looptop source. It should be noted that the source area in the CLEAN images characterized by its full-width-half-maximum size may result in an overestimation (Dennis & Pernak 2009; Kontar et al. 2010) and should be treated as the upper limit. However, the true source size should not be more than 10–20% smaller, and will not strongly affect our order-of-magnitude estimate of here.
II.3 Microwave imaging spectroscopy

EOVSA provides microwave images in 2.5–18 GHz with 134 spectral channels spread over 31 spectral windows. In this work we combine each of the upper 30 spectral windows centered from 3.4 to 17.9 GHz to produce images at 30 equally spaced frequencies. Figure 1(c) shows the microwave images at these 30 frequencies at 17:35 UT (filled contours). The overall morphology of the evolving microwave source is consistent with the shape and orientation of the EUV flare arcade. At high frequencies (blue colors), there are two distinct sources: one coincides with the looptop HXR source, while the other is in the northern leg of the flare arcade. At low frequencies, the microwave source concentrates in the northern leg of the flare arcade (on the left side in Fig. 1(c)), where the second (weaker) high-frequency microwave source is located. The microwave emission at all frequencies is weak or absent in the southern leg of the flare arcade (right side in the diagram).
The time-series of microwave images reveals that the impulsive component of the microwave emission in each burst is mainly from the loopleg source. Fig. 6(a–c) shows such time-sequence images for three selected microwave bursts peaking at 17:05 UT, 17:29 UT, and 17:35 UT, respectively (denoted as , , and in Fig. 6(f)). In these time-sequence images, the loopleg source shows a large variation in intensity during each burst (by a factor of up to 15). In contrast, the looptop source appears relatively stable with more-minor variations in morphology and intensity.
The dominance of loopleg brightening is better demonstrated in the spatially-resolved, or “vector”, dynamic spectra shown in Figs. 6(d–f). First introduced by Chen et al. 2015 using dynamic imaging spectroscopy data from the Karl G. Jansky Very Large Array (VLA), the technique of vector dynamic spectra takes advantage of the spatially, spectrally, and temporally resolved data to derive a radio dynamic spectrum for each selected region of interest in the spatial domain. This spatial separation allows the study of the temporal and spectral properties intrinsic to each radio source of interest. Here we select the looptop and loopleg sources (shown as the white boxes in Fig. 6(a)) and derive the maximum brightness temperature within each box as a function of time and frequency. The resulting vector dynamic spectra for the loopleg and looptop source are shown in Fig. 6(d) and (e), respectively, and their intensity ratio is shown in Fig. 6(f). Although the loopleg and looptop source both display impulsive features, the bursts in the loopleg source are up to 10 times stronger than the looptop source (c.f., ratio spectrum in Fig. 6(f)).

To investigate the looptop and loopleg emission, we derive the spatially-resolved microwave brightness temperature spectra obtained at different spatial locations. Figure 7(e) shows the background-subtracted spectra obtained from several selected locations along the flare arcade (white boxes in Fig. 7(a–d)) at 17:05 UT ( in Fig. 6), during the peak of one of the brightest microwave bursts (solid black curves in Fig. 7(e)). The background spectra , shown as gray curves in Fig. 7(e), are obtained at a time just after this microwave burst, denoted as in Fig. 6(f). At the lowest frequencies, the background spectra follow a power law with a slope close to , suggesting an optically-thin, bremsstrahlung origin (e.g., Fleishman & Toptygin 2013b, Section 10.2). At higher frequencies, the spectra are more complex with a flat or rising toward higher frequencies, which is suggestive of a nonthermal gyrosynchrotron contribution.
Fig. 7(e) shows the background-subtracted microwave spectra as solid black curves. The spectra in the loopleg region (boxes 3-6) show characteristics of gyrosynchrotron radiation due to nonthermal electrons gyrating in the coronal magnetic field (Dulk 1985, e.g.,). We adopt the method described in Fleishman et al. 2020 to fit the spectra using a gyrosynchrotron emission model from an isotropic and homogeneous nonthermal electron source with a power-law energy distribution. From the spectral fit, we obtain the magnetic field strength , the power-law index of the electron energy distribution , and the total number density of nonthermal electrons integrated above 100 keV. The robustness and confidence level of the fit parameters are evaluated using a Markov chain Monte Carlo (MCMC) method, described in detail in Chen et al. 2020b. The derived magnetic field strength increases from to from box 3 to box 6, corresponding to height range from 35 Mm to 15 Mm. This is consistent with an expected increase of the magnetic field strength in a coronal loop towards lower heights. The values are also consistent with spectropolarimetric measurements of the magnetically sensitive Ca II 8542 Å line in the same post-arcade region about one hour before our time of interest (Kuridze et al. 2019). The power-law index of the electron energy distribution , which ranges from 3.0–4.2, indicates a hardening toward lower heights (i.e., toward the loopleg region). The total number density of the nonthermal electrons above 100 keV is –, which is a small fraction of the thermal electron density in the same region (of order , estimated based on the column emission measure shown in Fig. 7(d) and an assumed column depth of a few tens of Mm).
In the looptop region, however, the microwave spectra (except the lowest few frequencies) show very little increment above the post-burst background (boxes 1, 2, and 7). The spectra (without background subtraction) are consistent with free-free (bremsstrahlung) radiation from hot thermal plasma with a temperature of 10–15 MK and column emission measure of cm-5 (blue curves in Fig. 7(e)). The latter is constrained using a differential emission measure (DEM) analysis method xrt_dem_iterative2 (Weber et al. 2004; Golub et al. 2004) based on imaging data at six SDO/AIA EUV passbands (94 Å, 131 Å, 171 Å, 193 Å, 211 Å, and 335 Å). The microwave spectral and AIA DEM analysis of the looptop source is consistent with that derived from RHESSI (temperature of and column emission measure of ; See section II.2).
II.4 Bi-directional outflows
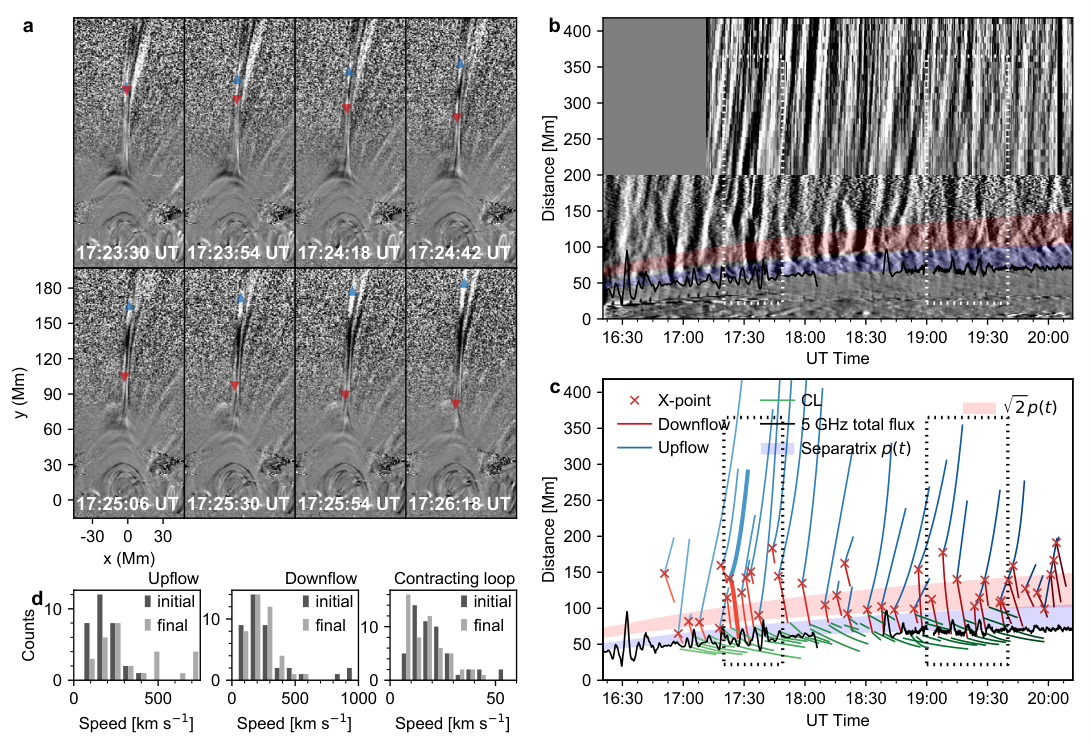
Shortly after the eruption of the dark cavity at around 15:54 UT, a thin bright plasma sheet appeared in multiple SDO/AIA passbands, with a temperature of –20 MK according to EUV spectroscopic data (Warren et al. 2018). In SDO/AIA 131 Å (which is sensitive to the Fe XXI line at 10 MK; O’Dwyer et al. 2010) images, multitudes of plasma outflows are present in the plasma sheet during different phases of the event for an extended period of time (Longcope et al. 2018; Cheng et al. 2018; Hayes et al. 2019; Chen et al. 2020b; Lee et al. 2020). Here we focus on the plasma outflows during the post-impulsive gradual phase from 16:20 UT to 20:20 UT. We find many recurring pairs of bi-directional plasma outflows that propagate simultaneously in the sunward (down) and anti-sunward (up) direction. A time sequence of one such outflow is shown in Fig. 8(a), in which the slow-varying background is removed to enhance the dynamic features. The upward-moving EUV outflows extend well into the MLSO/K-cor field of view in white light to at least 1200 Mm (or 1.7 R⊙) above the solar surface (Fig. 8(b); see also Figure 11 in Appendix 11 with a full height range). Some of the upward-moving outflows are reported in a recent paper by Lee et al. 2020 that reaching a height of more than 4 R⊙ in SOHO/LASCO C2 images. The downward-moving EUV outflows seem to terminate at the looptop region. Each pair of bi-directional outflows appears to diverge from a discrete site at varying heights in the plasma sheet.
To quantify the motion of the bi-directional plasma outflows, we construct a time–distance diagram from a slice along the direction of the plasma sheet feature seen in both SDO/AIA 131 Å and MLSO/K-cor images (green dashed curve in Figs. 1(b) and (c)). The slice has a width at the base. To improve the signal to noise at larger coronal distances, we increase the width of the slice linearly with distance as . At each time , for every distance along the slice, all pixels across the slice within width are averaged to produce the intensity shown in the composite time–distance plot . The plasma upflows seen in EUV continue smoothly to the white light image seen at the upper edge of the SDO/AIA field of view at Mm (Fig. 8 (b)). We selected the most prominent tracks and fitted either straight line or basis spline curve (de Boor 1972) to the projected height as a function of time , depending on their apparent curvatures in the time-distance map. We identified 40 pairs of such bi-directional outflow tracks in 16:20–20:20 UT. There are also a few additional cases of downflow tracks without an obvious upward counterpart. Fig. 8(d) shows the statistical distributions of the outflow speeds. The distributions for both the “initial” and “final” speeds, defined respectively as those measured when the flows appear and disappear (or indiscernible) in the time-distance maps, are displayed. The initial speeds of the upflows and downflows in projection are distributed between 100–900 with an average of 250 km s-1. These measured outflow speeds are consistent with previous reports of outflows in the same event (Cheng et al. 2018; Longcope et al. 2018; Hayes et al. 2019), and are typical for SADs and SADLs reported in other events (McKenzie & Hudson 1999; Asai et al. 2004; McKenzie & Savage 2009; Savage & McKenzie 2011; Takasao et al. 2012; Liu et al. 2013).
The flow tracks in the time-distance map of Fig. 8(c) show that most downflows have nearly constant speeds along their path, while an upward acceleration is present in most upflows. The latter is also clearly shown in Fig. 8(d), in which the final speeds of the upflows are consistently greater than the initial speeds. Such an apparent acceleration of the upflows in the same event was also presented and discussed in previous studies (Cheng et al. 2018; Lee et al. 2020). The variation of the flow speeds along the plasma sheet may provide important hints for understanding the detailed physics within the reconnection current sheet including, possibly, the size of the diffusion region (Forbes et al. 2018). However, a more in-depth investigation is beyond the scope of this study.
Similar to the interpretation adopted in previous studies (Savage et al. 2010; Takasao et al. 2012; Liu et al. 2013), we attribute the diverging location of each bi-directional outflow pair as the site of the reconnection “X” point associated with an individual magnetic reconnection event (or, to be more precise, the “stagnation point” of the reconnection outflows; see, e.g., Forbes et al. 2018). Most of these identified reconnection sites are located at –180 Mm (or 0.07–0.26 ) above the limb, which is only 1%–3% of the total length of the plasma sheet (10 ) during that period.
The downflows fade away as they merge into the tip of the cusp-shaped flare arcade (sometimes referred to as the “Y” point; Priest & Forbes 2000; Chen et al. 2020b), where numerous slow, downward-contracting loops are present (see the animation accompanying Fig. 8). The slow contracting loops are also visible in the time-distance plots in Fig. 8(b) as multiple faint, finer tracks that branch off from the faster downflow tracks. Their initial speeds, measured using the slopes of the green lines in the time-distance plots, are only 10s or below. Such slow loop shrinkage is persistent throughout the gradual phase with an average recurrence period of 3.2 minutes. Although there is no one-to-one correspondence between the fast plasma downflows and the slow contracting motion of the post-reconnection flare loops, the slow-contracting loops appear in the close vicinity of the region where the fast downflows fade away, suggesting the presence of a “separatrix” region where the downflow motions appear to “terminate”.
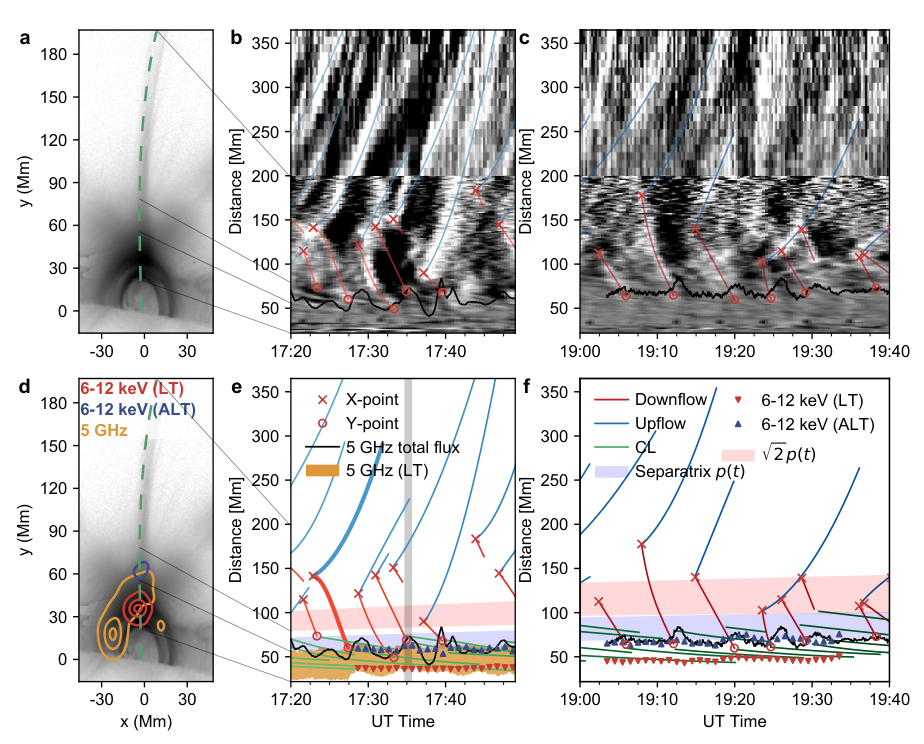
The location of this separatrix region between the downflows and the contracting loops nearly coincides with the tip of the cusp-shaped flare arcade, shown as the blue colored shading in Figure 8(b–c), The lower edge of the separatrix region follows the end points of the fast downflow tracks. The upper edge follows the initial points of the slow contracting loop tracks. This separatrix region rises slowly during the gradual phase (blue shaded region in Figure 9(e–f)) in a similar fashion as the slow rise motion of the underlying microwave and X-ray looptop source located at the top of the flare arcade (red triangles in Figure 9(e–f); see also Gary et al. 2018; Hayes et al. 2019). The centroids of the ALT 6–12 keV X-ray source (blue triangles in Figure 9(e–f)) are located near the separatrix region and follow the same rising motion. Possible implications of such a spatial-temporal coincidence will be discussed in the next section.
To illustrate the timing of the impulsive microwave bursts in accordance with the observed EUV plasma downflows, we overlay the EOVSA 5 GHz microwave light curve (from Figure 1(c)) on the time–distance plots in Figure 9 near the separatrix region. The arrival of most plasma downflows at the separatrix region is immediately followed by a microwave burst. This correlation in both space and time is a strong indication for a casual connection between the plasma downflows arriving at the looptop and the appearance of microwave-emitting nonthermal electrons in the flare arcade.

II.5 Summary of the Observations
The main observational findings discussed in this section are briefly summarized as below:
- 1.
Reconnection sites (or “X” points), from where the bi-directional plasma outflows diverge, reside at low altitudes 180 Mm, which are 1–3% of the total length of the long plasma sheet, which extends to 10.
- 2.
The arrival of most EUV plasma downflows at the top of the cusp-shaped flare arcade correlates with an impulsive microwave and X-ray burst, which consists of a (mostly) thermal looptop microwave and X-ray source and a nonthermal loopleg microwave source. The individual loopleg microwave nonthermal bursts and the looptop X-ray bursts take place simultaneously within a uncertainty of 10–20 seconds.
- 3.
Multitudes of slow contracting loops are present below the tip of the cusp-shaped flare arcade where the fast plasma downflows terminate. A secondary ALT X-ray source coincides with the separatrix region that divides the fast downflows and slow contracting loops.
III Discussion and Conclusion
Our observational results are consistent with the standard CSHKP eruptive flare scenario for the post-impulsive phase (or gradual phase). At this stage, the eruption has already propagated to a remote coronal distance, leaving behind a large-scale vertical RCS above the post-flare arcade (see, e.g., Forbes et al. 2018). Figure 10(a) shows a schematic diagram for the post-impulsive phase projected in 2D adapted from a well-known cartoon in Forbes & Acton 1996. In this cartoon, the RCS and the underlying flare arcade are viewed edge on, in accordance with the viewing perspective of this event. Sporadic magnetic reconnections occur at localized magnetic null points (or X points) in the RCS, creating pairs of highly bent magnetic flux tubes (Furth et al. 1963). Plasma is ejected from the X points both upward and downward along the RCS, resulting in bi-directional plasma outflows.
The reconnection sites, pinpointed by the bi-directional plasma outflows, are located very low in the RCS. The heights of the X points are 1–3% of the total length of the RCS seen in EUV and white light, which extends to at least 10 . The observed low reconnection sites within a long RCS are in agreement with predictions in the 2D theoretical model by Forbes et al. 2018, the latest development based upon one of most well-known standard flare models in Lin & Forbes 2000, Reeves & Forbes 2005 and Seaton & Forbes 2009. The 2D theoretical model predicts the height of the X point of approximately during the post-impulsive phase, where is the height of the Y point at the lower end of the RCS at time . The latter marks the location where a thin RCS turns into a cusp-shaped post-reconnection flare arcade, measured as the tip of cusp loops seen in SDO/AIA 131 Å time-series images. As discussed in the previous section, this location also coincides with the separatrix region where the fast downflows, identified in the thin plasma sheet, meet the slow-contracting cusp loops below the cusp tip. In Figs. 8 and 9, we show the estimated location of the rising Y point as the blue shaded region and, according to the prediction in Forbes et al. 2018, the presumed location of the reconnection X point as the red shaded region. The predicted X point in idealized 2D flare model and its evolution in time agree with the location of the reconnection events pinpointed by the bi-directional plasma outflows in the thin plasma sheet. The scatter of the observationally-inferred reconnection sites around the model-predicted X point location is likely due to a deviation of the actual reconnection events from the idealized 2D model, together with the 3D nature of the flare event with multiple reconnection events distributed within the extended RCS along the direction of the LOS (illustrated in Fig. 10(b)).
In the 2D reconnection theories, the speeds of the reconnection outflows are at the local Alfvén speed (Sweet 1958; Parker 1957; Petschek & Thorne 1967). However, similar to many other reports (Savage et al. 2010; Savage & McKenzie 2011; Longcope et al. 2018; Hayes et al. 2019; Chen et al. 2020b), in our observations, the speeds of the bi-directional plasma outflows are between 100–900 km s-1 with an average of 250 km s-1, which are likely sub-Alfvénic. It has been suggested that the observed plasma outflows may be sub-Alfvénic due to 3D effects, or have been slowed down as they emerge from the reconnection diffusion region by, e.g., an aerodynamic drag force (Longcope et al. 2018).
The plasma outflows carry a significant portion of the total released magnetic energy in the form of electromagnetic Poynting flux, enthalpy flux, and kinetic energy flux of the bulk flows and turbulence (Fletcher & Hudson 2008; Birn et al. 2009; Reeves et al. 2010; Kontar et al. 2017; Warren et al. 2018; Polito et al. 2018; Cheng et al. 2018). Arrival of the downward-propagating plasma outflows at the cusp region dissipates their energy, resulting in plasma heating through thermal conduction and/or adiabatic heating (Reeves et al. 2019, see, e.g., recent 3D modeling results in). If a fast-mode termination shock is established in the cusp region (which is perhaps implicated by the presence of the secondary ALT X-ray source near the cusp tip), plasma heating would occur in the shock downstream region (Forbes 1986; Masuda et al. 1994). Such heated plasma is revealed by the thermal X-ray and microwave source observed at the looptop.
The impulsively released magnetic energy during the sporadic magnetic reconnection events in the RCS can also lead to particle acceleration. Electrons can be accelerated to nonthermal energies in the RCS, at the looptop, or in the flare arcade itself by a variety of acceleration mechanisms (see, e.g., Miller et al. 1997 for a review). In our observations, the nonthermal microwave bursts only occur in the loopleg region at a large distance away from the reconnection X points. This is in line with HXR and microwave imaging spectroscopy data (Krucker et al. 2010; Krucker & Battaglia 2014; Fleishman et al. 2020; Chen et al. 2020b) providing increasing evidence favoring the looptops/cusp regions as the primary electron acceleration sites.
In this event, the cusp region as the primary electron acceleration site during the time of interest of our study is supported by the relative timing between the X-ray/microwave bursts and the magnetic reconnection events in the RCS (inferred from the occurrence of the bi-directional outflows). An important clue, as shown in Fig. 9, is that the occurrence of the X-ray/microwave bursts correlates with the arrival time of the plasma downflows at the cusp, but not the time of the magnetic reconnection events themselves. A straightforward interpretation is that the electrons responsible for the nonthermal microwave bursts are accelerated locally at the looptops, where freshly injected energy is available from the arrival of the plasma downflows. An alternative scenario is that the microwave-emitting electrons are accelerated in the RCS, but are trapped in the propagating plasma downflows. These electrons are released once the plasma downflows have arrived at the looptop, resulting in the nonthermal microwave sources. Although our data alone can not distinguish between the two scenarios, the latter scenario requires an additional mechanism that traps and/or accelerates the electrons within the plasma outflows along their path, while “breaks” this trapping upon the arrival of the outflows at the looptop. The cusp region is also favored as a site for direct plasma heating, implied by the concurrent appearance of the thermal emission seen in X-rays (25 keV) by 20 MK plasma at the looptop, together with the nonthermal microwave emission.
The observed recurring bursts possess a recurrence period of seconds and a modulation depth of 1.5% to 30% reminiscent of quasi-periodic pulsations (QPPs) observed in X-rays and microwaves during flares (Foullon et al. 2005; Mészárosová et al. 2006; Reznikova & Shibasaki 2011). Such QPPs with long periods are sometimes referred to as long QPPs (Nakariakov & Melnikov 2009). One of the most intriguing questions about QPPs is what drives them during flares. The possible causes are generally categorized into two groups: (1) time-dependent energy release (Fleishman et al. 2008; Yuan et al. 2019), and 2) MHD oscillations in flare sites (see Nakariakov & Melnikov 2009; McLaughlin et al. 2018, for reviews). Differentiating observationally between the possible explanations of long-period QPPs during flares remains elusive. The relative timing between X-ray/microwave bursts and the reconnection events we observe, however, allows for the determination of the origin of these particular bursts, although we leave open the question of whether they should be considered as QPPs. We find that the timing of the microwave and X-ray bursts is entirely driven by the reconnection at the X points, which rules out the MHD interpretation as the driver of the bursts. Nevertheless, Hayes et al. 2019 recently reported persistent QPPs with a two-times shorter period of 150 seconds in GOES SXR and SDO/AIA 131 Å light curves during the gradual phase of this same flare. The time-dependent magnetic reconnection mechanism we describe cannot fully account for these shorter-period QPPs, and other mechanisms such as MHD oscillations could play a role in modulating these lower-energy thermal emissions. As pointed out by Hayes et al. 2019, persistent QPPs require a renewed excitation of MHD modes in the flare arcade, and the recurring reconnection-generated downflows we describe could provide the needed repetitive trigger at or above the the post-flare arcade (Takasao & Shibata 2016; Jelínek et al. 2017).
In the ideal 2D standard model, the microwave source is expected to bestride the flare arcade. However, there is a marked asymmetry in the observed microwave emission in the post-flare arcade: a microwave source is only visible in the northern loopleg while the southern leg is not. One explanation could be due to the perspective effect that the event is tilted slightly away from the ideal 2D standard model projection, so that the microwave source at the southern leg of the flare arcade may be occulted by optically-thick, dense plasma filled in the arcade (perhaps due to chromospheric evaporation) located in the forefront along the LOS (illustrated in Fig. 10(b)). However, we could not completely rule out a coronal loop asymmetry as a possible cause of the dissimilar radio brightness of the northern and southern loop legs.
To summarize, thanks to the new microwave imaging spectroscopy observations from EOVSA, we have presented a comprehensive study that associates the bi-directional EUV plasma outflows in a large-scale RCS to looptop microwave and X-ray bursts in both time and space. The performed multi-wavelength analysis allowed us to quantify particle acceleration and plasma heating in the post-flare arcades, observed as the hot and nonthermal flare emissions, and their relationships with the magnetic reconnection in the RCS. Our findings reveal new facets of magnetic reconnection, the subsequent energy conversion, and electron acceleration, and thus help to better understand these fundamental phenomena.
Appendix A Plasma Upflows Extending to Very High Altitudes

The reconnection X points inferred from the diverging bi-directional EUV plasma outflows reside at a low altitude of 180 Mm. Multitudes of plasma downflows are present below the X points. Meanwhile, the EUV plasma upflows extend well into the MLSO/K-cor’s field of view in white light to at least 1200 Mm. In Figure 8(b), we have limited the -axis to 400 Mm for better showing the details of the downflows together with the upflows. For completeness, in Figure 11, here we include a similar plot showing the full extend of the upflows up to 1200 Mm.
References
- Asai et al. (2004) Asai, A., Yokoyama, T., Shimojo, M., & Shibata, K. 2004, ApJ, 605, L77, doi: 10.1086/420768
- Battaglia & Benz (2006) Battaglia, M., & Benz, A. O. 2006, A&A, 456, 751, doi: 10.1051/0004-6361:20065233
- Benz (2017) Benz, A. O. 2017, Living Reviews in Solar Physics, 14, 2, doi: 10.1007/s41116-016-0004-3
- Birn et al. (2009) Birn, J., Fletcher, L., Hesse, M., & Neukirch, T. 2009, ApJ, 695, 1151, doi: 10.1088/0004-637X/695/2/1151
- Brueckner et al. (1995) Brueckner, G. E., Howard, R. A., Koomen, M. J., et al. 1995, Sol. Phys., 162, 357, doi: 10.1007/BF00733434
- Carmichael (1964) Carmichael, H. 1964, A Process for Flares, Vol. 50, 451
- Chae et al. (2017) Chae, J., Cho, K., Kwon, R.-Y., & Lim, E.-K. 2017, ApJ, 841, 49, doi: 10.3847/1538-4357/aa6d7a
- Chen et al. (2015) Chen, B., Bastian, T. S., Shen, C., et al. 2015, Science, 350, 1238, doi: 10.1126/science.aac8467
- Chen et al. (2019) Chen, B., Shen, C., Reeves, K. K., Guo, F., & Yu, S. 2019, ApJ, 884, 63, doi: 10.3847/1538-4357/ab3c58
- Chen et al. (2020a) Chen, B., Yu, S., Reeves, K. K., & Gary, D. E. 2020a, ApJ, 895, L50, doi: 10.3847/2041-8213/ab901a
- Chen et al. (2018) Chen, B., Yu, S., Battaglia, M., et al. 2018, ApJ, 866, 62, doi: 10.3847/1538-4357/aadb89
- Chen et al. (2020b) Chen, B., Shen, C., Gary, D. E., et al. 2020b, arXiv e-prints, arXiv:2005.12757. https://arxiv.org/abs/2005.12757
- Chen & Petrosian (2012) Chen, Q., & Petrosian, V. 2012, ApJ, 748, 33, doi: 10.1088/0004-637X/748/1/33
- Chen & Petrosian (2013) —. 2013, ApJ, 777, 33, doi: 10.1088/0004-637X/777/1/33
- Cheng et al. (2018) Cheng, X., Li, Y., Wan, L. F., et al. 2018, ApJ, 866, 64, doi: 10.3847/1538-4357/aadd16
- de Boor (1972) de Boor, C. 1972, Journal of Approximation Theory, 6, 50 , doi: https://doi.org/10.1016/0021-9045(72)90080-9
- Dennis et al. (2018) Dennis, B. R., Duval-Poo, M. A., Piana, M., et al. 2018, ApJ, 867, 82, doi: 10.3847/1538-4357/aae0f5
- Dennis & Pernak (2009) Dennis, B. R., & Pernak, R. L. 2009, ApJ, 698, 2131, doi: 10.1088/0004-637X/698/2/2131
- Drake et al. (2006) Drake, J. F., Swisdak, M., Che, H., & Shay, M. A. 2006, Nature, 443, 553, doi: 10.1038/nature05116
- Dulk (1985) Dulk, G. A. 1985, ARA&A, 23, 169, doi: 10.1146/annurev.aa.23.090185.001125
- Elmore et al. (2003) Elmore, D. F., Burkepile, J. T., Darnell, J. A., Lecinski, A. R., & Stanger, A. L. 2003, Society of Photo-Optical Instrumentation Engineers (SPIE) Conference Series, Vol. 4843, Calibration of a ground-based solar coronal polarimeter, ed. S. Fineschi, 66–75, doi: 10.1117/12.459279
- Fleishman et al. (2008) Fleishman, G. D., Bastian, T. S., & Gary, D. E. 2008, ApJ, 684, 1433, doi: 10.1086/589821
- Fleishman et al. (2020) Fleishman, G. D., Gary, D. E., Chen, B., et al. 2020, Science, 367, 278, doi: 10.1126/science.aax6874
- Fleishman & Toptygin (2013a) Fleishman, G. D., & Toptygin, I. N. 2013a, MNRAS, 429, 2515, doi: 10.1093/mnras/sts518
- Fleishman & Toptygin (2013b) —. 2013b, Cosmic Electrodynamics. Astrophysics and Space Science Library; Springer NY, Vol. 388, 712 p [FT13]
- Fletcher & Hudson (2008) Fletcher, L., & Hudson, H. S. 2008, ApJ, 675, 1645, doi: 10.1086/527044
- Forbes (1986) Forbes, T. G. 1986, ApJ, 305, 553, doi: 10.1086/164268
- Forbes & Acton (1996) Forbes, T. G., & Acton, L. W. 1996, ApJ, 459, 330, doi: 10.1086/176896
- Forbes et al. (2018) Forbes, T. G., Seaton, D. B., & Reeves, K. K. 2018, ApJ, 858, 70, doi: 10.3847/1538-4357/aabad4
- Foullon et al. (2005) Foullon, C., Verwichte, E., Nakariakov, V. M., & Fletcher, L. 2005, A&A, 440, L59, doi: 10.1051/0004-6361:200500169
- Freeland & Handy (1998) Freeland, S. L., & Handy, B. N. 1998, Sol. Phys., 182, 497, doi: 10.1023/A:1005038224881
- French et al. (2019) French, R. J., Judge, P. G., Matthews, S. A., & van Driel-Gesztelyi, L. 2019, ApJ, 887, L34, doi: 10.3847/2041-8213/ab5d34
- Furth et al. (1963) Furth, H. P., Killeen, J., & Rosenbluth, M. N. 1963, Physics of Fluids, 6, 459, doi: 10.1063/1.1706761
- Gary et al. (2018) Gary, D. E., Chen, B., Dennis, B. R., et al. 2018, ApJ, 863, 83, doi: 10.3847/1538-4357/aad0ef
- Gaskell & Peterson (1987) Gaskell, C. M., & Peterson, B. M. 1987, ApJS, 65, 1, doi: 10.1086/191216
- Giuliani et al. (2005) Giuliani, P., Neukirch, T., & Wood, P. 2005, ApJ, 635, 636, doi: 10.1086/497366
- Golub et al. (2004) Golub, L., Deluca, E. E., Sette, A., & Weber, M. 2004, in Astronomical Society of the Pacific Conference Series, Vol. 325, The Solar-B Mission and the Forefront of Solar Physics, ed. T. Sakurai & T. Sekii, 217–+
- Gopalswamy et al. (2018) Gopalswamy, N., Yashiro, S., Mäkelä, P., et al. 2018, ApJ, 863, L39, doi: 10.3847/2041-8213/aad86c
- Grady et al. (2012) Grady, K. J., Neukirch, T., & Giuliani, P. 2012, A&A, 546, A85, doi: 10.1051/0004-6361/201218914
- Guo & Giacalone (2012) Guo, F., & Giacalone, J. 2012, ApJ, 753, 28, doi: 10.1088/0004-637X/753/1/28
- Hamilton & Petrosian (1992) Hamilton, R. J., & Petrosian, V. 1992, ApJ, 398, 350, doi: 10.1086/171860
- Hayes et al. (2019) Hayes, L. A., Gallagher, P. T., Dennis, B. R., et al. 2019, ApJ, 875, 33, doi: 10.3847/1538-4357/ab0ca3
- Hirayama (1974) Hirayama, T. 1974, Sol. Phys., 34, 323, doi: 10.1007/BF00153671
- Hurford et al. (2002) Hurford, G. J., Schmahl, E. J., Schwartz, R. A., et al. 2002, Sol. Phys., 210, 61, doi: 10.1023/A:1022436213688
- Jelínek et al. (2017) Jelínek, P., Karlický, M., Van Doorsselaere, T., & Bárta, M. 2017, ApJ, 847, 98, doi: 10.3847/1538-4357/aa88a6
- Karlický & Bárta (2006) Karlický, M., & Bárta, M. 2006, ApJ, 647, 1472, doi: 10.1086/505460
- Karlický & Bárta (2007) —. 2007, A&A, 464, 735, doi: 10.1051/0004-6361:20065983
- Karlický & Kosugi (2004) Karlický, M., & Kosugi, T. 2004, A&A, 419, 1159, doi: 10.1051/0004-6361:20034323
- Kong et al. (2019) Kong, X., Guo, F., Shen, C., et al. 2019, ApJ, 887, L37, doi: 10.3847/2041-8213/ab5f67
- Kontar et al. (2010) Kontar, E. P., Hannah, I. G., Jeffrey, N. L. S., & Battaglia, M. 2010, ApJ, 717, 250, doi: 10.1088/0004-637X/717/1/250
- Kontar et al. (2017) Kontar, E. P., Perez, J. E., Harra, L. K., et al. 2017, Physical Review Letters, 118, 155101, doi: 10.1103/PhysRevLett.118.155101
- Kopp & Pneuman (1976) Kopp, R. A., & Pneuman, G. W. 1976, Sol. Phys., 50, 85, doi: 10.1007/BF00206193
- Krucker & Battaglia (2014) Krucker, S., & Battaglia, M. 2014, ApJ, 780, 107, doi: 10.1088/0004-637X/780/1/107
- Krucker et al. (2010) Krucker, S., Hudson, H. S., Glesener, L., et al. 2010, ApJ, 714, 1108, doi: 10.1088/0004-637X/714/2/1108
- Krucker et al. (2008a) Krucker, S., Hurford, G. J., MacKinnon, A. L., Shih, A. Y., & Lin, R. P. 2008a, ApJ, 678, L63, doi: 10.1086/588381
- Krucker et al. (2008b) Krucker, S., Battaglia, M., Cargill, P. J., et al. 2008b, A&A Rev., 16, 155, doi: 10.1007/s00159-008-0014-9
- Kuridze et al. (2019) Kuridze, D., Mathioudakis, M., Morgan, H., et al. 2019, ApJ, 874, 126, doi: 10.3847/1538-4357/ab08e9
- Lee et al. (2020) Lee, J.-O., Cho, K.-S., Lee, K.-S., et al. 2020, ApJ, 892, 129, doi: 10.3847/1538-4357/ab799a
- Lemen et al. (2012) Lemen, J. R., Title, A. M., Akin, D. J., et al. 2012, Sol. Phys., 275, 17, doi: 10.1007/s11207-011-9776-8
- Li et al. (2018) Li, X., Guo, F., Li, H., & Li, S. 2018, ApJ, 866, 4, doi: 10.3847/1538-4357/aae07b
- Lin & Forbes (2000) Lin, J., & Forbes, T. G. 2000, J. Geophys. Res., 105, 2375, doi: 10.1029/1999JA900477
- Lin et al. (2002) Lin, R. P., Dennis, B. R., Hurford, G. J., et al. 2002, Sol. Phys., 210, 3, doi: 10.1023/A:1022428818870
- Liu et al. (2009) Liu, W., Berger, T. E., Title, A. M., & Tarbell, T. D. 2009, ApJ, 707, L37, doi: 10.1088/0004-637X/707/1/L37
- Liu et al. (2013) Liu, W., Chen, Q., & Petrosian, V. 2013, ApJ, 767, 168, doi: 10.1088/0004-637X/767/2/168
- Liu et al. (2008) Liu, W., Petrosian, V., Dennis, B. R., & Jiang, Y. W. 2008, ApJ, 676, 704, doi: 10.1086/527538
- Longcope et al. (2018) Longcope, D., Unverferth, J., Klein, C., McCarthy, M., & Priest, E. 2018, ApJ, 868, 148, doi: 10.3847/1538-4357/aaeac4
- Masuda et al. (1994) Masuda, S., Kosugi, T., Hara, H., Tsuneta, S., & Ogawara, Y. 1994, Nature, 371, 495, doi: 10.1038/371495a0
- McKenzie & Hudson (1999) McKenzie, D. E., & Hudson, H. S. 1999, ApJ, 519, L93, doi: 10.1086/312110
- McKenzie & Savage (2009) McKenzie, D. E., & Savage, S. L. 2009, ApJ, 697, 1569, doi: 10.1088/0004-637X/697/2/1569
- McLaughlin et al. (2018) McLaughlin, J. A., Nakariakov, V. M., Dominique, M., Jelínek, P., & Takasao, S. 2018, Space Sci. Rev., 214, 45, doi: 10.1007/s11214-018-0478-5
- Meegan et al. (2009) Meegan, C., Lichti, G., Bhat, P. N., et al. 2009, ApJ, 702, 791, doi: 10.1088/0004-637X/702/1/791
- Mészárosová et al. (2006) Mészárosová, H., Karlický, M., Rybák, J., Fárník, F., & Jiřička, K. 2006, A&A, 460, 865, doi: 10.1051/0004-6361:20065750
- Miller et al. (1996) Miller, J. A., Larosa, T. N., & Moore, R. L. 1996, ApJ, 461, 445, doi: 10.1086/177072
- Miller et al. (1997) Miller, J. A., Cargill, P. J., Emslie, A. G., et al. 1997, J. Geophys. Res., 102, 14631, doi: 10.1029/97JA00976
- Morosan et al. (2019) Morosan, D. E., Carley, E. P., Hayes, L. A., et al. 2019, Nature Astronomy, 3, 452, doi: 10.1038/s41550-019-0689-z
- Nakariakov & Melnikov (2009) Nakariakov, V. M., & Melnikov, V. F. 2009, Space Sci. Rev., 149, 119, doi: 10.1007/s11214-009-9536-3
- Ning et al. (2019) Ning, H., Chen, Y., Lee, J., et al. 2019, Research in Astronomy and Astrophysics, 19, 173, doi: 10.1088/1674-4527/19/12/173
- Nishizuka & Shibata (2013) Nishizuka, N., & Shibata, K. 2013, Phys. Rev. Lett., 110, 051101, doi: 10.1103/PhysRevLett.110.051101
- Nishizuka et al. (2010) Nishizuka, N., Takasaki, H., Asai, A., & Shibata, K. 2010, ApJ, 711, 1062, doi: 10.1088/0004-637X/711/2/1062
- O’Dwyer et al. (2010) O’Dwyer, B., Del Zanna, G., Mason, H. E., Weber, M. A., & Tripathi, D. 2010, A&A, 521, A21, doi: 10.1051/0004-6361/201014872
- Oka et al. (2010) Oka, M., Phan, T. D., Krucker, S., Fujimoto, M., & Shinohara, I. 2010, ApJ, 714, 915, doi: 10.1088/0004-637X/714/1/915
- Parker (1957) Parker, E. N. 1957, J. Geophys. Res., 62, 509, doi: 10.1029/JZ062i004p00509
- Petrosian (2018) Petrosian, V. 2018, ApJ, 865, 99, doi: 10.3847/1538-4357/aadd07
- Petrosian & Liu (2004) Petrosian, V., & Liu, S. 2004, ApJ, 610, 550, doi: 10.1086/421486
- Petschek & Thorne (1967) Petschek, H. E., & Thorne, R. M. 1967, ApJ, 147, 1157, doi: 10.1086/149105
- Polito et al. (2018) Polito, V., Dudík, J., Kašparová, J., et al. 2018, ApJ, 864, 63, doi: 10.3847/1538-4357/aad62d
- Priest & Forbes (2000) Priest, E., & Forbes, T. 2000, Magnetic Reconnection: MHD Theory and Applications (New York: Cambridge University Press), doi: 10.1017/CBO9780511525087
- Reeves & Forbes (2005) Reeves, K. K., & Forbes, T. G. 2005, ApJ, 630, 1133, doi: 10.1086/432047
- Reeves et al. (2017) Reeves, K. K., Freed, M. S., McKenzie, D. E., & Savage, S. L. 2017, ApJ, 836, 55, doi: 10.3847/1538-4357/836/1/55
- Reeves & Golub (2011) Reeves, K. K., & Golub, L. 2011, ApJ, 727, L52, doi: 10.1088/2041-8205/727/2/L52
- Reeves et al. (2010) Reeves, K. K., Linker, J. A., Mikić, Z., & Forbes, T. G. 2010, ApJ, 721, 1547, doi: 10.1088/0004-637X/721/2/1547
- Reeves et al. (2008) Reeves, K. K., Seaton, D. B., & Forbes, T. G. 2008, ApJ, 675, 868, doi: 10.1086/526336
- Reeves et al. (2019) Reeves, K. K., Török, T., Mikić, Z., Linker, J., & Murphy, N. A. 2019, ApJ, 887, 103, doi: 10.3847/1538-4357/ab4ce8
- Reznikova & Shibasaki (2011) Reznikova, V. E., & Shibasaki, K. 2011, A&A, 525, A112, doi: 10.1051/0004-6361/201015600
- Savage et al. (2012) Savage, S. L., Holman, G., Reeves, K. K., et al. 2012, ApJ, 754, 13, doi: 10.1088/0004-637X/754/1/13
- Savage & McKenzie (2011) Savage, S. L., & McKenzie, D. E. 2011, ApJ, 730, 98, doi: 10.1088/0004-637X/730/2/98
- Savage et al. (2010) Savage, S. L., McKenzie, D. E., Reeves, K. K., Forbes, T. G., & Longcope, D. W. 2010, ApJ, 722, 329, doi: 10.1088/0004-637X/722/1/329
- Seaton & Darnel (2018) Seaton, D. B., & Darnel, J. M. 2018, ApJ, 852, L9, doi: 10.3847/2041-8213/aaa28e
- Seaton & Forbes (2009) Seaton, D. B., & Forbes, T. G. 2009, ApJ, 701, 348, doi: 10.1088/0004-637X/701/1/348
- Shen et al. (2018) Shen, C., Kong, X., Guo, F., Raymond, J. C., & Chen, B. 2018, ApJ, 869, 116, doi: 10.3847/1538-4357/aaeed3
- Shibata et al. (2007) Shibata, K., Nakamura, T., Matsumoto, T., et al. 2007, Science, 318, 1591, doi: 10.1126/science.1146708
- Simões & Kontar (2013) Simões, P. J. A., & Kontar, E. P. 2013, A&A, 551, A135, doi: 10.1051/0004-6361/201220304
- Smith et al. (2002) Smith, D. M., Lin, R. P., Turin, P., et al. 2002, Sol. Phys., 210, 33, doi: 10.1023/A:1022400716414
- Somov & Kosugi (1997) Somov, B. V., & Kosugi, T. 1997, ApJ, 485, 859, doi: 10.1086/304449
- Sturrock (1966) Sturrock, P. A. 1966, Nature, 211, 695, doi: 10.1038/211695a0
- Su et al. (2013) Su, Y., Veronig, A. M., Holman, G. D., et al. 2013, Nature Physics, 9, 489, doi: 10.1038/nphys2675
- Sun et al. (2015) Sun, J. Q., Cheng, X., Ding, M. D., et al. 2015, Nature Communications, 6, 7598, doi: 10.1038/ncomms8598
- Sweet (1958) Sweet, P. A. 1958, in IAU Symposium, Vol. 6, Electromagnetic Phenomena in Cosmical Physics, ed. B. Lehnert, 123
- Takasao et al. (2012) Takasao, S., Asai, A., Isobe, H., & Shibata, K. 2012, ApJ, 745, L6, doi: 10.1088/2041-8205/745/1/L6
- Takasao et al. (2016) —. 2016, ApJ, 828, 103, doi: 10.3847/0004-637X/828/2/103
- Takasao et al. (2015) Takasao, S., Matsumoto, T., Nakamura, N., & Shibata, K. 2015, ApJ, 805, 135, doi: 10.1088/0004-637X/805/2/135
- Takasao & Shibata (2016) Takasao, S., & Shibata, K. 2016, ApJ, 823, 150, doi: 10.3847/0004-637X/823/2/150
- Tonry & Davis (1979) Tonry, J., & Davis, M. 1979, AJ, 84, 1511, doi: 10.1086/112569
- Tsuneta & Naito (1998) Tsuneta, S., & Naito, T. 1998, ApJ, 495, L67, doi: 10.1086/311207
- Veronig et al. (2006) Veronig, A. M., Karlický, M., Vršnak, B., et al. 2006, A&A, 446, 675, doi: 10.1051/0004-6361:20053112
- Veronig et al. (2018) Veronig, A. M., Podladchikova, T., Dissauer, K., et al. 2018, ApJ, 868, 107, doi: 10.3847/1538-4357/aaeac5
- Warren et al. (2018) Warren, H. P., Brooks, D. H., Ugarte-Urra, I., et al. 2018, ApJ, 854, 122, doi: 10.3847/1538-4357/aaa9b8
- Weber et al. (2004) Weber, M. A., Deluca, E. E., Golub, L., & Sette, A. L. 2004, in IAU Symposium, Vol. 223, Multi-Wavelength Investigations of Solar Activity, ed. A. V. Stepanov, E. E. Benevolenskaya, & A. G. Kosovichev (Cambridge University Press), 321–328, doi: 10.1017/S1743921304006088
- Yan et al. (2018) Yan, X. L., Yang, L. H., Xue, Z. K., et al. 2018, ApJ, 853, L18, doi: 10.3847/2041-8213/aaa6c2
- Yuan et al. (2019) Yuan, D., Feng, S., Li, D., Ning, Z., & Tan, B. 2019, ApJ, 886, L25, doi: 10.3847/2041-8213/ab5648
- Zeng et al. (2016) Zeng, Z., Chen, B., Ji, H., Goode, P. R., & Cao, W. 2016, ApJ, 819, L3, doi: 10.3847/2041-8205/819/1/L3
- Zhu et al. (2016) Zhu, C., Liu, R., Alexander, D., & McAteer, R. T. J. 2016, ApJ, 821, L29, doi: 10.3847/2041-8205/821/2/L29