The distant, galaxy cluster environment of the short GRB 161104A at and a comparison to the short GRB host populationFacilities: Swift, Magellan:Clay (LDSS), Magellan:Baade (IMACS), Gemini:South (GMOS) IRAF (Tody 1986; Tody 1993), Astrometry.net (Lang et al. 2010), HOTPANTS (Becker 2015), AstroImageJ (Collins et al. 2017), Prospector (Leja et al. 2017), Python-fsps (Conroy et al. 2009; Conroy & Gunn 2010), Dynesty (Speagle 2020), lifelines (Davidson-Pilon et al. 2020)
Abstract
We present optical observations of the Swift short-duration gamma-ray burst (GRB) GRB 161104A and its host galaxy at . We model the multiband photometry and spectroscopy with the stellar population inference code Prospector, and explore the posterior using nested sampling. We find a mass-weighted age of Gyr, stellar mass of , metallicity of , dust extinction of mag, and a low star formation rate of yr-1. These properties, along with a prominent 4000 Å break and optical absorption lines classify this host as an early-type, quiescent galaxy. Using Dark Energy Survey galaxy catalogues, we demonstrate that the host of GRB 161104A resides on the outskirts of a galaxy cluster at , situated Mpc from the likely brightest cluster galaxy. We also present new modeling for 20 additional short GRB hosts ( of which are early-type galaxies), finding population medians of and Gyr ( confidence). We further find that the host of GRB 161104A is more distant, less massive, and younger than the four other short GRB hosts known to be associated with galaxy clusters. Cluster short GRBs have faint afterglows, in the lower () of observed X-ray (optical) luminosities. We place a lower limit on the fraction of short GRBs in galaxy clusters versus those in the field of , consistent with the fraction of stellar mass in galaxy clusters at redshifts . Future studies that take advantage of wider-field and deeper cluster surveys are needed to understand the true rate of short GRBs in clusters and their effect on heavy-element enrichment in the intracluster medium.
Keywords:
short gamma-ray bursts, galaxies, galaxy clustersI Introduction
Short-duration -ray bursts (GRBs) have long been linked to a diverse set of stellar populations, ranging from galaxies with ongoing star formation to older, elliptical galaxies with deep upper limits on their star formation rates (SFRs; Bloom et al. 2006; Gorosabel et al. 2006; Fong & Berger 2013; Berger 2014; De Pasquale 2019). In the context of their progenitors, this diversity has been attributed to their origin from binary neutron star (BNS) and/or neutron star-black hole (NSBH) mergers, which are expected to have a broad range of delay times, in part governing the types of stellar populations in which short GRBs occur (Belczynski et al. 2006; Nakar et al. 2006; Berger et al. 2007b; Zheng & Ramirez-Ruiz 2007). It is now known that the majority of short GRB hosts are indeed star-forming galaxies with moderate amounts of star formation of yr-1 (Berger 2009; Fong et al. 2013; Berger 2014), with in early-type galaxies with limits on their star formation of yr-1.
A subset of short GRBs have likely associations with galaxy clusters, which represent the universe’s largest gravitationally bound structures and compose of its stellar mass (Fukugita et al. 1998; Eke et al. 2005). Typically, galaxy clusters contain 10 or more galaxies and have total mass, including the dark matter halo, . The galaxy properties of those in clusters are distinct from those in the field: the frequency of early-type, older galaxies is higher than the field at similar redshifts ( in clusters and in the field at ; Tamburri et al. 2014; Hennig et al. 2017), and the fraction of stellar mass within clusters is dominated by large, massive galaxies, which in turn affects their star formation histories (SFHs) and average stellar population ages (Lara-López et al. 2010; Peng et al. 2010; Laganá & Ulmer 2018). Overall, the amount of star formation in galaxy clusters is low compared to the field and contains a significantly older stellar population. Thus, identifying transients associated with galaxy clusters enhances the populations that require long delay times from formation to explosion, lending crucial insight to their progenitors and formation timescales.
The relationships between transients and their discovery in galaxy clusters have been useful in lending clues to their progenitors. For instance, the discovery of some calcium-strong transients in old galaxy cluster environments points to an old stellar progenitor for at least a fraction of these systems (Lunnan et al. 2017; Frohmaier et al. 2018). Type Ia supernovae (SNe Ia) have higher rates in both early-type field and cluster galaxies than Type Ib/c and II SNe; this is commensurate with their white dwarf (single- or double-degenerate) progenitors and massive star origins, respectively (Mannucci et al. 2008; Sand et al. 2008).
For both long and short GRBs, a few studies have focused on events discovered with the Burst and Source Transient Experiment (BATSE) and The Imaging Compton Telescope (COMPTEL), which provided a large sample of degree-scale localizations. These studies cross-correlated GRB positions with available galaxy cluster catalogues. For instance, Marani et al. 1997 analyzed BATSE and COMPTEL GRBs, finding very little correlation with clusters. Ghirlanda et al. 2006 reported weak correlations between short GRBs and galaxy clusters and additionally found that long GRBs have no correlation with clusters. Tanvir et al. 2005 cross-correlated BATSE short GRBs with nearby galaxies, including many in local clusters, finding positive correlations that become stronger when limiting to only early-type galaxies.
The launch of the Neil Gehrels Swift Observatory in 2004 (Gehrels et al. 2004) has enabled well-localized GRB positions and subsequent host galaxy associations. Among the population of Swift short GRBs (Lien et al. 2016a), have been robustly associated with host galaxies, and only three short GRBs have been reported as associated with galaxy clusters (Prochaska et al. 2006; Berger et al. 2007a); where all three are with massive, quiescent, early-type galaxies. Given early associations of short GRBs with massive quiescent galaxies (Berger et al. 2005; Bloom et al. 2006; Gehrels et al. 2006; Prochaska et al. 2006; Ferrero et al. 2007; Bloom et al. 2007), and the scaling of globular cluster frequency with stellar mass, it was originally thought that of short GRBs could be dynamically formed in globular clusters (Grindlay et al. 2006). However, more recent theoretical and observational studies have shown that globular clusters cannot contribute significantly to the fraction of BNS and NSBH mergers (Belczynski et al. 2018; Fong et al. 2019; Lamb et al. 2019; Ye et al. 2020). It is nonetheless expected that the rate of short GRBs in clusters matches the fraction of stellar mass in galaxy clusters. Finally, given that BNS mergers are in part responsible for -process enrichment (e.g., Eichler et al. 1989; Rosswog 2005; Goriely et al. 2011; Korobkin et al. 2012; Chornock et al. 2017; Drout et al. 2017; Kasen et al. 2017; Pian et al. 2017; Metzger 2019), the rate of short GRBs in clusters can be used to trace heavy-element enrichment in the ICM, akin to studies focused on reconciling metal enrichment of the ICM through studies of cluster Ca-strong transients and SNe Ia (Mulchaey et al. 2014).
Here we present observations of the Swift short GRB, GRB 161104A, and the identification of its large-scale environment as a galaxy cluster at a median redshift of . This event adds to a small subset of short GRBs known to be associated with galaxy clusters and is the highest-redshift cluster association to date. In Section II, we present the observational data of the GRB 161104A and the galaxies in the immediate vicinity. We discuss the large-scale environment of the region containing GRB 161104A and its cluster association using galaxy catalogues in Section III. We describe our stellar population fitting of the host of GRB 161104A and several surrounding galaxies and present a uniform reanalysis of a sample of 20 short GRB hosts in Section IV. We also identify the large-scale environment of another short GRB, GRB 090515, as a galaxy cluster at . Finally, we compare GRB 161104A to the other known short GRBs in galaxy clusters, the short GRB host population, and other transients discovered in galaxy clusters in Section V. Unless otherwise noted, magnitudes are in the AB system and uncertainties correspond to confidence. We employ a flat CDM cosmology of Hubble constant = 69.6 , matter density = 0.286, and cosmological constant = 0.714 (Bennett et al. 2014).
| Date | Facility | Instrument | Exposures | Band | G1 (Host) | G2 | G3 | G4 | G5 |
|---|---|---|---|---|---|---|---|---|---|
| (UT) | (s) | (AB mag) | (AB mag) | (AB mag) | (AB mag) | (AB mag) | |||
| 2018 Jan 7 | Magellan/Baade | IMACS | |||||||
| 2016 Nov 6 | Gemini-South | GMOS | |||||||
| 2016 Nov 7 | Magellan/Baade | IMACS | |||||||
| 2016 Nov 7 | Magellan/Baade | IMACS | |||||||
| 2018 Jan 7 | Magellan/Baade | IMACS | |||||||
| 2016 Nov 8 | Magellan/Baade | Fourstar |
Note. — The most probable host galaxy of GRB 161104A is Galaxy “G1”. All magnitude values have been corrected for Galactic extinction in the direction of the GRB (Schlafly & Finkbeiner 2011). The values that we use for each filter are mag, mag, mag, mag, and mag.
II Observations
II.1 Discovery of GRB 161104A
The Neil Gehrels Observatory’s (Gehrels et al. 2004) Burst Alert Telescope (BAT) triggered on GRB 161104A at 09:42:26 UT and measured a single-peaked light curve with duration s (15-350 keV), thereby qualifying it as a short GRB (Mingo et al. 2016; Lien et al. 2016b). The fluence was measured to be erg cm-2 in the 15-150 keV band. At the time of the trigger, BAT localized the burst to R.A. = , decl. = (J2000), with a radius and 90 containment. Based on the data taken with the Photon Counting mode on the X-ray Telescope (XRT), this localization was later improved to a radius at R.A. = , decl. = , with 90 confidence (Evans et al. 2009; Mingo et al. 2016). A single X-ray data point was detected at s (where is the time since the BAT trigger) but faded below the XRT detection limit by s. Approximately s after the BAT trigger, the Swift Ultraviolet/Optical Telescope (UVOT) observed the position of GRB 161104A with the white filter, finding no optical afterglow to mag (Mingo et al. 2016).
Further ground-based follow-up observations were taken with the Gamma-Ray Burst Optical/Near-Infrared Detector (GROND) on the MPG telescope at the European Southern Observatory (Guelbenzu et al. 2016) and Gemini-South (Troja et al. 2016). GROND took simultaneous - images at hr and Gemini-South took band imaging at hr. Both observations identified four optical sources within or around the XRT position, which will be discussed further in Section II.2.
Additionally, there was X-ray follow-up at ks with the Chandra X-ray Observatory (Weisskopf et al. 2000) that reported an upper limit of erg s-1 cm-2 (Margutti et al. 2016).
II.2 Optical and Near-infrared Observations

We retrieved available imaging of the location of GRB 161104A taken with the Gemini Multi-Object Spectrograph (GMOS) mounted on the m Gemini-South telescope (PI Troja; GS-2016B-Q-28) and first reported in Troja et al. 2016. The GMOS observations consist of s of band imaging taken at a midtime of hr. We create bias and flat-field frames using associated calibrations in the Gemini archive, and apply these calibrations to the science images using the gemini package in IRAF. We produce a median-combined image and perform astrometry with stars in common with the Two Micron All Sky Survey (2MASS) catalogue. We identify three extended sources coincident with the XRT position, only one of which is fully encompassed by the XRT position. This source is clearly a galaxy, first reported in Guelbenzu et al. 2016 (Figure 1).
We acquired further, deeper imaging on 2016 November 7 UT at days (PI: Fong) with the Inamori-Magellan Areal Camera and Spectrograph (IMACS) instrument on the m Magellan-Baade telescope in better conditions than the initial Gemini imaging. We took s in the band and s in the band. We reduced and stacked the data in the same manner as the Gemini data, using standard packages in the ccdred package in IRAF. We identify the same three sources detected by Gemini and one additional source along the edge of the XRT position. Hereafter we refer to these sources as G1 (source fully within the XRT position), G2, G3, and G4 (Figure 1).
To assess the presence of an afterglow related to any of the sources, we perform image subtraction between the Gemini and IMACS band epochs using the HOTPANTS software package (Becker 2015). The lack of any sources in or around the XRT position in the residual image enables us to place a limit on the afterglow emission. We use the IRAF/phot package (Tody 1986; Tody 1993) to perform aperture photometry on faint sources in the Gemini band observations and place a limit of mag at hr, calibrated to a standard star field at similar air mass.
To better characterize G1-G4, we obtained band imaging with Fourstar on the Magellan-Baade telescope on 2016 November 8 UT ( days) reduced with a custom pipeline, as well as late-time and band imaging with IMACS on 2018 January 7 UT. For all filters, we perform astrometry using the Astrometry.net software, which uses sources in common with the USNO-B and 2MASS catalogues for absolute astrometry (Lang et al. 2010).
We perform photometry of all four sources, as well as a nearby galaxy, G5, which is serendipitously covered by our spectroscopy (Section II.3). To determine the zero-point of the images, we use a standard-star field at a similar air mass for the optical imaging and the 2MASS catalogue for band, and then convert to the AB system. We then use IRAF/phot, defaulting to an aperture of . Since the field is crowded, we select smaller apertures in some cases to avoid contamination from nearby objects. We correct the magnitudes of the sources for Galactic extinction, (Schlafly & Finkbeiner 2011). In Table 1, we present the details of the imaging observations and photometry of G1-G5. Figure 1 shows a color composite of the larger field of view of GRB 161104A, as well as the positions of G1-G5. We calculate G1 to be at a position of R.A. = , decl. = (J2000).
II.3 Spectroscopy
On 8 Nov 2016 UT, we obtained s of spectroscopy with Magellan/IMACS using a slit and the 200-line grism in the f/2 camera (first reported by Fong & Chornock 2016). The slit passed through G1, G4, and serendipitously through another galaxy, G5. The spectrum covered the optical wavelength range of Å. Basic two-dimensional image processing tasks and spectral extraction were performed in IRAF, while a flux calibration was applied using custom IDL routines. The spectrum of G1 exhibits a red continuum, lacks emission lines, has a discernible 4000 Å break at Å, and has distinguishable Ca II H and K absorption lines. These features classify G1 as an early-type, quiescent galaxy at . To determine the precise redshift and uncertainty, we cross-correlated with a galaxy template at age 2.5 Gyr using the model described in Bruzual & Charlot 2003 and find that . The spectrum of G4 exhibits a bluer continuum with a single emission line around 9780 Å. Similar to G1, the spectrum of G5 exhibits clear early-type, quiescent galaxy features. Based on the identifications of Ca II H and K absorption lines and a clear 4000 Å break, G5 also has a redshift of .
On 2017 February 2 UT, we took s dithered exposures of spectroscopy with the Low Dispersion Survey Spectrograph (LDSS) on the Magellan-Clay telescope, with the slit passing through G2, G3, and G4 (PI Berger). These spectra were also in the optical wavelength range, covering Å. We applied a bias correction and flat-field correction, aligned the dithered frames, and combined using standard tasks in the ccdred, longslit, and immatch packages in IRAF (Tody 1986; Tody 1993). We identified and extracted the spectral traces with the apextract package. We then applied a wavelength solution to the spectra using Ne-He-Ar arc lamps taken on the same night and a flux calibration using the standard star LTT 4364, with tasks from the onedspec package. We also extracted error spectra using the co-added spectra with no background subtraction and divided by , where is the number of exposures. G3 exhibits a red continuum with no obvious features, but it is too faint for a meaningful extraction. We identified a tentative 4000 Å break in the spectrum of G3 around 7000-7200 Å, translating to a probable redshift around ; there are no other apparent emission or absorption lines. We identified the same emission line as previously discussed in the spectrum of G4; however, no other lines are evident.
III Large-scale Environment
III.1 Putative Host Galaxy
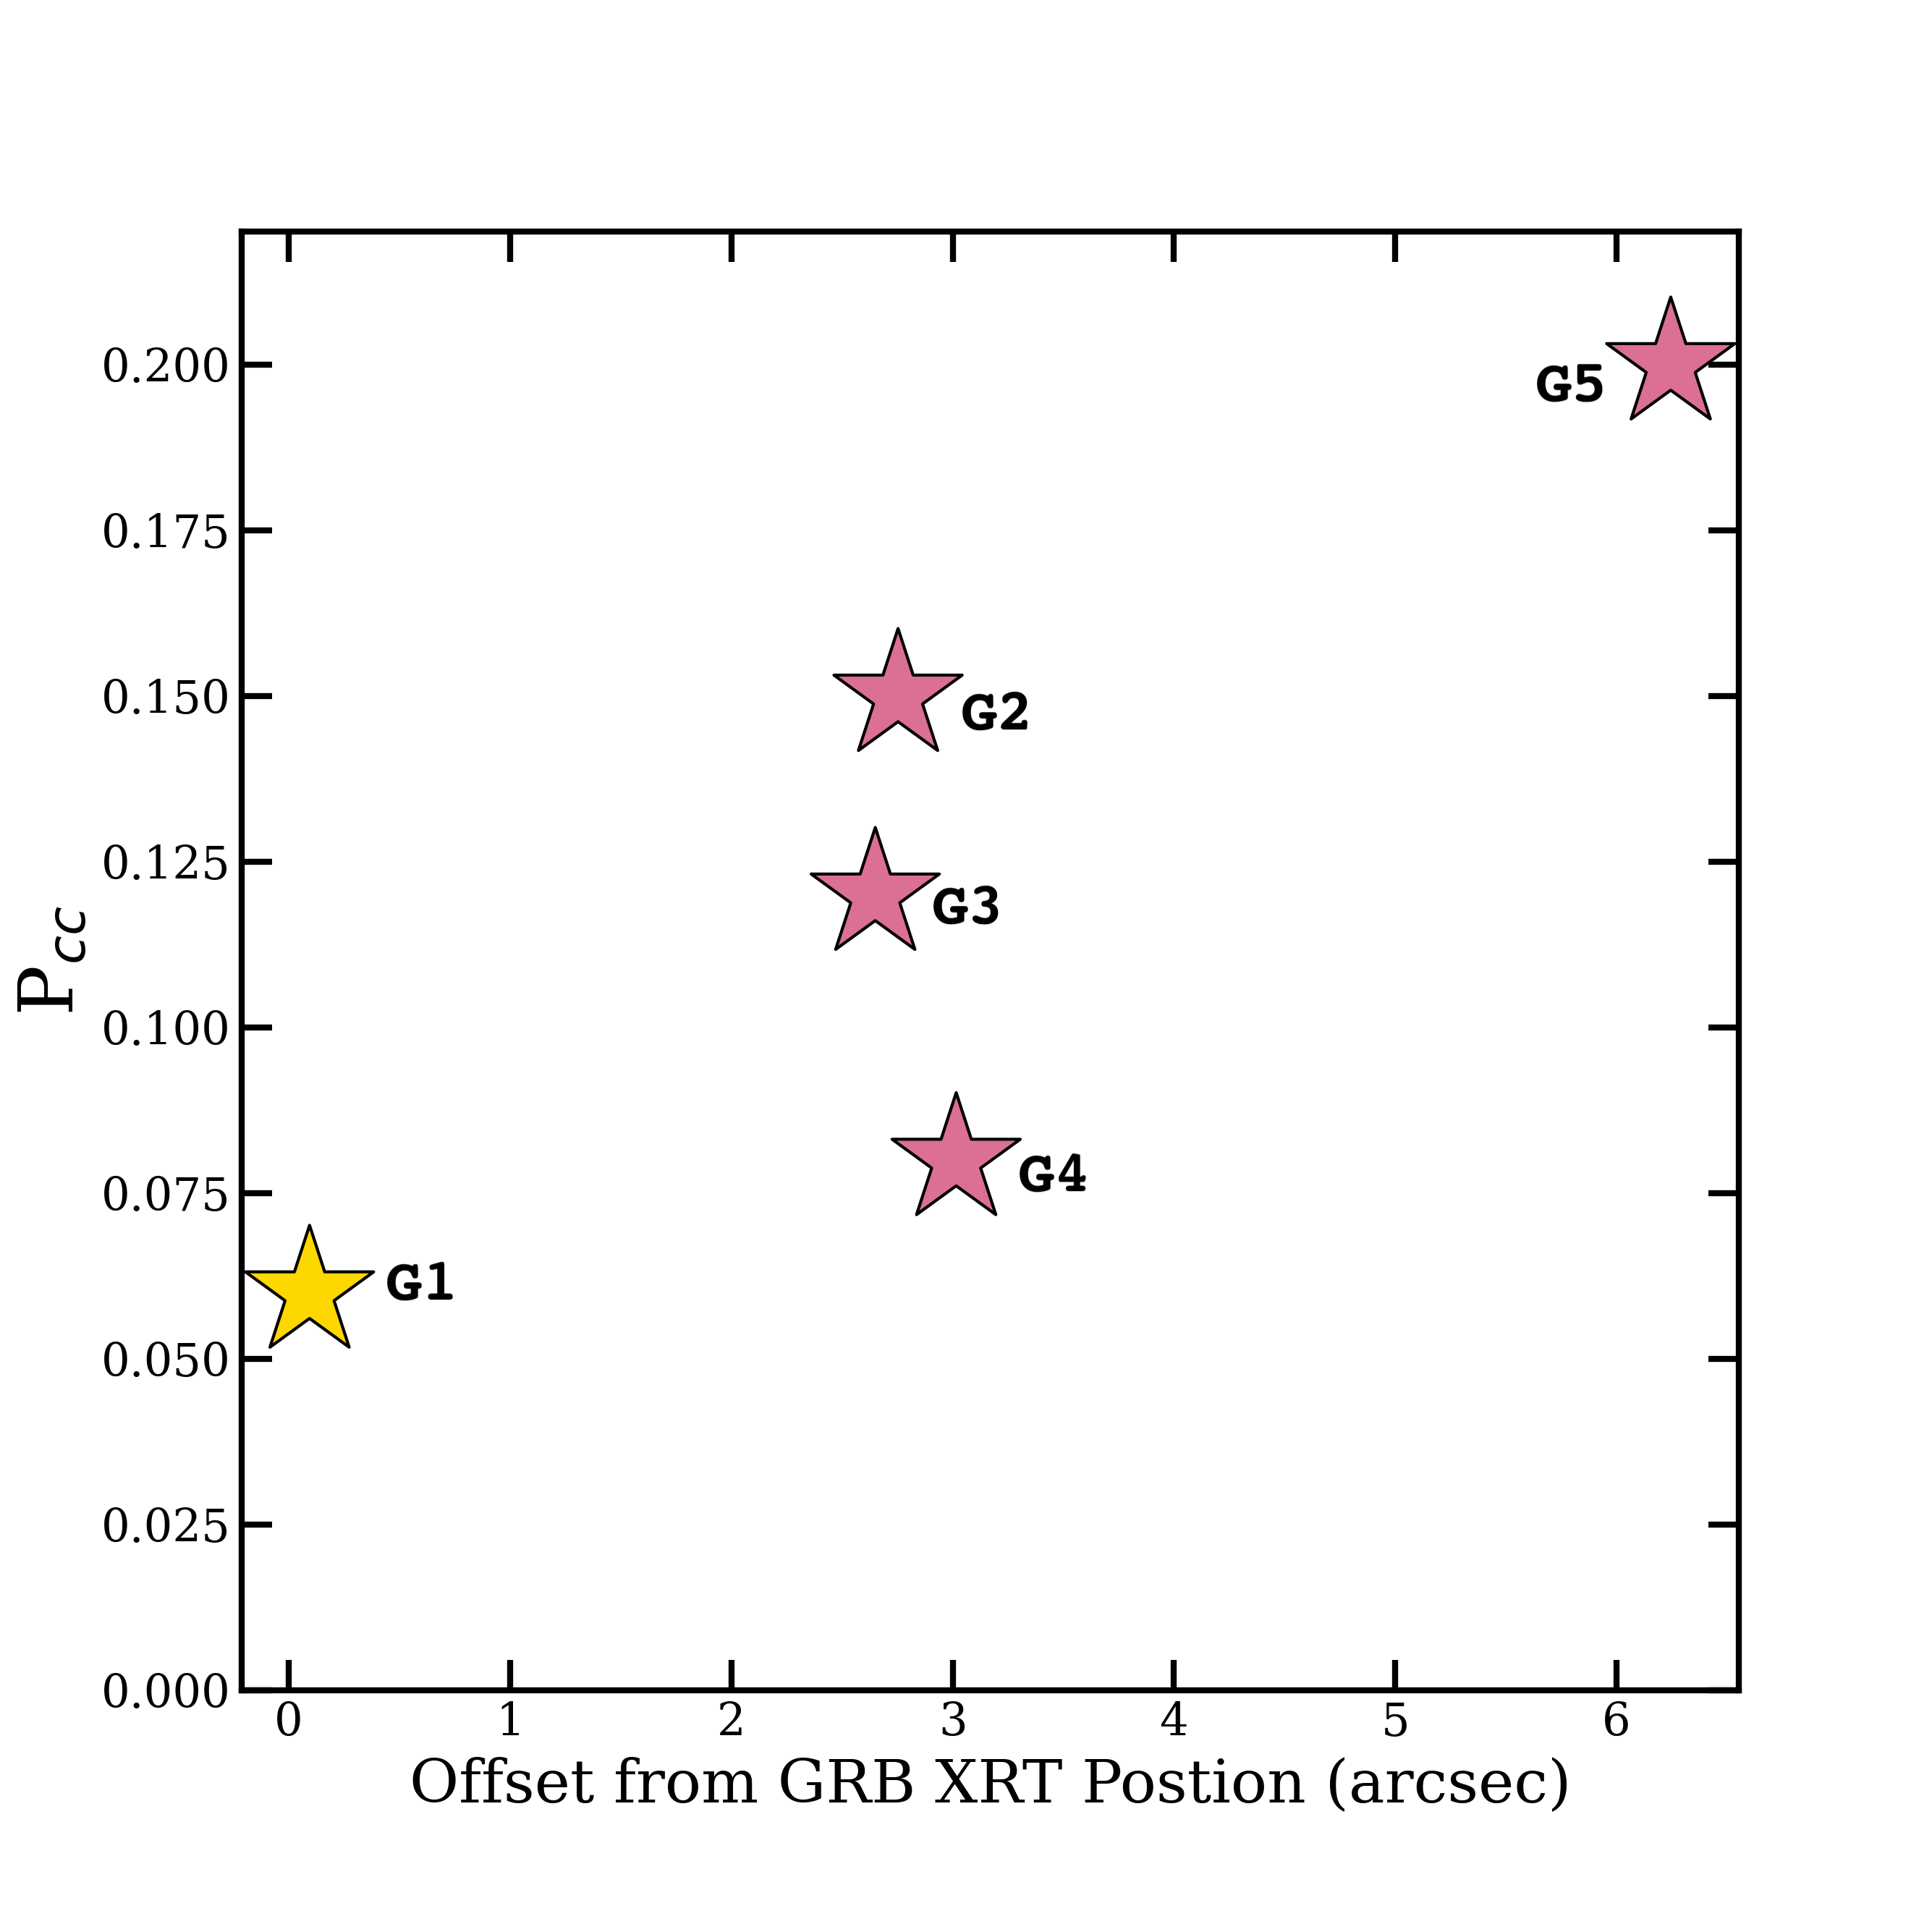
To quantify the likelihood that each of the sources G1-G5 is the putative host of GRB 161104A, we calculate the probability of chance coincidence, , at a given distance , and apparent optical magnitude (). In this method, a lower value of translates to a larger probability of being the host galaxy (Bloom et al. 2002). The value of is taken to be the maximum of (Bloom et al. 2002; Blanchard et al. 2016), where is the half-light radius of the galaxy and is the angular separation between the afterglow position and galaxy. For G1-G4, the final term clearly dominates owing to the relatively large XRT positional uncertainty of (converted to confidence). Thus, taking into account the astrometric tie uncertainty of , we use and our measured -band magnitudes (Table 1) to calculate the values of . We plot the value versus galaxy offset from the GRB XRT position in Figure 2. We find that G1 has the lowest value of , G4 is the next most probable galaxy with , and G2 and G3 have values of and , respectively.


We also calculate the probabilities for all extended sources within of the XRT position, finding that G5 has the next-lowest value of , while the remaining sources have values that exceed 0.5. Taken together, we find that G1 is the most probable host galaxy of GRB 161104A. However, most short GRB host associations have been made based on values of , given the large observed offsets from of short GRBs from their host galaxies (Fong et al. 2013). Given the similar value derived for G4, we cannot immediately discount an origin from G4 (Figure 1).
III.2 Cluster Membership
As seen in Figure 1, there are many galaxies in the vicinity of GRB 161104A, several of which exhibit similar colors. To assess their membership in a cluster or group, as well as the large-scale environment of GRB 161104A, we analyze a deg2 area around G1 using the Dark Energy Survey (DES; The Dark Energy Survey Collaboration 2005; Flaugher et al. 2015; Dark Energy Survey Collaboration et al. 2016) Year 1 GOLD dataset of galaxies (Drlica-Wagner et al. 2018), which includes high-precision photometric data, including extinction-corrected multiband photometry, star-galaxy classification (Sevilla-Noarbe et al. 2018), and accurate photometric redshifts (; Hoyle et al. 2018). We note that although there are X-ray data with Chandra and XMM, they are not sufficiently sensitive to place meaningful constraints on diffuse X-ray emission that are typical of lower-redshift and massive galaxy clusters (Forman & Jones 1982; Sarazin 1986). Moreover, we cannot define the cluster using velocity dispersion, as we do not have spectroscopic data of all the galaxies in the region and such studies are extremely challenging. Thus, we rely on the well-established photometric red sequence technique to determine determine cluster membership (Rykoff et al. 2016).
We begin by filtering all of the galaxies in the region to only include those with , as the photometric redshifts have an uncertainty of at least . We then select a radius area around G1, as this corresponds to a typical cluster radius of Mpc at . We determine that the brightest red galaxy in this region, i.e. the likely brightest cluster galaxy (BCG) lies at R.A. = , decl. = , about 1 Mpc from G1, with a magnitude of mag. We then shift the center of the cluster to the BCG and resolve that the rest of the cluster members are the reddest galaxies within a 1 Mpc radius of the BCG. We find that 68 galaxies in this region fit these classifications, and we designate these as “GRB 161104A cluster members.” These galaxies are also marked in Figure 1. We note that although we are able to locate G1 and G5 and include this in our filtering, the other galaxies surrounding GRB 161104A are too faint for the survey limits. Figure 3 shows the distribution of redshifts in the cluster sample compared to all galaxies in the deg2 region around GRB 161104A considered here. We see a clear peak at the redshift of the putative host galaxy (), while galaxies in the field (“GRB 161104A Field Galaxies”) span a wide range of redshifts as expected.
We next compare the colors and magnitudes of the galaxies in the putative cluster of GRB 161104A to those of known cluster members at similar redshifts. We use the DES Scientific Verification (SV) Red-Sequence Matched-Filter Probabilistic Percolation Cluster Finder (redMaPPer; Rykoff et al. 2014) catalogue of galaxy clusters (Rykoff et al. 2016) to collect all galaxies in clusters with . Our filtered sample includes 158 clusters containing a total of 11,019 galaxies. These galaxies are further compared with the galaxies in a region significantly wider than the cluster size (1.5 deg2 in area, corresponding to Mpc) surrounding GRB 161104A, which serve as a generic background/foreground galaxy population around the location of interest.
We determine the - color for all galaxies in the three populations: GRB 161104A cluster members, field galaxies, and redMaPPer cluster galaxies. We select - since the 4000 Å break at would fall between these bands, a feature that is on average more pronounced for older cluster galaxies, and which helps to separate galaxy populations into red sequence and blue cloud. We show a color-magnitude diagram and a histogram of the colors for all three populations in Figure 4. Overall, we find that the majority of the galaxies in the GRB 161104A cluster member sample fall within the expected color-magnitude range for cluster galaxies at similar redshifts and are redder than the GRB 161104A field galaxy sample. Finally, we explore the field galaxies within of the BCG, corresponding to galaxies, to ensure that the galaxies we have selected as noncluster members trace the same part of parameter space as the field galaxies selected from a larger region. Indeed, we find that they occupy the same region in the color-magnitude diagram as the wider-field galaxy selection (Figure 4), thus lending weight to our “cluster members” criteria.
Focusing on the five galaxies in the vicinity of GRB 161104A, we find that G1, G3, and G5 exhibit similar redder colors both to galaxies in the putative cluster and to the redMaPPer known cluster sample, which supports our conclusion that they are all cluster members. We also note that G4 clearly exhibits bluer colors than the red sequence (see Section IV.1) and G2 is too faint to infer proper membership. Thus, we find that if GRB 161104A is associated with G1, then it likely originated from a galaxy cluster.
To further assess GRB 161104A’s association with the galaxy cluster, we find the probability that a random sight line intersects a galaxy cluster, by determining the full angular sky coverage occupied by clusters using the redMaPPer catalog (which is fairly complete to ). Specifically, for each cluster in the redMaPPer sample, we calculate the angular extent on the sky assuming a 1 Mpc radius at the relevant redshift of each cluster, which gives the total square degrees occupied by redMaPPer clusters. We then use the total sky coverage of the survey (116 deg2) to calculate the chance of a sight line intersecting any cluster, assuming that the redMaPPer area surveyed is representative of the full sky. We find that for the full sample of clusters, the chance of intersecting any cluster is (). However, given that the putative host cluster redshift of GRB 161104A is , we recalculate this using only redMaPPer clusters at this redshift and find that the probability of intersecting a cluster at this redshift is significantly lower, at 0.6% (). Thus, GRB 161104A has a low probability of being randomly aligned with a cluster within our detection limits. We also modify the method described in Section III.1 to account for the surface density of galaxies (in number arcsec-2) in clusters from Rykoff et al. 2016 brighter than or equal to the band magnitude of G1 (). This modified equation would thus measure the probability of chance coincidence that the GRB is associated with a galaxy within a cluster, finding , which suggests that it is unlikely that GRB 161104A would occur in a cluster galaxy by chance.
IV Stellar Population Modeling
IV.1 Prospector
To determine the stellar population properties of G1 and the surrounding galaxies, we model their available data with the Python package Prospector (Leja et al. 2017). Prospector is a stellar population inference code that applies a nested sampling fitting routine to the available observed photometry and spectroscopy of a galaxy to determine properties such as redshift (), stellar mass (), stellar population age, SFH, dust extinction (), and metallicity (). These properties can either be set to a fixed value or varied over a specified range to determine the best-fit values. For each free parameter, Prospector returns a full posterior distribution, allowing for the determination of accurate uncertainties in individual parameters. In addition, Prospector utilizes dynesty (Speagle 2020) to perform nested sampling, Python-FSPS (Flexible Stellar Population synthesis; Conroy et al. 2009; Conroy & Gunn 2010) to build its stellar population models, and also uses WMAP9 cosmology internally (Hinshaw et al. 2013).
For all of our stellar population models, we use a Chabrier initial mass function (IMF) (Chabrier 2003), the Milky Way Extinction Law (Cardelli et al. 1989), and a parametric delayed- SFH, where
with the total mass formed and the sampled mass metric, and , a free parameter that describes the look-back time at which star formation commences. Similar to the other stellar population properties, can also be set to a free parameter. The parameters and can be used to find , the mass-weighted stellar population age, through the equation
The mass-weighted age is a more physically meaningful metric of age than the parameter , which simply measures the time at which star formation commenced (Conroy 2013). We can further use and to find stellar mass in units with the approximation
(Leja et al. 2013). Stellar mass is the preferred mass metric as opposed to total mass formed, as it measures the mass retained by the stellar population as it was observed. From here on, we only quote the mass-weighted ages () and stellar masses (). Furthermore, we allow for nebular emission in all our fits to gauge the strength and location of spectral lines. For fits that include an observed spectrum, we add two additional parameters to our fits: a fixed parameter , where is the order of the Chebyshev polynomial to fit the continuum of the observed spectrum, and a free parameter, , which describes the normalization of the observed spectrum to the model spectrum continuum and should ideally converge to 1. If we have prior knowledge of the redshift of the galaxy and apply it in our fits, we set the maximum possible age to the age of the universe at that redshift. For galaxies with no known redshift, we set the maximum ages to the age of the universe at the minimum possible redshift. We determine the maximum age constraints using Wright 2006, which also uses WMAP9 cosmology.
For this work, we find that the delayed- SFH is advantageous, as opposed to a nonparametric SFH, as it is directly comparable to most previous work in the field and enables uniform analysis for galaxies with only photometry (Conroy 2013; Leja et al. 2019). We note that the major difference between full nonparametric and delayed- models for the SFH is in the age and mass estimates: as shown in Leja et al. 2019, ages are systematically three to five times older, while masses are typically 25%-100% larger.

IV.2 Stellar Population Properties
Here, we describe fits to all available data for G1-G5. For all fits we use Sloan Digital Sky Survey (SDSS) filter response curves (Doi et al. 2010), which Prospector uses to calculate fluxes from the model spectrum and determine the effective wavelengths for the photometry in the bands. We also use the relevant Fourstar response curve for -band photometry (Persson et al. 2013).
Since G1 has a moderate signal-to-noise ratio (S/N) spectrum with clear absorption lines, we use both the spectrum and photometry in the fitting. We use a -order Chebyshev polynomial to fit the spectral continuum, as this will capture fluctuations in the spectrum on the scale of Å. We present a comparison of the model and observed spectroscopy and the model and observed photometry in Figure 5, where the model plotted is characterized by the median of parameter posteriors (Table 2). The median model exhibits remarkable consistency with the observed data. The posterior distributions of the parameters from the nested sampling fitting and the parameter correlations are shown in Figure 6, with median and uncertainties denoted.
Our best-fit solution shows that G1 has an older stellar population, with a median age of Gyr and a stellar mass of , typical for short GRB hosts (Berger 2014). The metallicity of log( is consistent with the relation at given the stellar mass and redshift of G1 (Laskar et al. 2011; Savaglio et al. 2005). The low dust extinction of mag is expected, as quiescent galaxies do not contain much dust. We also find . Using the SFH, we determine an SFR at of yr-1. We also derive a upper limit on the SFR from the absence of [OII], by calculating the expected integrated flux based on the error spectrum within a Å wavelength region of the [OII] doublet. Using the relationship between [OII] luminosity and SFR (Kennicutt 1998), we obtain SFR yr-1, which is in agreement with the results from the spectral energy distribution (SED) fitting.

| Galaxy | z | [Gyr] | ||||
|---|---|---|---|---|---|---|
| G1⋆ | ||||||
| G2 | ||||||
| G3 | ||||||
| G4 | ||||||
| G5 |
Note. — We present the median values of the posterior distributions and their uncertainties from our Prospector runs. We use the spectroscopically determined redshift for G1 and G5. For G2 and G3, we use the inferred redshift based on the color of the galaxy. We use the potential redshifts based on the one emission line found for G4. Other parameter values are fixed only if the data quality is not sufficient enough to run a full six-parameter fit.
⋆ We consider G1 to be the most likely host galaxy of GRB 161104A.
† Spectroscopically determined redshift.
†† Fixed value in Prospector based on inference.
Since G2, G3, and G4 lie on the outskirts of the XRT position (Figure 1), we also determine the stellar population properties with all the available data. For G2, we only use the photometry in the fitting, as the spectroscopy is too low S/N to extract. Furthermore, because we do not have a redshift for this galaxy, we perform a fit where we allow the redshift to be a free parameter and another where we set it to , as it has similar colors to the other galaxies in the field and is likely part of the galaxy cluster (see Section III). For the fit in which redshift is free, we find that the median and uncertainty is , with a noticeable peak in the posterior distribution at . For the fit with fixed , we determine the mass-weighted age to be Gyr, younger than G1, with a lower inferred mass of (Table 2).
For G3, the average S/N of the LDSS3 spectrum is similarly low, , and there are no definitive spectral features other than a reddening that could be interpreted as a 4000 Å break at Å; thus, we only use the photometry in the fit. Similar to G2, we initially perform a fit in which redshift is a free parameter, finding , with some probability out to that . Motivated by the possible 4000 Å break, as well as the presence of the galaxy cluster (Section III), we set as a fixed parameter, finding Gyr and an inferred stellar mass of (Table 2). We also note that the choice of redshift between and does not have a large effect on the remaining parameters.
The IMACS and LDSS3 spectra of G4 exhibit only one clear emission line at 9776 Å. We examine possible identifications for this line, among H , [OII] , [OIII] , or H . If the line is [OIII] or H, the locations of [OII] or H at the corresponding redshifts would be covered by the spectra, yet are not detected. Given that the line strengths of [OII] or H are typically stronger than H and [OIII], their absence rules out H and [OIII] as viable candidates for the observed line. If this line is [OII] or H, this gives redshifts of and , respectively. For , the locations of H, H, and [OIII] are not covered by our spectrum. However, if , the locations of H, [OII], and [OIII] are covered but not detected. Thus, the most likely redshift is and we only perform a fit at this redshift. We find a young ( Gyr) stellar population with a mass .
Similar to G1, we use the spectrum, photometry, and spectroscopically determined redshifts to fit for the stellar population properties of G5. We determine the uncertainty on the redshift in the same manner as we did for G1, finding . We set and use a -order Chebyshev polynomial to fit the continuum of the spectrum. Our Prospector results show that G5 is about the same age as G1; however, it is much more massive, with (Table 2). The model fits both the observed spectrum and photometry well and correctly identifies the location and strength of the Ca II H and K absorption lines, implying an overall good fit. We also tested subsolar metallicities (), which only increased the stellar population age.
In summary, we find that the most probable host galaxy G1 is an early-type galaxy that is old ( 2.12 Gyr), is massive (), and has a low amount of ongoing star formation ( yr-1) with stellar population properties that agree with those of quiescent, early-type galaxies. We also find that G2 and G3 are consistent with originating from a similar redshift as G1 and G5 (), although the quality of the data does not allow us to make definitive conclusions. The placement of G3 in the color-magnitude diagram (Figure 4; see Section III) further indicates that it is most likely at a similar redshift to that of G1 and G5. Finally, we find that G4 is likely a high-redshift, background galaxy at .
IV.3 Literature Sample

In order to compare the stellar population properties of the putative host G1 to those of other known short GRB hosts, we additionally collect photometric data from the literature, using the sample of Leibler & Berger 2010, as well as the host of GRB 050813, another galaxy potentially in a cluster (Prochaska et al. 2006; Ferrero et al. 2007; see Section III). This sample contains multiband optical and near-IR (NIR) imaging for 19 hosts. We use this data set because it represents a uniformly analyzed photometric sample and represents the overall properties of the short GRB host population to provide an adequate comparison set.

| GRB | Typea | z | [Gyr] | ||||
|---|---|---|---|---|---|---|---|
| 050509Bb | E | 0.225 | 1.16 | 10.88 | -0.99 | 0.03 | |
| 050709 | L | 0.161 | 3.16 | 8.74 | 0.51 | 0.08 | |
| 050724 | E | 0.257 | 7.58 | 0.16 | 11.09 | -0.57 | 0.04 |
| 050813b | E | 0.716 | 2.30 | -0.06 | 10.22 | -0.39 | |
| 051210 | ? | 0.67 | -0.57 | 9.07 | 0.34 | ||
| 051221A | L | 0.546 | 0.76 | -1.92 | 9.32 | -0.96 | 0.11 |
| 060801 | L | 1.130 | 0.22 | -1.49 | 9.17 | 0.39 | 0.27 |
| 061006 | L | 0.438 | 1.11 | 8.84 | -0.03 | 0.37 | |
| 061210 | L | 0.410 | 0.58 | 9.50 | -0.98 | 0.58 | |
| 061217 | L | 0.827 | 0.30 | 8.94 | 0.11 | 0.06 | |
| 070429B | L | 0.902 | 0.68 | 10.49 | -0.67 | 1.08 | |
| 070714B | L | 0.923 | 0.88 | 9.28 | 0.36 | ||
| 070724 | L | 0.457 | 1.09 | 0.11 | 9.89 | 0.44 | 0.41 |
| 070729 | ? | 2.21 | -0.34 | 10.13 | -0.77 | 0.53 | |
| E | 0.473 | 3.14 | 10.95 | -0.71 | |||
| 071227 | L | 0.381 | 0.81 | 0.15 | 10.46 | -0.57 | 1.84 |
| 080123 | L | 0.495 | 0.59 | -0.40 | 9.88 | -0.03 | 0.81 |
| 090510 | L | 0.903 | 2.19 | 0.06 | 9.95 | 0.46 | |
| E | 0.403 | 5.49 | 10.87 | -0.58 | |||
| 100117 | E | 0.920 | 2.23 | 10.15 | -0.30 | ||
| 161104Ab | E | 0.793 | 2.12 | 0.08 | 10.21 | -0.54 | 0.08 |
| All Hosts | 1.07 | 0.0 | 9.94 | -0.3 | 0.11 | ||
| Early-type | 2.79 | 0.0 | 10.82 | -0.54 | 0.0 | ||
| Cluster | 2.29 | 0.0 | 10.45 | -0.56 | 0.02 |
Note. — Here we show the median stellar population property values determined through Prospector for the 20 sampled short GRB hosts described in Leibler & Berger 2010 and Ferrero et al. 2007. Redshift values are fixed and all other parameters are free unless specified otherwise. We also show the median values for all hosts, quiescent/early-type, and cluster short GRB hosts.
a Type classified in Leibler & Berger 2010 and Prochaska et al. 2006.
b Galaxies in clusters.
c Redshift determined through Prospector.
d Fixed value in Prospector.
e From Zevin et al. 2019.

We determine the stellar population properties of the 20 host galaxies with Prospector, using the same methods as detailed in Section IV.1. For the 19 hosts in Leibler & Berger 2010, we use the photometric observations listed in Leibler & Berger 2010, Fong et al. 2010, and Fong & Berger 2013, correcting for Galactic extinction when relevant (Schlafly & Finkbeiner 2011). Each GRB host has at least four bands used in the fits. We use standard filter transmission curves from SDSS, the 2MASS (Skrutskie et al. 2006), and Wide Field Camera 3 (WFC3/IR and WFC3/UVIS; Dressel 2012) in the Prospector fits of these galaxies. We include redshift as a fixed value in the Prospector fitting for galaxies with a spectroscopic redshift. We determine photometric redshifts for GRB 051210 and GRB 070729 with Prospector. For GRB 050813, we collect available photometry for the most likely host galaxy at a fixed redshift of (Ferrero et al. 2007). We find photometric observations of this galaxy in standard SDSS and Wide-field Infrared Survey Explorer (WISE) (Wright et al. 2010) filters in the Legacy Survey Data Release 8 (Dey et al. 2019). For this work, we concentrate on comparing the mass-weighted ages and stellar masses, and the median values are listed in Table 3.
We next divide the 20 host galaxies into three groups to compare to the host galaxy of GRB 161104A (G1): all host galaxies, early-type host galaxies, and host galaxies in clusters. By default, there is overlap between the populations. Early-type classifications are defined as galaxies with limits on the SFRs of yr-1 (Leibler & Berger 2010; Prochaska et al. 2006) and are marked in Table 3. Within the entire sample, there are three hosts in addition to G1 that have been identified as cluster members: those of GRB 050509b, GRB 050813, and GRB 090515 (Prochaska et al. 2006; Berger et al. 2007a; Ferrero et al. 2007). We confirm the cluster association of GRB 090515 in this work, applying the same methods as described in Section III for GRB 161104A. From the Dark Energy Spectroscopic Instrument (DESI) imaging dataset (DESI Collaboration et al. 2016), we find all galaxies to be within a radius around the brightest galaxy near the GRB location, where (assuming the photometric redshifts from Zhou et al. 2020). There are galaxies in this sample. We compare this sample to the - colors of the redMaPPer cluster galaxies within the same photometric redshift range and the field galaxies around GRB 090515. We find that the putative cluster has a clear red sequence that matches the colors of the redMapper cluster galaxies well and differs from the field galaxies, which we demonstrate in Figure 7. We further quantify GRB 090515’s association to the cluster using the method described in Section III.2, finding that , which implies low chance coincidence. Thus, we confirm both the presence of a cluster around GRB 090515 and the association to the cluster.
We construct cumulative distributions for each of the three groups by combining the individual host posterior distributions and normalizing the areas under the probability distributions to unity. The resulting cumulative distributions for stellar mass and mass-weighted age for each category, along with the comparison to the values of G1 are shown in Figure 8. We find median values and 68% confidence intervals for the “all hosts” population, and Gyr; for the early-type population, and Gyr; and for the cluster population, and Gyr. Overall, the host galaxy of GRB 161104A is a younger and less massive galaxy than the medians of the samples of both early-type and cluster galaxies (Figure 8).
V Discussion
V.1 Comparison of GRB 161104A to Cluster Short GRBs
Given that the XRT position of GRB 161104A fully encompasses a galaxy at , coupled with the spatial coincidence with a galaxy cluster at , we find this to be the most likely redshift and host association of GRB 161104A. We note that we cannot rule out an origin from G4 (tentatively at ) based on chance probability arguments alone. However, the likelihood of association to G4 is comparatively small given the decreased sensitivity of Swift in detecting short GRBs (Behroozi et al. 2014); indeed, there are only three short GRBs to date confirmed to be at (Paterson et al. 2020). At , the Swift/XRT afterglow luminosity is erg s-1 (0.3-10 keV; Evans et al. 2007) at a rest-frame time of hr after the burst, which is in the lower when compared to short GRB afterglows with known redshifts at similar rest-frame times. The deep limit on optical afterglow emission of mag (see Section II.2) also constrains the optical emission to be similarly faint, with erg s-1 at a rest-frame time of days post-burst. This places GRB 161104A in the bottom for both detected afterglows and upper limits at the same time, as shown in Figure 9. These results can naturally be explained by an event originating from an elliptical galaxy, which on average have lower gas densities than star-forming galaxies, which results in fainter afterglow emission.
We next compare GRB 161104A to the -ray, afterglow and host galaxy properties of short GRBs known to be associated with galaxy clusters. With the addition of both GRB 090515 and GRB 161104A, there are five such Swift short GRBs: GRB 050509B (; Bloom et al. 2006), GRB 050813 (; Ferrero et al. 2007), GRB 050911 (; Page et al. 2006), GRB 090515 (; this work), and GRB 161104A (). GRB 050911 is classified as a short GRB with extended emission (Lien et al. 2016a), and the BAT -ray position is coincident with a low-redshift cluster at with a confidence of association at the level (Berger et al. 2007a). While the positional uncertainty precludes a clear host association, we still include this event as a cluster short GRB in our subsequent comparisons. We find that cluster short GRBs have s, except for GRB 050911, which has s, with a s initial spike. The fraction of Swift short GRBs that have sec is 53.7%. Thus, cluster short GRBs appear to trace the bottom half of the distribution, solidifying their membership as true short GRBs.
Turning to their afterglow properties, with the exception of GRB 050911, all of the cluster short GRBs have detected XRT afterglows, with localizations of roughly a few arcsec. However, their X-ray afterglows are uniformly faint with erg s-1- erg s-1, far below the median values at contemporary times after the bursts lying at (Figure 9). Similarly, there are deep limits on optical afterglow emission for GRB 050509B (Bloom et al. 2006) and GRB 161104A, while GRB 090515 had a detected optical afterglow (Rowlinson et al. 2010) but is among the least luminous afterglows compared to short GRBs. To adequately compare them to the short GRB sample, we collect all optical afterglow detections with days (chosen to encompass as many cluster short GRBs as possible), as well as upper limits. We use the Kaplan-Meier estimator to create an inverse survival function to properly incorporate both detections and upper limits (Figure 9). Compared to this function, cluster short GRBs are in the bottom of the population, while GRB 090515 is at . These faint or undetected afterglows are likely a direct reflection of their low environmental densities (although we note that only GRB 050509B has an inferred density constraint of cm-3; Schroeder et al. 2020), and commensurate with their significant projected offsets from their respective host galaxies. While this value is highly uncertain for GRB 161104A ( kpc), the offsets extend to kpc for the remaining events in clusters, significant compared to the median short GRB offset of kpc (Fong & Berger 2013). These large offsets of cluster short GRBs could be explained by an observational bias, as galaxy clusters are composed of more massive galaxies on average, and thus the association to a nearby, massive cluster galaxy at a large offset will be more likely than a fainter, field galaxy at a smaller offset for a given short GRB. On the other hand, this may also indicate a specific physical mechanism within galaxy clusters that favors short GRBs, or a product of the fact that cluster galaxies have older stellar populations and thus long delay times that would naturally explain large offsets.
Of the cluster short GRBs, three have robust host associations: GRB 050509B, (; Bloom et al. 2006, GRB 090515 (; Fong & Berger 2013), and now GRB 161104A with , while GRB 050813 has a tentative host association based on the most likely host in its vicinity (; Prochaska et al. 2006; Ferrero et al. 2007). Given that the frequency of elliptical galaxies is higher by a factor of two in clusters than in the field (Dressler 1980; Whitmore et al. 1993), it is perhaps unsurprising that all of the cluster short GRB hosts discovered to date are early-type galaxies with little or no signs of ongoing star formation. Their redshifts span , with GRB 161104A setting the high-redshift end of this range.
Cluster short GRB hosts also appear to follow the morphology-density relation, in which dense cluster centers contain a larger fraction of massive, elliptical galaxies, compared to an increasing fraction of star-forming galaxies toward less dense regions (Dressler 1980). The host galaxy of GRB 050509B has (where is the characteristic luminosity in the galaxy luminosity function; Berger 2014) and a stellar mass of . Given that it is significantly brighter and more massive than its surrounding galaxies, it is likely the BCG of its cluster (Bloom et al. 2006). The host of GRB 090515 may also be a BCG, with a similarly large stellar mass of , and a high spatial density of luminous galaxies in its vicinity. In contrast, the host galaxy of GRB 161104A G1, is at a considerable distance ( Mpc) from its presumed BCG and has a measurable, low rate of star formation. Its stellar population is presumably less affected by the high densities at the center of the cluster and is also commensurate with its higher redshift, younger age, and lower stellar mass compared to those of other cluster short GRBs.
V.2 GRB 161104A in the Context of Short GRBs and Cluster Transients
Overall, the short GRB host galaxy population is diverse, with short GRBs originating from star-forming galaxies with signatures of ongoing star formation (star-forming, late-type), as well as host galaxies with no sign of star formation (quiescent, early-type). This diversity is a reflection of a broad progenitor delay time distribution and can be naturally explained in the context of a BNS merger progenitor with a wide range of merger timescales (Belczynski et al. 2006; Nakar et al. 2006; Berger et al. 2007b; Zheng & Ramirez-Ruiz 2007; Fong & Berger 2013). As expected for early-type galaxies, the host of GRB 161104A has a higher stellar mass and older mass-weighted age than the respective medians for the entire population (at the 63% and 71% level, respectively), but a lower average stellar mass and younger age when compared to short GRB early-type and cluster hosts (Figure 8). Thus, the stellar population properties of the host of GRB 161104A appear to be more in line with those of field galaxies than cluster hosts, also consistent with its location with respect to the BCG within its cluster.
With the addition of GRB 161104A, there are now 10 early-type short GRB host galaxies (the others are GRB 050509B, GRB 050724A, GRB 050813, GRB 060502B, GRB 070809, GRB 090515, GRB 100117A, GRB 100625A, and GRB 150101B; Bloom et al. 2006; Berger et al. 2005; Bloom et al. 2007; Ferrero et al. 2007; Berger 2010; Fong et al. 2011; Fong et al. 2013; Fong et al. 2016). In comparison with the 38 short GRBs with enough spectroscopic information to constrain their SFRs, the early-type fraction composes 26%. Given that current state-of-the-art cluster catalogues are only complete to (Rykoff et al. 2016; Abbott et al. 2020), compared to the short GRB redshift distribution, which extends to (Paterson et al. 2020), it is probable that there are additional associations to clusters among the Swift short GRB population. Given that short GRBs trace the low-luminosity regime of afterglows, events associated with cluster hosts or ICM environments are more likely to have undetectable afterglows than short GRBs with spatially coincident host galaxies.
We can obtain a lower limit on the fraction of short GRBs associated with clusters, set by the five known associations among the population with redshifts of . A more conservative lower limit comes from a comparison to the Swift short GRB population, or those detected to date that otherwise have no observing constraints that would preclude optical follow-up. This population totals 99 events, giving a conservative lower limit on the fraction of cluster short GRBs of . Finally, a somewhat less meaningful upper limit can be set by taking into account studies that have ruled out cluster associations for four events (Berger et al. 2007a; Fong et al. 2011), of . We also find that cluster short GRB hosts compose of the stellar mass of all short GRB hosts within the sample described in Table 3. Overall, these fractions align with the fraction of stellar mass in clusters of , and indirectly constrain the minimum fraction of short GRBs with long delay times.
Although we have not taken into account the latest short GRBs in our sample, it is interesting to note that the gravitational wave BNS merger GW 170817 (Abbott et al. 2017a), associated with GRB 170817A and with emission over a broad range of wavelengths (Abbott et al. 2017b), was also found in an old, early-type, elliptical galaxy, NGC 4993, with a stellar mass similar to G1 (; Blanchard et al. 2017; Palmese et al. 2017). NGC 4993 is part of a galaxy group containing 22 members (Kourkchi & Tully 2017), as opposed to for the galaxy cluster analyzed here. While it is likely that the host of GRB 170817A lives in a dark matter halo with significantly smaller mass than that of GRB 161104A, it is worth noting that in both cases the GRB can be associated with large-scale structure overdensities and possibly long delay times (Blanchard et al. 2017).
In addition to short GRBs, a few other transients have been linked to galaxy clusters and signify the existence of subpopulations with long delay times. Moreover, their nucleosynthetic outputs have been linked to the chemical enrichment of the ICM. For instance, some Ca-strong transients are associated with galaxy cluster environments at large offsets from their host galaxies (Lunnan et al. 2017) with no discernible signs of star formation at their explosion sites (Perets et al. 2010). While the progenitors of Ca-strong transients are unknown, the link of a substantial fraction to old stellar populations at large radial offsets has pointed to an origin from white dwarf progenitors in globular clusters (Shen et al. 2019). The isolated locations of these events, coupled with their rates, have also been shown to reconcile the Ca abundances in the ICM (Mulchaey et al. 2014; Frohmaier et al. 2018). Meanwhile, the rates of SNe Ia in clusters have also been used to reconcile observed Fe abundances in the ICM and have provided constraints on a ‘delayed’ channel. Among early-type galaxy and S0 hosts, SNe Ia have an enhanced rate in clusters versus the field (Sand et al. 2008) and also compared to other types of core-collapse SNe (Type Ib/c and Type II; Mannucci et al. 2008). This is commensurate with their older, single- or double-degenerate white dwarf progenitors (Maoz et al. 2014). In particular, the evolution of SN Ia cluster rates with redshift has been used to explain the distribution of Fe in the ICM, as well as the SN Ia delay time distribution and respective predictions for single- versus double-degenerate progenitors (Sharon et al. 2010; Barbary et al. 2012; Friedmann & Maoz 2018).
Looking forward, assuming that the majority of short GRBs are linked to BNS merger progenitors, the true fraction of short GRBs that occur in galaxy clusters may similarly play a role in -process element enrichment of the ICM and intracluster light (ICL). In addition, the large physical offsets of cluster short GRBs from their most probable hosts, relative to those associated with field galaxies, is of interest in understanding their origins. A natural explanation for the occurrence of short GRBs at tens of kiloparsecs away from their host galaxies, but within galaxy clusters, are the large systemic velocities that BNS systems may experience (Zevin et al. 2019), coupled with the older stellar population in clusters that contribute to longer delay times. Galaxy cluster studies have also shown that the ICL and BCGs compose of the cluster stellar mass (Zhang et al. 2019). In particular, the origins of the ICL and ICM has been linked to the disruption of dwarf galaxies (Gregg & West 1998) or the tidal stripping of outer material from more typical galaxy cluster members (Gallagher & Ostriker 1972; DeMaio et al. 2015; DeMaio et al. 2018). Since of short GRBs occur in the halos of their host galaxies (Fong & Berger 2013; Zevin et al. 2019), beyond a few effective radii, the locations of these short GRBs are situated amid prime material for stripping to contribute to the ICL and ICM.
VI Conclusions
We have presented identification of the early-type, quiescent host galaxy of GRB 161104A and a detailed investigation of the large-scale galaxy cluster environment surrounding GRB 161104A. We have also presented new modeling of 20 additional short GRB host galaxies, as well as the identification of the large-scale environment of GRB 090515 as a galaxy cluster. We summarize with the following conclusions:
- •
The putative host of GRB 161104A is an early-type, quiescent galaxy at . By jointly fitting the host photometry and spectroscopy from Magellan with Prospector, we determine a stellar mass of , a mass-weighted age of Gyr, metallicity of , dust extinction , and ongoing SFR yr-1.
- •
Using deep optical and NIR observations, we determine that the host of GRB 161104A and most of the galaxies surrounding the XRT position are at similar redshifts of . We confirm their membership in a cluster at a median redshift of using DES cluster catalogues. We also show that GRB 090515 resides in a cluster at . This makes GRB 161104A the fifth short GRB associated with a cluster and the highest-redshift short GRB known to be associated with a galaxy cluster.
- •
We model the broadband SEDs of 20 additional short GRB hosts and determine median stellar population properties of and Gyr. Compared to the other early-type and cluster host galaxies studied in this paper, the host of GRB 161104A is slightly younger and less massive. However, its mass and age are consistent with the median values of early-type, quiescent short GRB host galaxies.
- •
In comparison to short GRB optical and X-ray afterglow luminosities, the afterglows of cluster short GRBs are in the faintest and of observed optical and X-ray luminosity distributions, respectively, consistent with the expectation that they have lower circumburst densities.
- •
We calculate a lower limit on the fraction of Swift short GRBs in galaxy clusters of , and the fraction of stellar mass in cluster short GRB hosts of . This is consistent with the fraction of stellar mass in galaxy clusters at of .
The discovery of GRB 161104A in a galaxy cluster adds to the small number of short GRBs associated with galaxy clusters. Associating short GRBs with clusters is currently very difficult, given that few cluster catalogues reach the cosmological distances at which short GRBs occur and cover a wide enough region of the sky to capture the locations of the majority of short GRBs. For example, SDSS cluster catalogues are highly incomplete beyond (Rykoff et al. 2014), and current DES catalogues, which already provide a cluster sample over deg2, only reach (Abbott et al. 2020), and are complete for cluster members down to stellar masses of (Palmese et al. 2020). Moreover, confirmation via multislit spectroscopy or the detection of ICL in X-rays becomes extremely challenging beyond , as spatial clustering is less apparent and contamination with foreground and background galaxies is an issue at high redshifts.
Looking forward, the final DES Year 6 cluster catalogue, will be ideal for cluster associations of short GRBs, as it will cover over deg2 out to . Furthermore, the Vera C. Rubin Observatory (VRO; Ivezić et al. 2019) will identify clusters out to even larger redshifts over most of the southern hemisphere, and will thus be crucial to short GRB host and cluster associations. We therefore expect that short GRB rates in clusters will be significantly more constrained in the next decade, as more wide-field, deep surveys and catalogues are released. In parallel, modeling that incorporates both photometric and spectroscopic data of short GRB hosts is needed to fully understand their star formation histories, which are known to differ between galaxies in clusters and those in the field. Finally, given that BNS mergers are known sources of -process element nucleosynthesis, the actual cluster rate will be crucial in understanding enrichment of the ICM, as well as the contribution of a substantial ‘delayed’ channel of mergers.
Acknowledgments
We thank the anonymous referee for valuable feedback and suggestions. We also thank S. Coughlin for helpful discussions that aided this work. A.E.N. acknowledges support from the Henry Luce Foundation through a Graduate Fellowship in Physics and Astronomy. The Fong Group at Northwestern acknowledges support by the National Science Foundation under grant Nos. AST-1814782 and AST-1909358. This work was supported by the Fermi National Accelerator Laboratory, managed and operated by Fermi Research Alliance, LLC under contract No. DE-AC02-07CH11359 with the U.S. Department of Energy.
This work made use of data supplied by the UK Swift Science Data Centre at the University of Leicester.
This paper includes data gathered with the 6.5 m Magellan Telescopes located at Las Campanas Observatory, Chile. Based on observations obtained at the international Gemini Observatory (PI Troja; GS-2016B-Q-28), a program of NOIRLab, which is managed by the Association of Universities for Research in Astronomy (AURA) under a cooperative agreement with the National Science Foundation on behalf of the Gemini Observatory partnership: the National Science Foundation (United States), National Research Council (Canada), Agencia Nacional de Investigación y Desarrollo (Chile), Ministerio de Ciencia, Tecnología e Innovación (Argentina), Ministério da Ciência, Tecnologia, Inovações e Comunicações (Brazil), and Korea Astronomy and Space Science Institute (Republic of Korea).
This project used public archival data from the Dark Energy Survey (DES). Funding for the DES Projects has been provided by the U.S. Department of Energy, the U.S. National Science Foundation, the Ministry of Science and Education of Spain, the Science and Technology Facilities Council of the United Kingdom, the Higher Education Funding Council for England, the National Center for Supercomputing Applications at the University of Illinois at Urbana–Champaign, the Kavli Institute of Cosmological Physics at the University of Chicago, the Center for Cosmology and Astro-Particle Physics at the Ohio State University, the Mitchell Institute for Fundamental Physics and Astronomy at Texas AM University, Financiadora de Estudos e Projetos, Fundação Carlos Chagas Filho de Amparo à Pesquisa do Estado do Rio de Janeiro, Conselho Nacional de Desenvolvimento Científico e Tecnológico and the Ministério da Ciência, Tecnologia e Inovação, the Deutsche Forschungsgemeinschaft and the Collaborating Institutions in the Dark Energy Survey.
The Collaborating Institutions are Argonne National Laboratory, the University of California at Santa Cruz, the University of Cambridge, Centro de Investigaciones Enérgeticas, Medioambientales y Tecnològicas–Madrid, the University of Chicago, University College London, the DES-Brazil Consortium, the University of Edinburgh, the Eidgenössische Technische Hochschule (ETH) Zürich, Fermi National Accelerator Laboratory, the University of Illinois at Urbana-Champaign, the Institut de Ciències de l’Espai (IEEC/CSIC), the Institut de Física d’Altes Energies, Lawrence Berkeley National Laboratory, the Ludwig-Maximilians Universität München and the associated Excellence Cluster Universe, the University of Michigan, the National Optical Astronomy Observatory, the University of Nottingham, The Ohio State University, the OzDES Membership Consortium, the University of Pennsylvania, the University of Portsmouth, SLAC National Accelerator Laboratory, Stanford University, the University of Sussex, and Texas AM University.
Based in part on observations at Cerro Tololo Inter-American Observatory, National Optical Astronomy Observatory, which is operated by the Association of Universities for Research in Astronomy (AURA) under a cooperative agreement with the National Science Foundation.
The Legacy Surveys consist of three individual and complementary projects: the Dark Energy Camera Legacy Survey (DECaLS; NSF’s OIR Lab Proposal ID No. 2014B-0404; PIs: David Schlegel and Arjun Dey), the Beijing-Arizona Sky Survey (BASS; NSF’s OIR Lab Proposal ID No. 2015A-0801; PIs: Zhou Xu and Xiaohui Fan), and the Mayall z-band Legacy Survey (MzLS; NSF’s OIR Lab Proposal ID No. 2016A-0453; PI: Arjun Dey). DECaLS, BASS and MzLS together include data obtained, respectively, at the Blanco telescope, Cerro Tololo Inter-American Observatory, The NSF’s National Optical-Infrared Astronomy Research Laboratory (NSF’s OIR Lab); the Bok telescope, Steward Observatory, University of Arizona; and the Mayall telescope, Kitt Peak National Observatory, NSF’s OIR Lab. The Legacy Surveys project is honored to be permitted to conduct astronomical research on Iolkam Du’ag (Kitt Peak), a mountain with particular significance to the Tohono O’odham Nation.
The NSF’s OIR Lab is operated by the Association of Universities for Research in Astronomy (AURA) under a cooperative agreement with the National Science Foundation.
This project used data obtained with the Dark Energy Camera (DECam), which was constructed by the Dark Energy Survey (DES) collaboration. Funding for the DES Projects has been provided by the U.S. Department of Energy, the U.S. National Science Foundation, the Ministry of Science and Education of Spain, the Science and Technology Facilities Council of the United Kingdom, the Higher Education Funding Council for England, the National Center for Supercomputing Applications at the University of Illinois at Urbana-Champaign, the Kavli Institute of Cosmological Physics at the University of Chicago, Center for Cosmology and Astro-Particle Physics at the Ohio State University, the Mitchell Institute for Fundamental Physics and Astronomy at Texas AM University, Financiadora de Estudos e Projetos, Fundacao Carlos Chagas Filho de Amparo, Financiadora de Estudos e Projetos, Fundacao Carlos Chagas Filho de Amparo a Pesquisa do Estado do Rio de Janeiro, Conselho Nacional de Desenvolvimento Cientifico e Tecnologico and the Ministerio da Ciencia, Tecnologia e Inovacao, the Deutsche Forschungsgemeinschaft and the Collaborating Institutions in the Dark Energy Survey. The Collaborating Institutions are Argonne National Laboratory, the University of California at Santa Cruz, the University of Cambridge, Centro de Investigaciones Energeticas, Medioambientales y Tecnologicas-Madrid, the University of Chicago, University College London, the DES-Brazil Consortium, the University of Edinburgh, the Eidgenossische Technische Hochschule (ETH) Zurich, Fermi National Accelerator Laboratory, the University of Illinois at Urbana-Champaign, the Institut de Ciencies de l’Espai (IEEC/CSIC), the Institut de Fisica d’Altes Energies, Lawrence Berkeley National Laboratory, the Ludwig-Maximilians Universitat Munchen and the associated Excellence Cluster Universe, the University of Michigan, the National Optical Astronomy Observatory, the University of Nottingham, the Ohio State University, the University of Pennsylvania, the University of Portsmouth, SLAC National Accelerator Laboratory, Stanford University, the University of Sussex, and Texas AM University.
BASS is a key project of the Telescope Access Program (TAP), which has been funded by the National Astronomical Observatories of China, the Chinese Academy of Sciences (the Strategic Priority Research Program ”The Emergence of Cosmological Structures” Grant No. XDB09000000), and the Special Fund for Astronomy from the Ministry of Finance. The BASS is also supported by the External Cooperation Program of Chinese Academy of Sciences (Grant No. 114A11KYSB20160057), and Chinese National Natural Science Foundation (Grant No. 11433005).
The Legacy Survey team makes use of data products from the Near-Earth Object Wide-field Infrared Survey Explorer (NEOWISE), which is a project of the Jet Propulsion Laboratory/California Institute of Technology. NEOWISE is funded by the National Aeronautics and Space Administration.
The Legacy Surveys imaging of the DESI footprint is supported by the Director, Office of Science, Office of High Energy Physics of the U.S. Department of Energy under Contract No. DE-AC02-05CH1123, by the National Energy Research Scientific Computing Center, a DOE Office of Science User Facility under the same contract; and by the U.S. National Science Foundation, Division of Astronomical Sciences under Contract No. AST-0950945 to NOAO.
References
- Abbott et al. (2017a) Abbott, B. P., Abbott, R., Abbott, T. D., et al. 2017a, Phys. Rev. Lett., 119, 161101
- Abbott et al. (2017b) —. 2017b, ApJ, 848, L12
- Abbott et al. (2020) Abbott, T. M. C., Aguena, M., Alarcon, A., et al. 2020, Phys. Rev. D, 102, 023509
- Barbary et al. (2012) Barbary, K., Aldering, G., Amanullah, R., et al. 2012, ApJ, 745, 32
- Becker (2015) Becker, A. 2015, HOTPANTS: High Order Transform of PSF ANd Template Subtraction, Astrophysics Source Code Library
- Behroozi et al. (2014) Behroozi, P. S., Ramirez-Ruiz, E., & Fryer, C. L. 2014, ApJ, 792, 123
- Belczynski et al. (2006) Belczynski, K., Perna, R., Bulik, T., et al. 2006, ApJ, 648, 1110
- Belczynski et al. (2018) Belczynski, K., Askar, A., Arca-Sedda, M., et al. 2018, A&A, 615, A91
- Bennett et al. (2014) Bennett, C. L., Larson, D., Weiland, J. L., & Hinshaw, G. 2014, ApJ, 794, 135
- Berger (2009) Berger, E. 2009, ApJ, 690, 231
- Berger (2010) —. 2010, ApJ, 722, 1946
- Berger (2014) Berger, E. 2014, Annual Review of Astronomy and Astrophysics, 52, 43–105
- Berger et al. (2007a) Berger, E., Shin, M. S., Mulchaey, J. S., & Jeltema, T. E. 2007a, ApJ, 660, 496
- Berger et al. (2005) Berger, E., Price, P. A., Cenko, S. B., et al. 2005, Nature, 438, 988
- Berger et al. (2007b) Berger, E., Fox, D. B., Price, P. A., et al. 2007b, ApJ, 664, 1000
- Blanchard et al. (2016) Blanchard, P. K., Berger, E., & Fong, W.-f. 2016, ApJ, 817, 144
- Blanchard et al. (2017) Blanchard, P. K., Berger, E., Fong, W., et al. 2017, The Astrophysical Journal, 848, L22
- Bloom et al. (2002) Bloom, J. S., Kulkarni, S. R., & Djorgovski, S. G. 2002, AJ, 123, 1111
- Bloom et al. (2006) Bloom, J. S., Prochaska, J. X., Pooley, D., et al. 2006, ApJ, 638, 354
- Bloom et al. (2007) Bloom, J. S., Perley, D. A., Chen, H. W., et al. 2007, ApJ, 654, 878
- Bruzual & Charlot (2003) Bruzual, G., & Charlot, S. 2003, MNRAS, 344, 1000
- Cardelli et al. (1989) Cardelli, J. A., Clayton, G. C., & Mathis, J. S. 1989, ApJ, 345, 245
- Chabrier (2003) Chabrier, G. 2003, PASP, 115, 763
- Chornock et al. (2017) Chornock, R., Berger, E., Kasen, D., et al. 2017, ApJ, 848, L19
- Collins et al. (2017) Collins, K. A., Kielkopf, J. F., Stassun, K. G., & Hessman, F. V. 2017, AJ, 153, 77
- Conroy (2013) Conroy, C. 2013, ARA&A, 51, 393
- Conroy & Gunn (2010) Conroy, C., & Gunn, J. E. 2010, ApJ, 712, 833
- Conroy et al. (2009) Conroy, C., Gunn, J. E., & White, M. 2009, ApJ, 699, 486
- Dark Energy Survey Collaboration et al. (2016) Dark Energy Survey Collaboration, Abbott, T., Abdalla, F. B., et al. 2016, MNRAS, 460, 1270
- Davidson-Pilon et al. (2020) Davidson-Pilon, C., Kalderstam, J., Jacobson, N., et al. 2020, CamDavidsonPilon/lifelines: v0.24.16
- De Pasquale (2019) De Pasquale, M. 2019, Galaxies, 7, 30
- DeMaio et al. (2015) DeMaio, T., Gonzalez, A. H., Zabludoff, A., Zaritsky, D., & Bradač, M. 2015, MNRAS, 448, 1162
- DeMaio et al. (2018) DeMaio, T., Gonzalez, A. H., Zabludoff, A., et al. 2018, MNRAS, 474, 3009
- DESI Collaboration et al. (2016) DESI Collaboration, Aghamousa, A., Aguilar, J., et al. 2016, arXiv e-prints, arXiv:1611.00036
- Dey et al. (2019) Dey, A., Schlegel, D. J., Lang, D., et al. 2019, AJ, 157, 168
- Doi et al. (2010) Doi, M., Tanaka, M., Fukugita, M., et al. 2010, AJ, 139, 1628
- Dressel (2012) Dressel, L. 2012, Wide Field Camera 3 Instrument Handbook for Cycle 21 v. 5.0
- Dressler (1980) Dressler, A. 1980, ApJ, 236, 351
- Drlica-Wagner et al. (2018) Drlica-Wagner, A., Sevilla-Noarbe, I., Rykoff, E. S., et al. 2018, ApJS, 235, 33
- Drout et al. (2017) Drout, M. R., Piro, A. L., Shappee, B. J., et al. 2017, Science, 358, 1570
- Eichler et al. (1989) Eichler, D., Livio, M., Piran, T., & Schramm, D. N. 1989, Nature, 340, 126
- Eke et al. (2005) Eke, V. R., Baugh, C. M., Cole, S., et al. 2005, MNRAS, 362, 1233
- Evans et al. (2007) Evans, P. A., Beardmore, A. P., Page, K. L., et al. 2007, A&A, 469, 379
- Evans et al. (2009) —. 2009, MNRAS, 397, 1177
- Ferrero et al. (2007) Ferrero, P., Sanchez, S. F., Kann, D. A., et al. 2007, AJ, 134, 2118
- Flaugher et al. (2015) Flaugher, B., Diehl, H. T., Honscheid, K., et al. 2015, AJ, 150, 150
- Fong & Berger (2013) Fong, W., & Berger, E. 2013, ApJ, 776, 18
- Fong et al. (2010) Fong, W., Berger, E., & Fox, D. B. 2010, ApJ, 708, 9
- Fong & Chornock (2016) Fong, W., & Chornock, R. 2016, GRB Coordinates Network, 20168, 1
- Fong et al. (2011) Fong, W., Berger, E., Chornock, R., et al. 2011, ApJ, 730, 26
- Fong et al. (2013) —. 2013, ApJ, 769, 56
- Fong et al. (2016) Fong, W., Margutti, R., Chornock, R., et al. 2016, ApJ, 833, 151
- Fong et al. (2019) Fong, W., Blanchard, P. K., Alexander, K. D., et al. 2019, ApJ, 883, L1
- Forman & Jones (1982) Forman, W., & Jones, C. 1982, ARA&A, 20, 547
- Friedmann & Maoz (2018) Friedmann, M., & Maoz, D. 2018, MNRAS, 479, 3563
- Frohmaier et al. (2018) Frohmaier, C., Sullivan, M., Maguire, K., & Nugent, P. 2018, ApJ, 858, 50
- Fukugita et al. (1998) Fukugita, M., Hogan, C. J., & Peebles, P. J. E. 1998, ApJ, 503, 518
- Gallagher & Ostriker (1972) Gallagher, John S., I., & Ostriker, J. P. 1972, AJ, 77, 288
- Gehrels et al. (2004) Gehrels, N., Chincarini, G., Giommi, P., et al. 2004, ApJ, 611, 1005
- Gehrels et al. (2006) Gehrels, N., Norris, J. P., Barthelmy, S. D., et al. 2006, Nature, 444, 1044
- Ghirlanda et al. (2006) Ghirlanda, G., Magliocchetti, M., Ghisellini, G., & Guzzo, L. 2006, MNRAS, 368, L20
- Goriely et al. (2011) Goriely, S., Bauswein, A., & Janka, H.-T. 2011, ApJ, 738, L32
- Gorosabel et al. (2006) Gorosabel, J., Castro-Tirado, A. J., Guziy, S., et al. 2006, A&A, 450, 87
- Gregg & West (1998) Gregg, M. D., & West, M. J. 1998, Nature, 396, 549
- Grindlay et al. (2006) Grindlay, J., Portegies Zwart, S., & McMillan, S. 2006, Nature Physics, 2, 116
- Guelbenzu et al. (2016) Guelbenzu, A. N., Schmidl, S., & Greiner, J. 2016, GRB Coordinates Network, 20132, 1
- Hennig et al. (2017) Hennig, C., Mohr, J. J., Zenteno, A., et al. 2017, MNRAS, 467, 4015
- Hinshaw et al. (2013) Hinshaw, G., Larson, D., Komatsu, E., et al. 2013, ApJS, 208, 19
- Hoyle et al. (2018) Hoyle, B., Gruen, D., Bernstein, G. M., et al. 2018, Monthly Notices of the Royal Astronomical Society, 478, 592
- Ivezić et al. (2019) Ivezić, Ž., Kahn, S. M., Tyson, J. A., et al. 2019, ApJ, 873, 111
- Kasen et al. (2017) Kasen, D., Metzger, B., Barnes, J., Quataert, E., & Ramirez-Ruiz, E. 2017, Nature, 551, 80
- Kennicutt (1998) Kennicutt, Jr., R. C. 1998, ARA&A, 36, 189
- Korobkin et al. (2012) Korobkin, O., Rosswog, S., Arcones, A., & Winteler, C. 2012, MNRAS, 426, 1940
- Kourkchi & Tully (2017) Kourkchi, E., & Tully, R. B. 2017, The Astrophysical Journal, 843, 16
- Laganá & Ulmer (2018) Laganá, T. F., & Ulmer, M. P. 2018, MNRAS, 475, 523
- Lamb et al. (2019) Lamb, G. P., Tanvir, N. R., Levan, A. J., et al. 2019, ApJ, 883, 48
- Lang et al. (2010) Lang, D., Hogg, D. W., Mierle, K., Blanton, M., & Roweis, S. 2010, The Astronomical Journal, 139, 1782–1800
- Lara-López et al. (2010) Lara-López, M. A., Cepa, J., Bongiovanni, A., et al. 2010, A&A, 521, L53
- Laskar et al. (2011) Laskar, T., Berger, E., & Chary, R.-R. 2011, ApJ, 739, 1
- Leibler & Berger (2010) Leibler, C. N., & Berger, E. 2010, ApJ, 725, 1202
- Leja et al. (2017) Leja, J., Johnson, B. D., Conroy, C., Dokkum, P. G. v., & Byler, N. 2017, The Astrophysical Journal, 837, 170
- Leja et al. (2013) Leja, J., van Dokkum, P. G., Momcheva, I., et al. 2013, ApJ, 778, L24
- Leja et al. (2019) Leja, J., Johnson, B. D., Conroy, C., et al. 2019, ApJ, 877, 140
- Lien et al. (2016a) Lien, A., Sakamoto, T., Barthelmy, S. D., et al. 2016a, ApJ, 829, 7
- Lien et al. (2016b) Lien, A. Y., Barthelmy, S. D., Cummings, J. R., et al. 2016b, GRB Coordinates Network, 20129, 1
- Lunnan et al. (2017) Lunnan, R., Kasliwal, M. M., Cao, Y., et al. 2017, ApJ, 836, 60
- Mannucci et al. (2008) Mannucci, F., Maoz, D., Sharon, K., et al. 2008, MNRAS, 383, 1121
- Maoz et al. (2014) Maoz, D., Mannucci, F., & Nelemans, G. 2014, ARA&A, 52, 107
- Marani et al. (1997) Marani, G. F., Nemiroff, J., Norris, J. P., & Bonnell, T. 1997, ApJ, 474, 576
- Margutti et al. (2016) Margutti, R., Berger, E., & Fong, W. 2016, GRB Coordinates Network, 20166, 1
- Metzger (2019) Metzger, B. D. 2019, Living Reviews in Relativity, 23, 1
- Mingo et al. (2016) Mingo, B., Beardmore, A. P., Burrows, D. N., et al. 2016, GRB Coordinates Network, 20123, 1
- Mulchaey et al. (2014) Mulchaey, J. S., Kasliwal, M. M., & Kollmeier, J. A. 2014, ApJ, 780, L34
- Nakar et al. (2006) Nakar, E., Gal-Yam, A., & Fox, D. B. 2006, ApJ, 650, 281
- Page et al. (2006) Page, K. L., King, A. R., Levan, A. J., et al. 2006, ApJ, 637, L13
- Palmese et al. (2017) Palmese, A., Hartley, W., Tarsitano, F., et al. 2017, ApJ, 849, L34
- Palmese et al. (2020) Palmese, A., Annis, J., Burgad, J., et al. 2020, MNRAS, 493, 4591
- Paterson et al. (2020) Paterson, K., Fong, W., Nugent, A., et al. 2020, ApJ, 898, L32
- Peng et al. (2010) Peng, Y.-j., Lilly, S. J., Kovač, K., et al. 2010, ApJ, 721, 193
- Perets et al. (2010) Perets, H. B., Gal-Yam, A., Mazzali, P. A., et al. 2010, Nature, 465, 322
- Persson et al. (2013) Persson, S. E., Murphy, D. C., Smee, S., et al. 2013, PASP, 125, 654
- Pian et al. (2017) Pian, E., D’Avanzo, P., Benetti, S., et al. 2017, Nature, 551, 67
- Prochaska et al. (2006) Prochaska, J. X., Bloom, J. S., Chen, H. W., et al. 2006, ApJ, 642, 989
- Rosswog (2005) Rosswog, S. 2005, ApJ, 634, 1202
- Rowlinson et al. (2010) Rowlinson, A., O’Brien, P. T., Tanvir, N. R., et al. 2010, MNRAS, 409, 531
- Rykoff et al. (2014) Rykoff, E. S., Rozo, E., Busha, M. T., et al. 2014, ApJ, 785, 104
- Rykoff et al. (2016) Rykoff, E. S., Rozo, E., Hollowood, D., et al. 2016, ApJS, 224, 1
- Sand et al. (2008) Sand, D. J., Zaritsky, D., Herbert-Fort, S., Sivanandam, S., & Clowe, D. 2008, AJ, 135, 1917
- Sarazin (1986) Sarazin, C. L. 1986, Reviews of Modern Physics, 58, 1
- Savaglio et al. (2005) Savaglio, S., Glazebrook, K., Le Borgne, D., et al. 2005, ApJ, 635, 260
- Schlafly & Finkbeiner (2011) Schlafly, E. F., & Finkbeiner, D. P. 2011, ApJ, 737, 103
- Schroeder et al. (2020) Schroeder, G., Margalit, B., Fong, W.-f., et al. 2020, ApJ, 902, 82
- Sevilla-Noarbe et al. (2018) Sevilla-Noarbe, I., Hoyle, B., Marchã, M. J., et al. 2018, MNRAS, 481, 5451
- Sharon et al. (2010) Sharon, K., Gal-Yam, A., Maoz, D., et al. 2010, ApJ, 718, 876
- Shen et al. (2019) Shen, K. J., Quataert, E., & Pakmor, R. 2019, ApJ, 887, 180
- Skrutskie et al. (2006) Skrutskie, M. F., Cutri, R. M., Stiening, R., et al. 2006, AJ, 131, 1163
- Speagle (2020) Speagle, J. S. 2020, MNRAS, 493, 3132
- Tamburri et al. (2014) Tamburri, S., Saracco, P., Longhetti, M., et al. 2014, A&A, 570, A102
- Tanvir et al. (2005) Tanvir, N. R., Chapman, R., Levan, A. J., & Priddey, R. S. 2005, Nature, 438, 991
- The Dark Energy Survey Collaboration (2005) The Dark Energy Survey Collaboration. 2005, preprint (arXiv:astro-ph/0510346)
- Tody (1986) Tody, D. 1986, in Society of Photo-Optical Instrumentation Engineers (SPIE) Conference Series, Vol. 627, Proc. SPIE, ed. D. L. Crawford, 733
- Tody (1993) Tody, D. 1993, in Astronomical Society of the Pacific Conference Series, Vol. 52, Astronomical Data Analysis Software and Systems II, ed. R. J. Hanisch, R. J. V. Brissenden, & J. Barnes, 173
- Troja et al. (2016) Troja, E., Watson, A., Covino, S., et al. 2016, GRB Coordinates Network, 20137, 1
- Weisskopf et al. (2000) Weisskopf, M. C., Tananbaum, H. D., Van Speybroeck, L. P., & O’Dell, S. L. 2000, Society of Photo-Optical Instrumentation Engineers (SPIE) Conference Series, Vol. 4012, Chandra X-ray Observatory (CXO): overview, ed. J. E. Truemper & B. Aschenbach, 2–16
- Whitmore et al. (1993) Whitmore, B. C., Gilmore, D. M., & Jones, C. 1993, ApJ, 407, 489
- Wright (2006) Wright, E. L. 2006, PASP, 118, 1711
- Wright et al. (2010) Wright, E. L., Eisenhardt, P. R. M., Mainzer, A. K., et al. 2010, AJ, 140, 1868
- Ye et al. (2020) Ye, C. S., Fong, W.-f., Kremer, K., et al. 2020, ApJ, 888, L10
- Zevin et al. (2019) Zevin, M., Kelley, L. Z., Nugent, A., et al. 2019, arXiv e-prints, arXiv:1910.03598
- Zhang et al. (2019) Zhang, Y., Yanny, B., Palmese, A., et al. 2019, ApJ, 874, 165
- Zheng & Ramirez-Ruiz (2007) Zheng, Z., & Ramirez-Ruiz, E. 2007, ApJ, 665, 1220
- Zhou et al. (2020) Zhou, R., Newman, J. A., Mao, Y.-Y., et al. 2020, The Clustering of DESI-like Luminous Red Galaxies Using Photometric Redshifts