Failure processes of cemented granular materialsPreprint: APS/123-QED
Abstract
The mechanics of cohesive or cemented granular materials is complex, combining the heterogeneous responses of granular media, like force chains, with clearly defined material properties. Here, we use a discrete element model (DEM) simulation, consisting of an assemblage of elastic particles connected by softer but breakable elastic bonds, to explore how this class of material deforms and fails under uniaxial compression. We are particularly interested in the connection between the microscopic interactions among the grains or particles and the macroscopic material response. To this end, the properties of the particles and the stiffness of the bonds are matched to experimental measurements of a cohesive granular media with tunable elasticity. The criterion for breaking a bond is also based on an explicit Griffith energy balance, with realistic surface energies. By varying the initial volume fraction of the particle assembles we show that this simple model reproduces a wide range of experimental behaviors, both in the elastic limit and beyond it. These include quantitative details of the distinct failure modes of shear-banding, ductile failure and compaction banding or anti-cracks, as well as the transitions between these modes. The present work, therefore, provides a unified framework for understanding the failure of porous materials such as sandstone, marble, powder aggregates, snow and foam.
I INTRODUCTION
A wide variety of materials are made up of individual grains that are held together by a matrix material. Examples include both naturally occurring materials such as mortars, asphalts, volcanic ashes and snow (see e.g., Jiang et al. 2013 and references therein) as well as artificially generated materials such as cemented solids and sintered glass or alumina beads Hemmerle et al. 2016; Schmeink et al. 2017; Wang et al. 2019. Consequently, the failure of porous materials is also known from many contexts. In geological situations, landslides, snow avalanches, and earthquakes are representative examples. The failure of industrial materials such as foams or ceramics and building materials including sandstone, concrete and marble are widely studied in the materials sciences Lawn 1993. Given a fixed sample size, the observed modes of failure processes of cohesive granular materials are determined by two basic competing ingredients: stress localization due to damage and scatter of damage due to disorder. When we regard the porosity of the media as a measure of disorder in the system, a transition from brittle to ductile deformation is expected Wong and Baud 2012 with increasing porosity i.e., decreasing packing fraction of the grains in the material. Further increases in porosity can lead to another localized mode of failure such as an anti-crack, which can be defined as a fracture mode with the displacement field of a mode-I crack, but opposite in sign (i.e. compression or closure rather than an opening displacement) Fletcher and Pollard 1981; Sternlof et al. 2005; Heierli et al. 2008.
Here, we perform discrete element model (DEM) simulations on a model cohesive granular media, designed around the measured inputs from a particularly well-characterized experimental system Hemmerle et al. 2016; Schmeink et al. 2017. The quantitative verification of our model is done by comparison with experiments in terms of the stress-strain relationship. We find that the system density plays an essential role in the transitions between three distinct failure modes: brittle failure, ductile failure, and compaction banding or anti-cracks. While each of these modes is well-known in different contexts, we show how they can all be captured in a single model framework, and one in which every parameter is constrained by direct experimental measurement. Specifically, we show how transitions between these modes of fracture can be observed through a variation of the system density or packing fraction.
In laboratory experiments, the brittle failure of rocks has been studied for predicting the timing of material failure. The nature of the microcrack events, typically detected as acoustic signals in experiments, is one indicator used to predict the failure timing and this method was developed through many laboratory experiments Lockner et al. 1991; Sammonds et al. 1992; Olsson and Holcomb 2000; Zang et al. 2000; Baud et al. 2004; Fortin et al. 2006; Townend et al. 2008. The interplay between the stress localization due to damage and the diffused damage due to disorder in the system can be observed by tracking the spatial locations of the acoustic signals. One can observe that the apparently randomly distributed micro-cracks progressively localize to form a system-spanning crack leading to catastrophic breakdown. Experimental studies Renard et al. 2009; Renard et al. 2018 have also used X-rays to measure more details of brittle faulting of rocks. Similarly, a conductivity-based method was recently used to detect microcracks in sandstone under strong temperature variations rather than direct mechanical loading Ilin et al. 2020. In general, the statistical properties of the microcrack events, for a range of porosities and materials, have been studied experimentally (see e.g. Castillo-Villa et al. 2013; Salje et al. 2013) and also numerically using discrete element model (DEM) simulations Kun et al. 2014; Pál et al. 2016.
The plastic deformation mode of failure is commonly observed in metallic materials but is also seen in rocks under particular conditions such as high confining pressures Karman 1911; Paterson 1958 or high temperature Heard 1960. Lowering strain rate and relatively higher porosity play a role in reducing the transition pressure Karman 1911; Handin and Hager Jr. 1957; Handin et al. 1963; Robinson 1959, although this porosity dependence has only been observed in highly porous media such as sandstones and similar rocks. However, the brittle-ductile transition and strain-rate hardening due to interaction and sizes of shear bands are also observed in micrometer scale metals Tönnies et al. 2014; Volkert and Lilleodden 2006.
In a different context, pure compressional deformation bands, which develop in a transverse direction to the confining axis, have been reported in geological field studies Hill 1989; Mollema and Antonellini 1996. Along these lines, earlier work has been done including theoretically modeling such modes Olsson 1999; Issen and Rudnicki 2000, laboratory experiments Olsson 1999; Olsson and Holcomb 2000; Wong et al. 2001; Baud et al. 2004; Fortin et al. 2006; Baud et al. 2012, field studies Eichhubl et al. 2010; Schultz et al. 2010; Fossen et al. 2011, and simulations Katsman et al. 2005; Marketos and Bolton 2009. These compressional bands are called compaction bands or anti-cracks and can also be observed in highly porous materials like foams Reis et al. 2009 and snows Kinosita 1967; Barraclough et al. 2017. We note that this compaction band preferentially develops in low-density systems. After their formations, such bands can work as a barrier to movement or flow, and contribute to the directivity of permeability in sandstone aquifers Baud et al. 2012; Sternlof et al. 2006, for example. The growth and extension of compaction bands are regarded as anti-crack formation and can be represented by the Eshelby inclusion model Sternlof et al. 2005.
Recently, cohesive or cemented granular materials with tunable material properties have been created artificially and the elastic properties of these materials are studied in laboratory experiments which directly motivate our model Hemmerle et al. 2016; Schmeink et al. 2017. The cohesive granular media were made from glass beads held together by small amounts of a curable polymer (PDMS). When added as a liquid, the polymer settles into pendular or capillary bridges between nearby particles, which solidify into rigid bonds between the particles after heating. The stiffness of the bonds is much smaller than that of the beads (see Table 1), similar to the situation also investigated in Ref. Wang et al. 2019. Microscopic experiments were performed to investigate the elastic properties of a single bond which connects two glass beads. From such microscopic experiments, the effective spring constants of the polymer bonds are extracted. Based on these information, one can model a cohesive granular media through a DEM Cundall and Strack 1979 simulation and reproduce the macroscopic experimental results primarily in the elastic regime, including the effects of bond stiffness Hemmerle et al..
In this work, we propose a model that captures the initial elastic and eventual yielding processes in cohesive granular media, for a range of packing fractions, in a systematic way, bridging the similar experimental observations performed for specific ranges of packing fractions. The model is simplified in some aspects (see sec. II) to reduce the number of parameters required to describe it. But, the parameters that are present in the model are fully constrained by the inputs from the laboratory experiments (see Table 1). Despite its simplicity, we find that the model can reproduce a wide range of experimental and observational behavior of real materials, including sandstone Olsson and Holcomb 2000; Baud et al. 2004; Townend et al. 2008, snow Barraclough et al. 2017 and foam Reis et al. 2009, in addition to the exemplar material Hemmerle et al. 2016; Schmeink et al. 2017 that it is modeled after. In particular, power law scalings of the elastic modulus and the yield stresses with the effective bond density are shown in this model for a range of packing fractions. Beyond the yield point, the different modes by which a cohesive granular system fails are also seen in the model. For example, our model is able to reproduce the failure modes of cohesive granular media with the variation of the packing fraction–starting from a shear band formation at higher densities, through a ductile failure in the intermediate densities, to a compaction failure at low densities (high porosity). These modes agree with the corresponding experimental observations. For example, in the case of sandstone, compaction band features are known to form preferentially in more porous rock, specifically where the porosity is above about 20% Mollema and Antonellini 1996; Olsson and Holcomb 2000; Townend et al. 2008. Similarly, our model can reproduce an observed transition towards shear-band formation Baud et al. 2006 when the system becomes dense enough to be dilatant. This indicates that the model captures the essential physics of the modes of deformation of cohesive granular media. Conversely, it shows how these very different modes of failure can occur in what are otherwise similar materials, in response to relatively small changes in their composition.
These results show that our model, constituted with the microscopic parameter inputs from experiments, reproduces experimentally observed failure and pre-failure responses for a range of packing fractions i.e., from shear banding to ductile failure to anti-cracks. It also reveals the statistical variations in localizations of microcracks and their quantification. The model, therefore, opens up the possibilities for investigations in various parameter ranges and making quantitative predictions that are hard to probe otherwise.
II METHODS

Our model is motivated by experimental studies of cohesive granular media. In particular, we focus on a single experimental system that has been particularly well-characterized Hemmerle et al. 2016; Schmeink et al. 2017; Hemmerle et al.. We assume that the macroscopic properties of these materials can be described by the constitutive laws governing the microscopic deformations of individual particles and the fragile cohesive bonds, or bridges, that link them. Therefore, we have designed DEM simulations where the various elastic responses of the components (e.g. spring constants) are constrained by the measurements of micro-mechanical experiments involving two glass beads connected by an isolated polymer bridge Hemmerle et al.. Although we focus on information from one particular set of experiments (see Table 1), this modeling method can be extended to any similar cohesive granular material by suitably choosing these material constants.
| property | symbol | value | scaled value | ref. |
|---|---|---|---|---|
| sample diameter | Hemmerle et al. 2016 | |||
| sample height | – | |||
| bond diameter | Schmeink et al. 2017 | |||
| bond stiffness, norm. | Schmeink et al. 2017 | |||
| bond stiffness, tang. | Schmeink et al. 2017 | |||
| friction coefficient | Penskiy et al. 2011 | |||
| bead diameter | Hemmerle et al. 2016 | |||
| bead mass | Hemmerle et al. 2016 | |||
| bead stiffness, norm. | Hemmerle et al. | |||
| bead stiffness, tang. | Hemmerle et al. | |||
| interfacial energy | Schmeink et al. 2017; Chopin et al. 2011 |
To simplify the simulation parameters, we also non-dimensionalize our model using this particular set of experimental parameters Hemmerle et al. 2016; Schmeink et al. 2017; Hemmerle et al.. Specifically, we scale the system such that the average mass () and diameter () of the particles, along with the spring constant for normal glass-glass contact () take on unit values. For this we use an average particle diameter of and an average particle mass of . Other units are scaled accordingly, for example velocities are scaled by . A list of the scaled simulation parameters is included in Table 1. The is set ten times higher than the normal spring constant of a polymer bridge, where the latter is estimated as Hemmerle et al.. This ratio is low enough to prevent numerical instabilities, yet high enough to capture the difference of stiffness between the glass beads and their softer bonds. We confirmed this by performing several simulations in which this stiffness ratio was 20, 50 or 100, and in which we did not see any significant change in terms of stress-strain curves.
II.1 DEM: equations of motion
We consider the dynamics of a collection of spherical particles that can interact with each other through contact forces and cohesive bonds. The equations of motion are adapted from studies of granular media, in particular Ref. Luding 2008. The particles are indexed such that particle has diameter , mass , center position , angular velocity and moment of inertia . The equations of motion of any individual particle involve the translational and rotational degrees of freedom, and are described as
| (1) | ||||
| (2) |
The right hand sides of these equations give the inter-particle forces and torques felt between particle and all other particles. For an interaction between particles and the force components and are defined, respectively, as the projections of the total inter-particle force onto the line connecting the centers of the two particles (i.e. with normal unit vector ), and the plane normal to that line.
We account for the forces due to the contact of adjacent beads pressing on each other, as well as those arising from the distortion of cohesive bonds. For both contributions we use a linear elastic response, where the stiffness of the particles is assumed to be much higher than that of the bonds, and include dissipation during particle contact. The interactions depend on the surface separation of the particles, , which is negative when particles overlap.
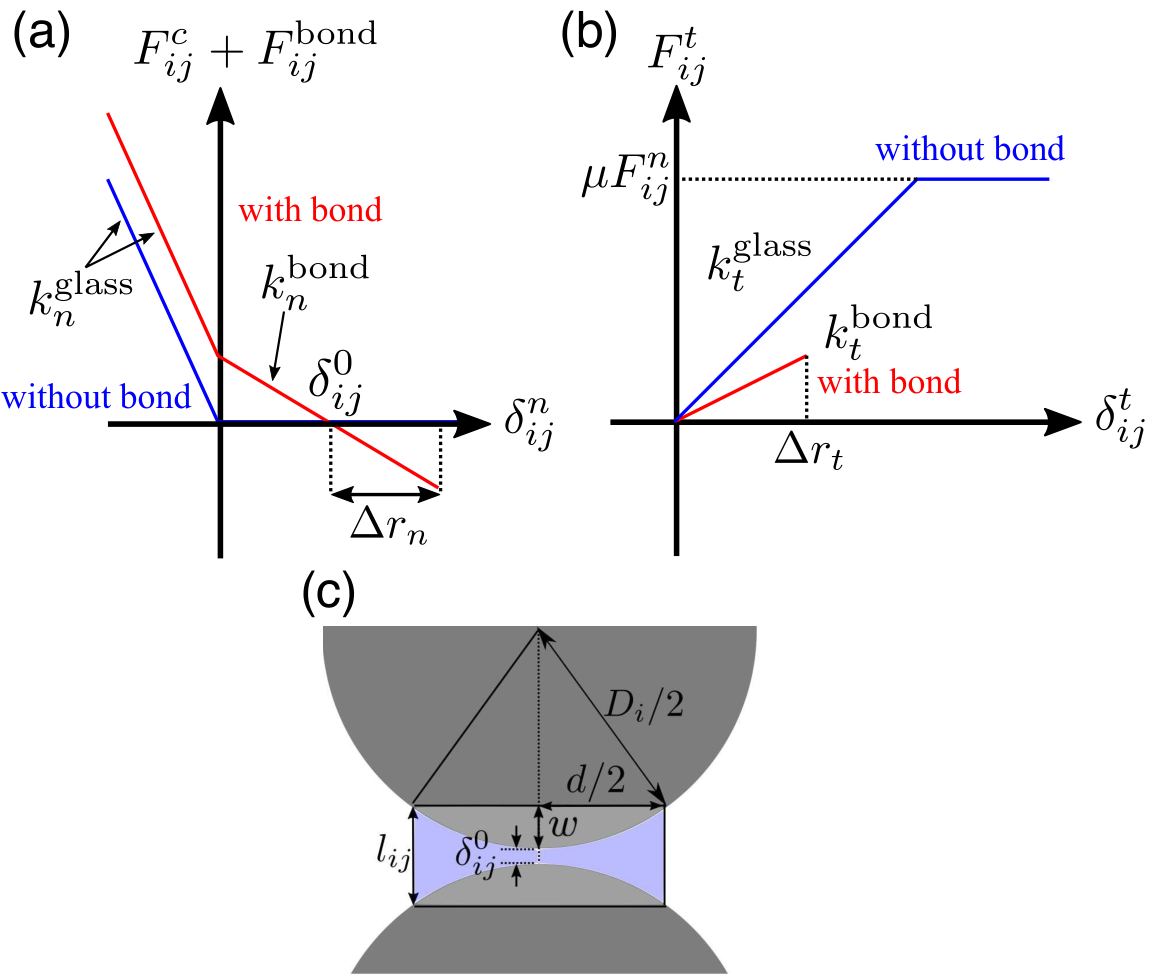
The normal component of the interaction has three possible contributions: a repulsive contact force, an elastic restoring force from any cohesive bond and a dissipation force. As sketched in Fig. 2(a), this is summarized as
| (3) |
The conservative aspects are given by
| (4) |
Here, the cohesive bond is modeled as a spring of normal stiffness and an equilibrium length equal to the initial particle separation, . Its effect is only considered if there is an intact bond linking the particles; otherwise we set . Particle overlap is also treated as a spring, but of stiffness . Additionally, overlap causes dissipation, which is modeled as
| (5) |
where is a dissipation rate. This ensures that collisions are inelastic. The dissipation depends on the relative velocity at the contact point, which is computed as
| (6) |
Note that here, for simplicity, we ignore the effects of any small overlap when computing velocities (i.e. in Eq. 6, we consider rather than ). As with forces, we project onto the normal direction connecting the centers of the interacting particles, , and onto the plane orthogonal to this line, .
Finally, we treat the tangential component of the inter-particle forces, as shown in Fig. 2(b). If two particles are linked by a cohesive bond, and as long as they are not also physically overlapping, then there is a damped, elastic restoring force acting to return them to their original configuration,
| (7) |
In this case is the relative tangential displacement away from the initial contact point, and is measured by integrating over time. If two particles are overlapping then there is instead a restoring force
| (8) |
This force is limited by Coulomb friction to have a maximum magnitude of , for friction coefficient . Here, is the tangential displacement measured relative to the point of first contact between the particles.
II.2 Model setup
Particles and the cohesive bonds between them determine our system properties. Here, we describe how we set up their initial configurations (see Table 2) and boundary conditions. We first consider a cubic region with periodic boundaries in the horizontal directions and rigid walls at the upper and lower boundaries. This box is seeded with particles at random positions, with the number of particles ultimately determining the packing fraction . The particles are initially point-like but the particle diameters are slowly increased, and their positions updated to avoid overlaps, following the methods detailed in Refs. Clarke and Wiley 1987; Clarke and Jónsson 1993. During this process we maintain a small polydispersity in particle diameters. Specifically, the particle diameter distribution is a Gaussian with a standard deviation of . We use the Box-Muller method Box 1958 to reproduce the polydispersity.
Once a final packing has been made we identify the particles that are entirely within a cylinder of radius and height , and remove all outliers. We then add a cohesive bond between any two particles if their initial surface separation, , is below . This range gives us the same density of bonds as was observed in our motivating experiments–specifically, particles form bonds to neighbors, on average, for a packing fraction Schmeink et al. 2017. The typical numbers of particles modeled, the coordination numbers of their packings and how these depend on are given in Table 2.
During deformation we adopt clamped boundary conditions (See Fig. 1(a)). For this, all particles within of either the top or bottom edges of the cylinder are constrained: they are only allowed to move vertically and their lateral displacement is prohibited. The position of the top boundary is then fixed and the bottom one moves upwards at a constant velocity of , corresponding to . This is expected to be slow enough to match with quasi-static experiments, as we confirmed that results are reproducible with a slower velocity of . At the upper boundary the loading force, , is calculated by summing the vertical components of all the forces applied on the boundary particles from the bulk of the sample. The normal stress of the system is then
| (9) |
Similarly, the normal strain of the system, follows from the displacement of the lower boundary.
In every time step, the model records the positions of the beads and the configuration of the bonds and forces between them. The number of bonds associated with each bead gives its coordination number , with an average value that will tend to decrease over time as damage accumulates by processes which we now describe.
II.3 Breaking cohesive bonds
A system of particle assemblies with inter-particle bonds or beams requires some criterion for bond breakages. In some previous work this has been based on a von-Mises criterion for yielding Kun et al. 2014; Pál et al. 2016 or the Tresca failure criterion for maximum shear stress Brendel et al. 2011. Here, our model for breaking cohesive bonds is based on energetic considerations and is designed around the Griffith criteria for fracture. In our motivating experiments, failure happens by bonds detaching or peeling away from particles Schmeink et al. 2017. Hence, we allow a bond to break when the internal elastic energy stored in its deformation exceeds the peeling energy.
The energy needed to peel a cohesive bond off a particle is proportional to the bond’s surface area,
| (10) |
where is the interfacial energy (i.e. the critical strain energy release rate) of the bond. For this we use , as measured for peeling PDMS from glass Chopin et al. 2011. This value is consistent with the fracture toughness of our experimental cohesive granular materials Schmeink et al. 2017.
The strain energy stored in a bond of volume under a normal uniaxial strain is modeled as
| (11) |
For this, we regard a cohesive bond as a pillar of height (see Fig. 2(c)) and volume , and take the normal displacement of the bond to be . Likewise, the contribution to the strain energy from any tangential displacement is given by
| (12) |
where is the shear modulus of the bond material. As befits a polymer bond, we use a Poisson ratio , such that .
A comparison between the surface energy (Eq. (10)) and the strain energy (sum of Eqs. (11) and (12)) now gives us the failure condition
| (13) |
Whenever any bond exceeds this criterion, it is removed from the simulation. Throughout a numerical experiment we track the locations of the bonds as they break. These correspond to microcracks or similarly localized damage, events which can be recorded as acoustic signals in laboratory experiments.

III Results and discussion
We will now explore how the failure of the cohesive granular material under compression is affected by its initial packing fraction, focusing on simulations between and . In a related study incorporating experimental findings Hemmerle et al., we also describe how changing bond stiffness affects the elastic response of this type of material. The presentation and discussion of results will progress from the elastic response of the system at low strains, through to the statistical features of the micro-crack assembly as yielding begins, and finally to the modes of failure seen at different .
An overview of our results is given in Fig. 3, which demonstrates how samples at different packing fractions deform and fail. At very high densities of particles, samples develop shear bands, such as the example in Fig. 3(a). At an intermediate value of , as in Fig. 3(b), this mode of compressional failure is suppressed, and the sample deforms plastically, showing barreling or swelling around the mid-plane of the sample. Finally, and representative of low- behavior, Fig. 3(c) shows how a cylinder compresses almost perfectly uniaxially, until failure localizes along a horizontal plane and an anti-crack Reis et al. 2009, or compression failure event Baud et al. 2004; Townend et al. 2008, passes from right to left across lower part of the sample. In the following we will discuss these results in more detail, starting with an investigation of the initial elastic regime of this type of material.
III.1 The elastic regime
The bulk response of our model of cohesive granular material to compression is shown in Fig. 4(a), which gives the stress-strain relationships of the uniaxial compression of samples of different initial packing fractions. For small strains, i.e. before the system experiences any significant yielding, the material behaves as an elastic solid. By fitting the slope of this response, leading up to the peak stress, we measured the Young’s modulus, of each sample. For our highest packing fraction of the shape of the stress-strain curve closely matches that of the corresponding experiments Hemmerle et al. 2016, from which we took our model parameters, although is larger than what was measured there. Part of this difference is due to a simplification of the model, which assigns all cohesive bridges the same spring constant, regardless of their initial length. The model’s clamped boundary conditions also contribute to its stiffness, as compared to the experiment. We tested this by repeating a simulation run without the clamped conditions, and using a shorter cylinder whose dimensions matched the test sample geometry used in Hemmerle et al. Hemmerle et al. 2016. Under these conditions we found MPa, compared to the experimental value of MPa Hemmerle et al. 2016. The agreement between experiment and simulation is made increasingly clear if we used the exact particle positions as measured by in the X-ray tomography experiments reported in Hemmerle et al. 2016, while also maintaining the average coordination number measured in those tests Schmeink et al. 2017; the corresponding stress-strain curves are shown in Fig. 4(b). Further quantitative comparisons with experiments are also possible within the elastic regime, starting from the pairwise responses of the beads at the microscopic level, which we intend to explore elsewhere Hemmerle et al..
Systems with a higher density of particles, and hence a higher coordination number and more bonds, are stiffer than those with a lower . As shown in Fig. 4(c), the Young’s modulus increases smoothly with , which describes the density of inter-particle contacts before the system deforms. This dependency is well-fit by a power law, , with exponent . As we discuss below, this scaling is generally in line with the expected behavior of aggregated systems.
The stiffness of granular materials, especially those with some form of adhesion or cohesion, is known to depend strongly on the packing fraction and structure of its particles (e.g. Kendall et al. 1987; Kendall and Stainton 2001; Shih et al. 1990; Mewis and Wagner 2012; Gaume et al. 2017). The effective-medium theory of a frictional but cohesionless granular media would suggest a linear scaling of with Walton 1987. However, by independently varying and for sticky hard spheres, Gaume et al. Gaume et al. 2017 showed a data collapse for , with a power law like ours but with an exponent of . Similar results have been reported in 2D simulations of cohesive particles Gilabert et al. 2008; Roy and Tirumkudulu 2016, with stiffnesses again increasing much faster with than would be naively be predicted by effective-medium theory. This high sensitivity of the bulk stiffness to contact density has been attributed to the presence of force chains, which will generate a backbone, or network, for force conduction with a correlation length that can be decoupled from the actual particle size or system size Gilabert et al. 2008; Gaume et al. 2017; Roy and Tirumkudulu 2016.
As an alternate perspective, the stiffness of aggregated materials such as dilute colloidal gels Shih et al. 1990; Mewis and Wagner 2012 and more dense powder agglomerates Kendall et al. 1987; Kendall and Stainton 2001 is often instead described only in terms of the volume fraction . In these cases, power laws are also commonly seen, with and where . Again, the prevailing consensus is that this reflects the scaling of an effective backbone of stress-bearing elements Mewis and Wagner 2012.
III.2 Onset of failure
As compression continues the stress-strain curves of Fig. 4(a) all show either a peak representing an ultimate compressive strength or a plateau indicative of a yield stress. Generally, higher initial packing fractions can sustain higher stresses, and strains, before beginning to fail. This can be compared to experiments involving the uniaxial compression of porous alumina Castillo-Villa et al. 2013, along with sandstones Baud et al. 2014 and their corresponding DEM simulations Schöpfer et al. 2009; McBeck et al. 2019, all of which demonstrate that porosity exerts a strong control on the strength of cohesive granular materials. There are several reasons for this. First, the absolute size of pores will have a tendency to be larger in more porous materials (assuming that the grain size is roughly constant) and will thus act as larger flaws for the purposes of concentrating stress above any limiting fracture toughness Sammis and Ashby 1986. Additionally, recent work on the transmission of force chains through cemented granulates suggests that there will be a greater localization of stress in more porous samples, significantly reducing their ultimate capacity to bear load McBeck et al. 2019.
In our case, the stress-strain curves for samples between and show clear peaks, corresponding to their brittle failure mode. On the other hand, for intermediate volume fractions the post-peak stress is maintained at a roughly constant level, which is consistent with a continuous yielding process, or plastic/ductile failure. At even lower packing fractions, the stress-strain curves become more intermittent, showing irregular drops in stress and at the very lowest simulations were halted before any clear stress plateau emerged. In the cases where it was reasonably well-defined (specifically, for ) we measured how the peak stress, , sustained during compression depends on the initial bond or contact density. These data, shown in Fig. 4(c) can be fit by a power law of exponent . Although expressed only over a small range of , this is in good agreement with the power law scaling, of exponent , reported by Gaume et al. Gaume et al. 2017 for the ultimate compressive strength of cohesive granulates made of sticky hard spheres.
In what follows we will focus on characterizing the three types of failure that occur in our simulations, as highlighted in Fig. 4(d-f), and the transitions between these failure modes. For example, these panels also show how the frequency of microcracks changes throughout each compression test. We measure this microcrack activity rate in terms of the number of broken bonds in each strain step, of size . In experiments the bond breakage rate can be estimated by monitoring acoustic emissions as a material sample deforms (e.g. Lockner et al. 1991; Sammonds et al. 1992; Olsson 1999; Baud et al. 2004; Fortin et al. 2006; Townend et al. 2008). Figure 4(d) shows how, in simulations for , a peak of microcrack activity occurs near the peak stress. The ductile response for , shown in Fig. 4(e), exhibits fewer microcracks, and a less well-defined peak. Finally, at the lowest packing densities abrupt spikes or bursts of activity accompany the intermittent stress drops. This can be seen in Fig. 4(f) near and , and is reminiscent of the intermittency of acoustic activity which accompanies compaction band formation in some more porous sandstones Baud et al. 2004, for example. In all cases, the spatial distribution of the internal damage changes near failure, as can be highlighted by a statistical analysis of the microcrack activity.
III.3 Entropy of microcrack activity near failure
As the initial volume fraction of our simulated cohesive granular material changes, it responds to compression by very different deformation processes. These reflect differences in the organization of damage in the samples during and beyond the elastic regime. As an indicator of the spatial distribution of the microcracks or bond failure events, we calculated the normalized configuration entropy of the microcrack locations as compression proceeds. Any clustering of microcracks, or localization of damage, can be detected through a decrease in this entropy Garcimartin et al. 1997, just as the entropy of a gas goes down when its atoms cluster together, rather than randomly filling space. The widespread adoption of this metric also allows for comparisons across a broad range of experiments and simulations of mechanical deformation. In this context the configuration, information or Shannon entropy has been used to predict the failure point of brittle and inhomogeneous materials, for example in experiments involving plaster, wood and fiberglass Garcimartin et al. 1997; Guarino et al. 1998. A decrease in this entropy has also been reported to accompany catastrophic failure in field observations, for example in acoustic signals in a galena mine Lu et al. 2005. Similarly, entropy measurement is used for applications such as the analysis of generic random-fuse models Reurings and Alava 2005 or earthquake time series Matcharashvili et al. 2002; Telesca et al. 2004; Padhy 2004; De Santis et al. 2011; Bressan et al. 2017. In all these cases the entropy, which describes whether damage is either spread out or localized and correlated throughout a sample, reduces towards the failure point.
We calculated the configuration entropy of the positions of microcrack activity following methods adapted from Refs. Garcimartin et al. 1997; Guarino et al. 1998. Specifically, by dividing the cylindrical system into cells, of size (i.e. slightly shorter than cubic cells), we measured the fraction of microcracks, , occurring in each cell in any given strain window. For these windows we divide the strain into 20 equal bins, each approximately 0.01 in width. The normalized entropy is then calculated as
| (14) |
Empty cells, outside the cylinder, are excluded from this summation. For ease of use, is normalized by the equipartition entropy, , which is the entropy sum calculated by assuming that all the microcracks occurring in that strain window were instead completely randomly distributed in space. This means that if bond breakage is indeed happening randomly, it would maximize the entropy with . As irreversible damage becomes more localized, decreases, approaching for perfectly co-localized events. However, while any localization trend should be well-captured by variations of entropy, the absolute value can depend on the chosen cell sizes Guarino et al. 1998, which should like comfortably between the particle and system scales. Although not tested here, the magnitude of will also likely vary with the system size, as the relative widths of shear bands in cohesive granulates are known to depend on the sample size Pál et al. 2016.
The variations of the normalized entropy, , with strain are shown in Fig. 5 for various packing fractions, superimposed over the global microcrack activity (calculated as in Fig. 4). With an increase in strain, the damage is localized in space and the rate of bond breakages increases. The localization trend appears as a reduction of entropy in terms of the spatial distribution of bond breakages.
At high packing fractions, as in Fig. 4(a), the entropy begins to drop well before peak stress is reached, as bond breaking events become more common. This precursor signal to shear-band formation is similar to that observed in typical experiments of fracture in heterogeneous brittle materials Garcimartin et al. 1997; Guarino et al. 1998. Additionally, we see that recovers to higher values after peak stress, as can be observed in earthquake time series after the mainshock and aftershocks Bressan et al. 2017, for example. Here, however, we attribute this to a gradual widening of the shear band as irreversible damage accumulates; without a mechanism for healing the model system will never come to a steady-state slip condition. In some simulations secondary bands also occur, as deformation proceeds. Both mechanisms will serve to increase , by adding to the volume over which strains and damage are focused. As the packing fraction decreases, the drop in entropy becomes less pronounced. As shown in Fig. 5(b), for there is still a noticeable dip in leading up to and accompanying the peak stress and peak microcrack activity. However, for , as in Fig. 5(c), the entropy maintains a constant value throughout the yielding process. Inspection of where the damage is happening, for example as can also be seen in Fig. 3(b,c), suggests that the weaker depression of that still occurs in such cases is due to damage accumulating near the upper and lower boundaries, as a result of the clamped boundary conditions used.
Perhaps most intriguingly, for the lowest packing fractions we see intermittent fluctuations in that accompany the formation of anti-cracks. Here, where there is a drop in stress and a spike in bond breakage activity, the corresponding entropy drop records a shift from a pattern of random damage accumulation to a very localized phenomenon. For the case of this can be seen in Fig. 5(d), near and , and this data is typical of our low- samples. We are not aware of any experiments that directly quantify during anti-cracking. However, comparison of our results to reports of the localization of compaction in acoustic emission studies of sandstone Olsson and Holcomb 2000, or which visualize compaction band growth in sandstones Baud et al. 2004 snow Barraclough et al. 2017 and foam Reis et al. 2009 suggest that the intermittent fluctuation of the positional entropy of microcrack activity may be a general feature of compaction band or anti-crack formation.
III.4 Transitions between failure process
In our simulations we have identified three distinct failure modes, which include (i) brittle failure with shear banding, (ii) ductile failure with plastic deformation and (iii) compaction with the formation of anti-crack, as was detailed in Fig. 3. We will here show how these modes can be distinguished in terms of the evolution of their local packing fractions, the spatial profiles of their beads’ coordination numbers and displacements, and by variations in the positional and angular correlations of microcracks.
Beginning with considerations of local packing fractions and dilatancy, we calculated the cumulative distribution function of the local packing fractions after different strains, using the VORO code library Rycroft 2009. The local packing fraction of particle is defined by , where and is the volume of its Voronoi cell (e.g. as in Refs. Voronoi 1908; Aste et al. 2007). The cumulative distribution function is then , for the probability distribution function . The results are shown in Fig. 6.
For high packing fractions, such as the case of shown in Fig. 6(a), the distribution function shifts to higher volume fractions as compression proceeds. This is a smooth increase, occurring at all volume fractions. A similar effect is seen in the motivating experiments, in which can be calculated from X-ray tomograms, and which show a reversible Reynolds dilatancy Hemmerle et al. 2016; Hemmerle et al.. In the simulations the extent of dilatancy reduces rapidly as the material becomes more porous and is barely noticeable by , as demonstrated in Fig. 6(b). In contrast, for low the material compresses more intuitively, with all particles reducing their local packing fraction, on average. This case is shown in Fig. 6(c), for . We can conclude that there is the cross-over between dilation and compaction with decreasing , as seen in terms of the cumulative distribution functions of the local packing fractions.
To better illustrate this cross-over point, we also measured how the median of the local volume fraction changes with increasing strain. This is found by noting that the median value, , occurs where . Figure 6(d) shows how changes away from its initial value, as samples with different initial packing fractions are compressed. We find that the change from a dilatant response, where , to a compressive response, where happens between and 0.525. Interestingly, this cross-over coincides with the change from brittle failure, via shear band formation, to a plastic failure. This condition is also consistent with a change in the sign of the dilatancy factor, , which in geomechanics derives from the ratio of the plastic volumetric to axial strains under deformation Wong and Baud 2012; Baud et al. 2006. In good agreement with experiments, when sandstones are compressed clear shear bands are seen for , whereas low-angle bands, compaction bands or homogeneous cataclastic flows are seen for Wong et al. 2001; Baud et al. 2006.
Next, further detailing the anti-crack formation seen at lower packing fractions, we describe how the coordination number and the vertical displacement of particles in a typical porous sample evolve during compression. Anti-cracks are a compressional instability with a displacement profile similar to an opening (mode-I) crack, but with an opposite sign Fletcher and Pollard 1981; Sternlof et al. 2005; Heierli et al. 2008; Reis et al. 2009. They can be identified by localized reductions in porosity Sternlof et al. 2005, microcrack activity Townend et al. 2008, damage accumulation Wong et al. 2001, strains and displacements Reis et al. 2009. Here, we characterize the damage localization of these features in our simulations by plotting the horizontally-averaged coordination number of a simulation of ; the data are taken from the simulation shown in Fig. 3(c), where an anti-crack can be seen to develop from one side of the sample to the other between strains of 0.11 and 0.16. As shown in Fig. 7(a), the anti-crack reduces the average number of contacts in a area about two-thirds of the way down the cylinder. At the same position, Fig. 7(b) shows that there is a discontinuity in the vertical displacement of the particles. In that panel we have calculated the horizontally-averaged displacement of the particles, after subtracting out the expected uniform compression. In both cases we have plotted positions in an undeformed coordinate system, normalized by the original sample height, .
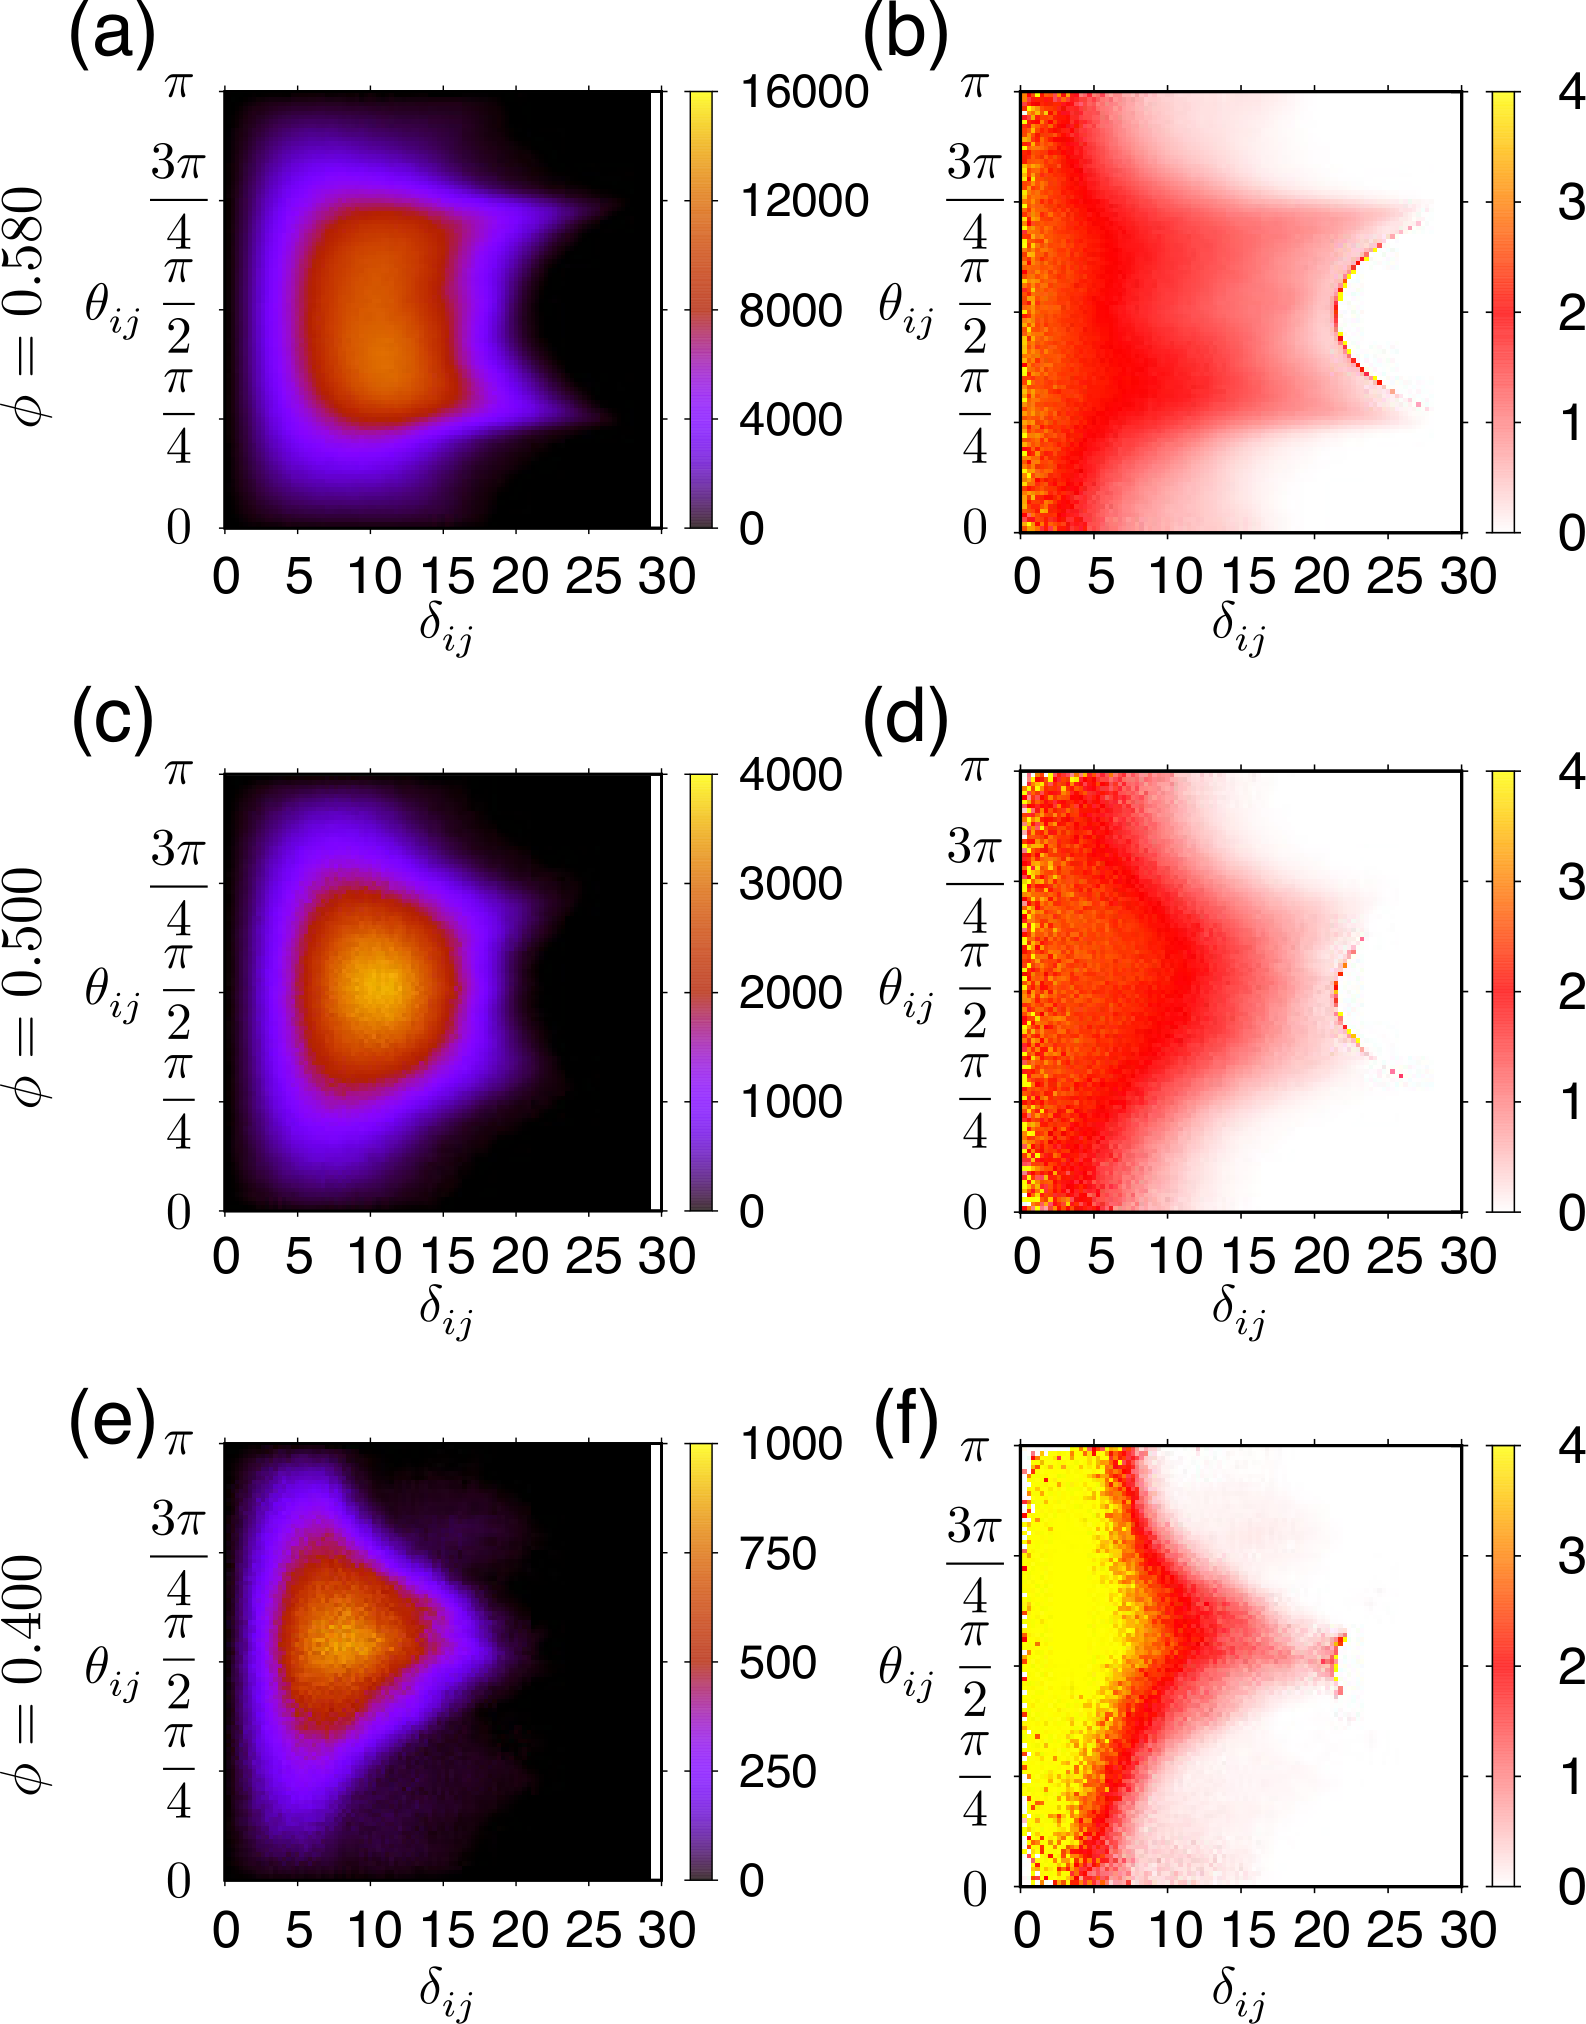
Finally, we show how the different patterns of damage in the various failure modes seen can also be well-described by a correlation analysis, based on the spatial distribution of bond breakage events. To calculate this correlation function we considered the locations of all such events throughout a numerical experiment. We then found the displacement vectors between all possible pairs of broken bonds. If averaged over all orientations, this would allow calculation of the pair correlation function . However, to capture the difference between shear and compaction bands, we measured the length and polar angle (i.e. angle measured from the axis of compression) of these pair-wise displacement vectors. In Fig. 8 we present results from compression tests calculated in this way. The right hand-side of this figure shows the same data, normalized by a correlation function calculated in a like manner but for random positions within the cylindrical sample. Figures 8(a,b) show the case of a shear band. Here, the inclination of the band at to the direction of compression is seen in the strong correlations at and ; this implies the localization of microcracks along diagonal planes. The case of diffuse plastic damage, given in Fig. 8(c,d), shows weaker correlations in any orientations. The last case, of an anti-crack, is given in Fig. 8(e,f), and shows the localized events in the horizontal direction of . Here, the width of the anti-crack feature, of about 5 particle diameters, is apparent by the increased correlations of bond breakages below this scale.
IV Summary and conclusions
In this paper, we have modeled a cemented or cohesive granular system by means of discrete element model (DEM) simulations. The simple yet fully constrained model can correctly predict considerable detail of the various modes of failure and elastic responses, and is therefore a strong candidate for venturing into situations that are hard to yet probe experimentally.
More specifically, the parameters in our model are carefully chosen so as to be consistent with experiments Hemmerle et al. 2016; Schmeink et al. 2017; Hemmerle et al. involving cohesive materials constructed by glass beads connected by relatively compliant polymer bridges. Its interactions include an energy-based failure criterion for the bonds between cemented or aggregated particles and bonds which themselves take experimentally measured spring constants. Despite the simplicity of the inputs, the model accurately reproduces the behaviors of its experimental analogue under compression. It has a similar stress-strain curve, elastic modulus, fails at appropriately large strains by shear failure, and shows dilatant behavior prior to failure, for example.
By varying the packing fraction of the particles and the geometry of their connections, while keeping all other interactions constant, we showed how our model was also able to reproduce other phenomena associated with the mechanical deformation of cohesive granular media. This includes details such as the particularly strong power-law scaling of the elastic modulus and compressive strength of cohesive granular materials with the density of bonds (as with Gaume et al. 2017), effectively described by . These results, in particular, lend support to the developing idea of how force chains control the failure processes in cohesive granular systems Gilabert et al. 2008; Baud et al. 2014; Roy and Tirumkudulu 2016; McBeck et al. 2019, by controlling the distribution and density of stress concentrations.
The model also provides an excellent framework for exploring transitions between failure modes, as it can reproduce shear banding, plastic creep and anti-cracks or compaction banding, in one unified system. These three types of failure are typical of porous materials including snow Kinosita 1967; Heierli et al. 2008; Barraclough et al. 2017, foam Reis et al. 2009, colloidal gels Shih et al. 1990; Roy and Tirumkudulu 2016; Mewis and Wagner 2012, powder aggregates Kendall et al. 1987; Kendall and Stainton 2001; Gilabert et al. 2008; Castillo-Villa et al. 2013, sandstone Baud et al. 2004; Baud et al. 2006; Fortin et al. 2006; Baud et al. 2012; Eichhubl et al. 2010; Schultz et al. 2010; Fossen et al. 2011; Townend et al. 2008 and so on. As an example, we demonstrated how the shift in the sign of the dilatancy factor corresponds to a shift from brittle to plastic failure, in a manner very similar to what has been reported in compressional tests on sandstone Baud et al. 2006. Additionally, we showed how anti-crack formation is associated with intermittent stress drops, strain and damage localization, and is accompanied by temporary reductions in the positional entropy of microcrack activity.
There remains wide scope for further application of this model. Its parameters can be changed to reflect different materials, from snow (low , weak bonds) to sandstone (high , stiff bonds with strength depending on cement or matrix content) and artificial composites like the materials that directly inspired it. The boundaries between failure types could be explored further, and system size effects investigated, as was done for shear band width in Ref. Pál et al. 2016. For example, we intend to extend the comparisons to our experiments to include a study of the effects of bond stiffness Hemmerle et al.. A similar effort could explore the effects of varying the volume fraction of the bond material, to allow for a broader characterization of rocks, such as in Wang et al. 2019; Delenne et al. 2009.
Acknowledgements.
This work was supported by the Leading Graduate Course for Frontiers of Mathematical Sciences and Physics, The University of Tokyo, MEXT. The authors would like to thank Arnaud Hemmerle (Synchrotron SOLEIL) for offering the experimental data and helpful discussions. Y. Y. and T. H. also acknowledge Grants-in-Aid for Scientific Research (KAKENHI) No. JP16H06478.References
- Jiang et al. (2013) M. Jiang, W. Zhang, Y. Sun, and S. Utili, An investigation on loose cemented granular materials via DEM analyses, Granul. Mat. 15, 65 (2013).
- Hemmerle et al. (2016) A. Hemmerle, M. Schröter, and L. Goehring, A cohesive granular material with tunable elasticity, Sci. Rep. 6, 35650 (2016).
- Schmeink et al. (2017) A. Schmeink, L. Goehring, and A. Hemmerle, Fracture of a model cohesive granular material, Soft Matter 13, 1040 (2017).
- Wang et al. (2019) W. Wang, J. Pan, and F. Jin, Mechanical behavior of cemented granular aggregates under uniaxial compression, J. Mater. Civ. Eng. 31, 04019047 (2019).
- Lawn (1993) B. Lawn, Fracture of brittle solids (Cambridge University Press, 1993).
- Wong and Baud (2012) T.-f. Wong and P. Baud, The brittle-ductile transition in porous rock: A review, J. Struct. Geol. 44, 25 (2012).
- Fletcher and Pollard (1981) R. C. Fletcher and D. D. Pollard, Anticrack model for pressure solution surfaces, Geology 9, 419 (1981).
- Sternlof et al. (2005) K. R. Sternlof, J. W. Rudnicki, and D. D. Pollard, Anticrack inclusion model for compaction bands in sandstone, J. Geophys. Res. 110 (2005).
- Heierli et al. (2008) J. Heierli, P. Gumbsch, and M. Zaiser, Anticrack nucleation as triggering mechanism for snow slab avalanches, Science 321, 240 (2008).
- Lockner et al. (1991) D. Lockner, J. D. Byerlee, V. Kuksenko, A. Ponomarev, and A. Sidorin, Quasi-static fault growth and shear fracture energy in granite, Nature 350, 39 (1991).
- Sammonds et al. (1992) P. R. Sammonds, P. G. Meredith, and I. G. Main, Role of pore fluid in the generation of seismic precursors to shear failure, Nature 359, 228 (1992).
- Olsson and Holcomb (2000) W. A. Olsson and D. J. Holcomb, Compaction localization in porous rock, Geophys. Res. Lett. 27, 3537 (2000).
- Zang et al. (2000) A. Zang, F. C. Wagner, S. Stanchits, C. Janssen, and G. Dresen, Fracture process zone in granite, J. Geophys. Res. 105, 23651 (2000).
- Baud et al. (2004) P. Baud, E. Klein, and T.-f. Wong, Compaction localization in porous sandstones: spatial evolution of damage and acoustic emission activity, J. Struct. Geol. 26, 603 (2004).
- Fortin et al. (2006) J. Fortin, S. Stanchits, G. Dresen, and Y. Guéguen, Acoustic emission and velocities associated with the formation of compaction bands in sandstone, J. Geophys. Res. 111 (2006).
- Townend et al. (2008) E. Townend, B. D. Thompson, P. M. Benson, P. G. Meredith, P. Baud, and R. P. Young, Imaging compaction band propagation in Diemelstadt sandstone using acoustic emission locations, Geophys. Res. Lett. 35, L15301 (2008).
- Renard et al. (2009) F. Renard, D. Bernard, J. Desrues, and A. Ougier-Simonin, 3D imaging of fracture propagation using synchrotron X-ray microtomography, Earth Planet. Sci. Lett. 286, 285 (2009).
- Renard et al. (2018) F. Renard, J. Weiss, J. Mathiesen, Y. Ben-Zion, N. Kandula, and B. Cordonnier, Critical evolution of damage toward system-size failure in crystalline rock, J. Geophys. Res. 123, 1969 (2018).
- Ilin et al. (2020) E. Ilin, Y. Li, E. V. Colla, K. T. Christensen, M. Sahimi, M. Marchevsky, S. M. Frailey, and A. Bezryadin, Nanoscale detection of metastable states in porous and granular media, Journal of Applied Physics 127, 024901 (2020).
- Castillo-Villa et al. (2013) P. O. Castillo-Villa, J. Baró, A. Planes, E. K. H. Salje, P. Sellappan, W. M. Kriven, and E. Vives, Crackling noise during failure of alumina under compression: the effect of porosity, J. Phys. Condens. Matter 25, 292202 (2013).
- Salje et al. (2013) E. K. H. Salje, G. I. Lampronti, D. E. Soto-Parra, J. Baró, A. Planes, and E. Vives, Noise of collapsing minerals: Predictability of the compressional failure in goethite mines, American Mineralogist 98, 609 (2013).
- Kun et al. (2014) F. Kun, I. Varga, S. Lennartz-Sassinek, and I. G. Main, Rupture cascades in a discrete element model of a porous sedimentary rock, Phys. Rev. Lett. 112, 065501 (2014).
- Pál et al. (2016) G. Pál, Z. Jánosi, F. Kun, and I. G. Main, Fragmentation and shear band formation by slow compression of brittle porous media, Phys. Rev. E 94, 053003 (2016).
- Karman (1911) T. V. Karman, Festigkeitsversuche unter allseitigem Drunk, Z. Ver. Deu. Ing. 55, 1749 (1911).
- Paterson (1958) M. Paterson, Experimental deformation and faulting in Wombeyan marble, Geol. Soc. Am. Bull. 69, 465 (1958).
- Heard (1960) H. C. Heard, Transition from brittle fracture to ductile flow in Solenhofen limestone as a function of temperature, confining pressure, and interstitial fluid pressure., Mem. Geol. Soc. Amer. 79, 193 (1960).
- Handin and Hager Jr. (1957) J. Handin and R. V. Hager Jr., Experimental deformation of sedimentary rocks under confining pressure: Tests at room temperature on dry samples, Am. Assoc. Pet. Geol. Bull. 41, 1 (1957).
- Handin et al. (1963) J. Handin, R. V. Hager Jr., M. Friedman, and J. N. Feather, Experimental deformation of sedimentary rocks under confining pressure: pore pressure tests, Am. Assoc. Pet. Geol. Bull. 47, 717 (1963).
- Robinson (1959) L. H. Robinson, The effect of pore and confining pressure on the failure process in sedimentary rock, in The 3rd US Symposium on Rock Mechanics (American Rock Mechanics Association, 1959).
- Tönnies et al. (2014) D. Tönnies, R. Maaß, and C. A. Volkert, Room temperature homogeneous ductility of micrometer‐sized metallic glass, Adv. Mater. 26, 5715 (2014).
- Volkert and Lilleodden (2006) C. A. Volkert and E. T. Lilleodden, Size effects in the deformation of sub-micron Au columns, Philos. Mag. 86, 5567 (2006).
- Hill (1989) R. E. Hill, Analysis of deformation bands in the Aztec sandstone, Valley of Fire State Park, Nevada (1989).
- Mollema and Antonellini (1996) P. N. Mollema and M. A. Antonellini, Compaction bands: a structural analog for anti-mode I cracks in aeolian sandstone, Tectonophysics 267, 209 (1996).
- Olsson (1999) W. A. Olsson, Theoretical and experimental investigation of compaction bands in porous rock, J. Geophys. Res. 104, 7219 (1999).
- Issen and Rudnicki (2000) K. A. Issen and J. W. Rudnicki, Conditions for compaction bands in porous rock, J. Geophys. Res. 105, 21529 (2000).
- Wong et al. (2001) T.-f. Wong, P. Baud, and E. Klein, Localized failure modes in a compactant porous rock, Geophys. Res. Lett. 28, 2521 (2001).
- Baud et al. (2012) P. Baud, P. Meredith, and E. Townend, Permeability evolution during triaxial compaction of an anisotropic porous sandstone, J. Geophys. Res. 117 (2012).
- Eichhubl et al. (2010) P. Eichhubl, J. N. Hooker, and S. E. Laubach, Pure and shear-enhanced compaction bands in Aztec sandstone, J. Struct. Geol. 32, 1873 (2010).
- Schultz et al. (2010) R. A. Schultz, C. H. Okubo, and H. Fossen, Porosity and grain size controls on compaction band formation in Jurassic Navajo Sandstone, Geophys. Res. Lett. 37 (2010).
- Fossen et al. (2011) H. Fossen, R. A. Schultz, and A. Torabi, Conditions and implications for compaction band formation in the Navajo Sandstone, Utah, J. Struct. Geol. 33, 1477 (2011).
- Katsman et al. (2005) R. Katsman, E. Aharonov, and H. Scher, Numerical simulation of compaction bands in high-porosity sedimentary rock, Mech. Mater. 37, 143 (2005).
- Marketos and Bolton (2009) G. Marketos and M. D. Bolton, Compaction bands simulated in discrete element models, J. Struct. Geol. 31, 479 (2009).
- Reis et al. (2009) P. M. Reis, F. Corson, A. Boudaoud, and B. Roman, Localization through surface folding in solid foams under compression, Phys. Rev. Lett. 103, 045501 (2009).
- Kinosita (1967) S. Kinosita, Compression of snow at constant speed, Phys. Snow Ice Proc. 1, 911 (1967).
- Barraclough et al. (2017) T. W. Barraclough, J. R. Blackford, S. Liebenstein, S. Sandfeld, T. J. Stratford, G. Weinländer, and M. Zaiser, Propagating compaction bands in confined compression of snow, Nat. Phys. 13, 272 (2017).
- Sternlof et al. (2006) K. R. Sternlof, M. Karimi-Fard, D. D. Pollard, and L. J. Durlofsky, Flow and transport effects of compaction bands in sandstone at scales relevant to aquifer and reservoir management, Water Resources Research 42, W07425 (2006).
- Cundall and Strack (1979) P. A. Cundall and O. D. Strack, A discrete numerical model for granular assemblies, Geotechnique 29, 47 (1979).
- (48) A. Hemmerle, Y. Yamaguchi, S. Biswas, M. Makowski, O. Bäumchen, and L. Goehring, (in preparation) .
- Baud et al. (2006) P. Baud, V. Vajdova, and T.-F. Wong, Shear-enhanced compaction and strain localization: Inelastic deformation and constitutive modeling of four porous sandstones, J. Geophys. Res. 111, B12401 (2006).
- Penskiy et al. (2011) I. Penskiy, A. P. Gerratt, and S. Bergbreiter, Friction, adhesion and wear properties of PDMS films on silicon sidewalls, J. Micromech. Microeng. 21, 105013 (2011).
- Chopin et al. (2011) J. Chopin, A. Prevost, A. Boudaoud, and M. Adda-Bedia, Crack front dynamics across a single heterogeneity, Phys. Rev. Lett. 107, 144301 (2011).
- Luding (2008) S. Luding, Cohesive, frictional powders: contact models for tension, Granular matter 10, 235 (2008).
- Clarke and Wiley (1987) A. S. Clarke and J. D. Wiley, Numerical simulation of the dense random packing of a binary mixture of hard spheres: Amorphous metals, Phys. Rev. B 35, 7350 (1987).
- Clarke and Jónsson (1993) A. S. Clarke and H. Jónsson, Structural changes accompanying densification of random hard-sphere packings, Phys. Rev. E 47, 3975 (1993).
- Box (1958) G. E. Box, A note on the generation of random normal deviates, Ann. Math. Stat. 29, 610 (1958).
- Brendel et al. (2011) L. Brendel, J. Török, R. Kirsch, and U. Bröckel, A contact model for the yielding of caked granular materials, Granular Matter 13, 777 (2011).
- Kendall et al. (1987) K. Kendall, N. M. Alford, and J. D. Birchall, Elasticity of particle assemblies as a measure of the surface energy of solids, Proc. R. Soc. London, Sect. A 412, 269 (1987).
- Kendall and Stainton (2001) K. Kendall and C. Stainton, Adhesion and aggregation of fine particles, Powder Technol. 121, 223–229 (2001).
- Shih et al. (1990) W.-H. Shih, W. Y. Shih, S.-I. Kim, J. Liu, and I. A. Aksay, Scaling behavior of the elastic properties of colloidal gels, Phys. Rev. A 42, 4772 (1990).
- Mewis and Wagner (2012) J. Mewis and N. J. Wagner, Colloidal suspension rheology (Cambridge University Press, 2012).
- Gaume et al. (2017) J. Gaume, H. Löwe, S. Tan, and L. Tsang, Scaling laws for the mechanics of loose and cohesive granular materials based on Baxter’s sticky hard spheres, Phys. Rev. E 96, 032914 (2017).
- Walton (1987) K. Walton, The effective elastic moduli of a random packing of spheres, J. Mech. Phys. Solids 35, 213 (1987).
- Gilabert et al. (2008) F. A. Gilabert, J.-N. Roux, and A. Castellanos, Computer simulation of model cohesive powders: Plastic consolidation, structural changes, and elasticity under isotropic loads, Phys. Rev. E 78, 031305 (2008).
- Roy and Tirumkudulu (2016) S. Roy and M. S. Tirumkudulu, Yielding in a strongly aggregated colloidal gel. Part I: 2D simulations, J. Rheol. 60, 559 (2016).
- Baud et al. (2014) P. Baud, T.-F. Wong, and W. Zhu, Effects of porosity and crack density on the compressive strength of rocks, Int. J. Rock Mech. Min. 67, 202 (2014).
- Schöpfer et al. (2009) M. P. Schöpfer, S. Abe, C. Childs, and J. J. Walsh, The impact of porosity and crack density on the elasticity, strength and friction of cohesive granular materials: Insights from DEM modelling, Int. J. Rock Mech. Min. 46, 250 (2009).
- McBeck et al. (2019) J. McBeck, K. Mair, and F. Renard, How porosity controls macroscopic failure via propagating fractures and percolating force chains in porous granular rocks, J. Geophys. Res. 124, 10.1029/2019JB017825 (2019).
- Sammis and Ashby (1986) C. G. Sammis and M. F. Ashby, The failure of brittle porous solids under compressive stress states, Acta Metall. 34, 511 (1986).
- Garcimartin et al. (1997) A. Garcimartin, A. Guarino, L. Bellon, and S. Ciliberto, Statistical properties of fracture precursors, Phys. Rev. Lett. 79, 3202 (1997).
- Guarino et al. (1998) A. Guarino, A. Garcimartin, and S. Ciliberto, An experimental test of the critical behaviour of fracture precursors, Eur. Phys. J. B 6, 13 (1998).
- Lu et al. (2005) C. Lu, Y.-W. Mai, and H. Xie, A sudden drop of fractal dimension: a likely precursor of catastrophic failure in disordered media, Phil. Mag. Lett. 85, 33 (2005).
- Reurings and Alava (2005) F. Reurings and M. Alava, Damage growth in random fuse networks, Eur. Phys. J. B 47, 85 (2005).
- Matcharashvili et al. (2002) T. Matcharashvili, T. Cheldize, J. Gogiashvili, and Z. Tsertsvadze, Difference in dynamics of distribution and variation of nonlinear correlations in earthquakes temporal, spatial and energetic domains, J. Georgian Geophys. Soc. A 7, 39 (2002).
- Telesca et al. (2004) L. Telesca, V. Lapenna, and M. Lovallo, Information entropy analysis of seismicity of Umbria-Marche region (Central Italy), Nat. Hazards Earth Syst. Sci. 4, 691 (2004).
- Padhy (2004) S. Padhy, Intermittent criticality on a regional scale in Bhuj, Geophys. J. Int. 158, 676 (2004).
- De Santis et al. (2011) A. De Santis, G. Cianchini, P. Favali, L. Beranzoli, and E. Boschi, The Gutenberg–Richter law and entropy of earthquakes: two case studies in Central Italy, Bull. Seismol. Soc. Am. 101, 1386 (2011).
- Bressan et al. (2017) G. Bressan, C. Barnaba, S. Gentili, and G. Rossi, Information entropy of earthquake populations in northeastern Italy and western Slovenia, Phys. Earth Planet. Inter. 271, 29 (2017).
- Rycroft (2009) C. Rycroft, Voro++: A three-dimensional Voronoi cell library in C++, Tech. Rep. (Lawrence Berkeley National Lab.(LBNL), Berkeley, CA (United States), 2009).
- Voronoi (1908) G. Voronoi, New parametric applications concerning the theory of quadratic forms-second announcement, J. Reine Angew. Math 134, 198 (1908).
- Aste et al. (2007) T. Aste, T. Di Matteo, M. Saadatfar, T. J. Senden, M. Schröter, and H. L. Swinney, An invariant distribution in static granular media, Europhys. Lett. 79, 24003 (2007).
- Delenne et al. (2009) J.-Y. Delenne, V. Topin, and F. Radjai, Failure of cemented granular materials under simple compression: experiments and numerical simulations, Acta Mech. 205, 9 (2009).
- Hazzard et al. (2000) J. F. Hazzard, R. P. Young, and S. Maxwell, Micromechanical modeling of cracking and failure in brittle rocks, J. Geophys. Res. 105, 16683 (2000).
- Boutt and McPherson (2002) D. F. Boutt and B. J. McPherson, Simulation of sedimentary rock deformation: Lab-scale model calibration and parameterization, Geophys. Res. Lett. 29, 13 (2002).
- Rudnicki and Rice (1975) J. W. Rudnicki and J. Rice, Conditions for the localization of deformation in pressure-sensitive dilatant materials, J. Mech. Phys. Solids 23, 371 (1975).
- Nguyen and Amon (2016) T. B. Nguyen and A. Amon, Experimental study of shear band formation: Bifurcation and localization, EPL 116, 28007 (2016).
- Main and Al-Kindy (2002) I. G. Main and F. H. Al-Kindy, Entropy, energy, and proximity to criticality in global earthquake populations, Geophys. Res. Lett. 29, 25 (2002).
- Sakaie et al. (2008) K. Sakaie, D. Fenistein, T. J. Carroll, M. van Hecke, and P. Umbanhowar, MR imaging of Reynolds dilatancy in the bulk of smooth granular flows, EPL 84, 38001 (2008).
- Kabla and Senden (2009) A. J. Kabla and T. J. Senden, Dilatancy in slow granular flows, Phys. Rev. Lett. 102, 228301 (2009).
- Roux and Radjai (1998) S. Roux and F. Radjai, Texture-dependent rigid-plastic behavior, in Physics of dry granular media (Springer, 1998) pp. 229–236.
- Amini and Hamidi (2014) Y. Amini and A. Hamidi, Triaxial shear behavior of a cement-treated sand-gravel mixture, J. Rock Mech. Geotech. Eng. 6, 455 (2014).
- Wang et al. (2017) X. Wang, H. Li, K. Chandrashekhara, S. A. Rummel, S. Lekakh, D. C. Van Aken, and R. J. O’Malley, Inverse finite element modeling of the barreling effect on experimental stress-strain curve for high temperature steel compression test, J. Mater. Process. Technol. 243, 465 (2017).
*