The VIMOS Ultra-Deep Survey: the Ly emission line morphology at Thanks: Based on data obtained with the European Southern Observatory Very Large Telescope, Paranal, Chile, under Large Program 185.A–0791.
Abstract
The Lyman- (Ly) emission line has been ubiquitously used to confirm and study high redshift galaxies. We report on the line morphology as seen in the 2D spectra from the VIMOS Ultra Deep Survey (VUDS) in a sample of 914 Ly emitters from a parent sample of 4192 star-forming galaxies at . The study of the spatial extent of Ly emission provides insight into the escape of Ly photons from galaxies. We classify the line emission as either non-existent, coincident, projected spatial offset, or extended with respect to the observed 2D UV continuum emission. The line emitters in our sample are classified as coincident, extended and offset emitters. For galaxies with detected UV continuum, we show that extended Ly emitters (LAEs) correspond to the highest equivalent width galaxies (with an average Å). This means that this class of objects is the most common in narrow-band selected samples, which usually select high equivalent width LAEs, Å. Extended Ly emitters are found to be less massive, less star-forming, with lower dust content, and smaller UV continuum sizes (kpc) of all the classes considered here. We also find that galaxies with larger UV-sizes have lower fractions of Ly emitters. By stacking the spectra per emitter class we find that the weaker Ly emitters have stronger low ionization inter-stellar medium (ISM) absorption lines. Interestingly, we find that galaxies with Ly offset emission (median separation of kpc from UV continuum) show similar velocity offsets in the ISM as those with no visible emission (and different from other Ly emitting classes). This class of objects may hint at episodes of gas accretion, bright offset clumps or on-going merging activity into the larger galaxies.
Key Words.
Galaxies: formation – Galaxies: evolution– Galaxies: structure – Galaxies: high-redshift1 Introduction
The Lyman- (Ly) emission line is the intrinsically brightest feature in a hot source spectrum (Schaerer 2003, e.g.). Combined with the fact that this line is redshifted into the optical and near-infrared regime for a broad redshift range (), it is one of the most used tracers of galaxies at high redshift. However, due to its resonant nature it is easily scattered by gas clouds (HI) and its emission can be suppressed by the presence of dust.
The radiative transfer process that eventually leads the Ly photons to escape from their emitting region gives rise to a number of line profiles that have been already reported in observations: asymmetric line profiles (Kunth et al. 1998; Rhoads et al. 2003; Shapley et al. 2003; Shimasaku et al. 2006; Tapken et al. 2007; Vanzella et al. 2010; Lidman et al. 2012; Wofford et al. 2013, e.g.), double peak profiles (Shapley et al. 2006; Quider et al. 2009; Kulas et al. 2012; Yamada et al. 2012; Matthee et al. 2018, e.g.) as well as spatially extended emission surrounding galaxies (Fynbo et al. 2001; Steidel et al. 2003; Steidel et al. 2011; Rhoads et al. 2005; Hayes et al. 2005; Hayes et al. 2007; Rauch et al. 2008; Östlin et al. 2009; Matsuda et al. 2012; Wisotzki et al. 2016, e.g.). In an attempt to explain such diversity of profiles theoretical and numerical models have been proposed (Harrington 1973; Neufeld 1990; Neufeld 1991; Loeb & Rybicki 1999; Ahn et al. 2000; Zheng & Miralda-Escudé 2002; Dijkstra et al. 2006; Hansen & Oh 2006; Tasitsiomi 2006; Verhamme et al. 2006; Verhamme et al. 2012; Laursen et al. 2009; Duval et al. 2014; Gronke et al. 2015, e.g.).
The detection of the Ly line is a very successful method to identify high redshift galaxies using large narrow-band surveys in the optical (Cowie & Hu 1998; Rhoads et al. 2000; Shimasaku et al. 2006; Ouchi et al. 2008; Ouchi et al. 2010; Ouchi et al. 2018; Sobral et al. 2017; Sobral et al. 2018; Hao et al. 2018, e.g.) and to spectroscopically detect or confirm high redshift candidates (Martin & Sawicki 2004; Le Fèvre et al. 2005; Cassata et al. 2011; Ono et al. 2012; Finkelstein et al. 2013; Bacon et al. 2015; Le Fèvre et al. 2015; Zitrin et al. 2015, e.g.) and large samples of such galaxies have been collected to date. From these samples, the study of their rest-frame UV morphologies at is also widely covered (Pirzkal et al. 2007; Taniguchi et al. 2009; Bond et al. 2009; Bond et al. 2011; Bond et al. 2012; Gronwall et al. 2011; Kobayashi et al. 2016; Paulino-Afonso et al. 2018, e.g.). When considering the local Universe and due to the impossibility of obtaining rest-frame UV observations from ground observatories, the Ly Reference Sample (Östlin et al. 2014, LARS,) is the only study that focuses on the morphology of Ly emitters (Guaita et al. 2015, LAEs,).
Ly emission is often found to be more extended (in a diffuse halo) than the stellar UV continuum emission (Rauch et al. 2008; Finkelstein et al. 2011; Steidel et al. 2011; Matsuda et al. 2012; Feldmeier et al. 2013; Momose et al. 2014; Momose et al. 2016; Matthee et al. 2016; Wisotzki et al. 2016; Leclercq et al. 2017; Xue et al. 2017, e.g.). The process responsible for such observations is thought to be the scattering of photons by neutral HI gas around galaxies at high redshift (Zheng et al. 2011, e.g.). Galaxies with observed Ly emission are found to have small rest-frame UV sizes at all observed redshifts (Venemans et al. 2005; Malhotra et al. 2012; Paulino-Afonso et al. 2018, e.g). Such findings are at odds with the stronger evolution in galaxy sizes seen for galaxy populations selected on other criteria (Ferguson et al. 2004; Bouwens et al. 2004; van der Wel et al. 2014; Morishita et al. 2014; Shibuya et al. 2016; Ribeiro et al. 2016, using similar size estimates on Lyman-break or UV continuum selected galaxies, especially at , e.g.). Additionally, there is evidence for a positive correlation between line luminosity and galaxy UV continuum size (Hagen et al. 2014; Paulino-Afonso et al. 2018, e.g.) as well as between the extent of Ly with the extent of the UV emission (Wisotzki et al. 2016; Leclercq et al. 2017; Xue et al. 2017, e.g.). There also seems to be a correlation between galaxy UV size and the escape of ionizing radiation, with the smallest galaxies having the highest escape fraction (Marchi et al. 2018, e.g.).
The mechanisms through which Ly photons escape into inter-galactic space are complex and photons can travel for several kpc in random walks before free-roaming towards our line of sight (Zheng et al. 2011; Dijkstra & Kramer 2012; Rosdahl & Blaizot 2012; Lake et al. 2015; Trebitsch et al. 2017; Kimm et al. 2019, e.g.). Such large excursions increase the chance of dust absorption corresponding to photon destruction (Neufeld 1991; Laursen et al. 2013, e.g.). And there are simulations that show that the escape fraction is linked to the galaxy inclination with respect to the line of sight (Verhamme et al. 2012; Behrens & Braun 2014). Observationally, the escape fraction of Ly photons is anti-correlated to dust attenuation and star formation rate (SFR) but large scatter is observed (Hayes et al. 2010; Hayes et al. 2011; Atek et al. 2014; Matthee et al. 2016, e.g.). Other studies show that a key quantity in determining Ly emissivity is the column density of neutral hydrogen (Shibuya et al. 2014b; Shibuya et al. 2014a, e.g.).
The comparison of LAEs (usually with ) with galaxies with weak or no Ly emission is ubiquitous in the literature (Shapley et al. 2001; Erb et al. 2006; Gawiser et al. 2006; Gawiser et al. 2007; Pentericci et al. 2007; Lai et al. 2008; Reddy et al. 2008; Finkelstein et al. 2009; Kornei et al. 2010; Nilsson et al. 2011; Acquaviva et al. 2012; Le Fèvre et al. 2015; Cassata et al. 2015; Hathi et al. 2016; Oyarzún et al. 2017; Santos et al. 2020, e.g). While some studies indicate that LAEs are low mass, dust poor galaxies and likely the early stage of galactic evolution (Erb et al. 2006; Gawiser et al. 2006; Gawiser et al. 2007; Pentericci et al. 2007; Santos et al. 2020, e.g.) others point to a scenario where LAEs can be older (Kornei et al. 2010) and more massive (Lai et al. 2008, e.g.). Some find small differences between LAEs and the typical star-forming population when drawn from the same parent selection(Hathi et al. 2016, e.g.). Relatively extreme optical emission line galaxies detected at ([OII] and [OIII] emitters with average EW([OIII])200Å) are found to have similar stellar masses to LAEs, but they are less massive and less star forming than the most massive color-selected star-forming galaxies at these redshifts (Hagen et al. 2016, e.g.).
In this paper we report a taxonomy study on the shape of the 2D Ly emission line using data from the VIMOS Ultra Deep Survey (Le Fèvre et al. 2015, VUDS,), a large spectroscopic survey with secure spectroscopic redshifts for galaxies at representative of the star-forming population at this epoch. We divide our sample into different classes according to the Ly 2D shape with respect to the UV continuum and then report on the abundance of each class as a function of redshift and estimate median key physical parameters (stellar mass, SFR, age, dust extinction) associated with each class. We also attempt at interpreting each class with an schematic 3D model of line emission. We use the acronym LAGs for Ly emitting Galaxies (defined as objects with secure classification of visible Ly emission from their 2D spectra) instead of LAEs to avoid confusion with the standard definition of LAEs in the literature.
This paper is organized as follows. In Sect. 2 we briefly describe the VUDS survey and we highlight our sample selection. In Sect. 3 we describe the classification scheme that we designed as well as the method used for the classification. In Sect. 4 we summarize our findings in terms of the impact of redshift, stellar mass, line luminosity, line equivalent width, and UV luminosity on the derived classification. In Sect. 5 we present and discuss the physical properties associated with each class. We discuss our findings in the context of current radiative transfer models of Ly in Sect. 6 and summarize the main results in Sect. 7. We use a cosmology with , and . All magnitudes are given in the AB system (Oke & Gunn 1983). Equivalent widths () are in the rest-frame with the convention that negative denotes emission. Line fluxes are in units unless explicitly stated otherwise.
2 Data
As presented by Le Fèvre et al. 2015, VUDS is a large spectroscopic survey that targeted objects covering an area of 1 deg2 on three separate fields: COSMOS, ECDFS, and VVDS-02h. With the objective to observe galaxies in the redshift range , targets were selected based on the first or second photometric redshift peaks being at and typically at . In addition, a small number of targets were selected using a redshift specific color-color criterion for being at a specific redshift , e.g., a Lyman Break Galaxy (LBG) selection for galaxies, if not already selected through their photometric redshift.. Since for these we can use the set of filters to estimate the break in the continuum, the latter category of targets are not necessarily brighter than . To fill in the remaining available space on the masks, randomly selected samples with were added to the target list. The spectra were obtained using the VIMOS spectrograph on the ESO-VLT covering, with two low resolution grisms (R=230), a wavelength range of . The total integration is h per pointing and grism.
Data processing is performed within the VIPGI environment (Scodeggio et al. 2005) and is followed by extensive redshift measurements campaigns using the EZ redshift measurement engine (Garilli et al. 2010). At the end of this process each galaxy has flux and wavelength calibrated 2D and 1D spectra, a spectroscopic redshift measurement, and associated redshift reliability flag. For further information on the data processing we refer to Le Fèvre et al. 2015.


To conduct this study we selected all primary and secondary target galaxies in the VUDS survey for which we have the most reliable redshift measurements, i.e. galaxies with redshift flags 2 and 9 (80% probability to be correct) and flags 3 and 4 (95 -100% probability to be correct). For more details on the reliability flags we refer to Le Fèvre et al. 2015. This constraint led to a total of 4360 targets which after removing duplicate objects results in a total of 4192 individual galaxies (2100 in COSMOS, 1575 in VVDS-02h and 517 in ECDFS) to be visually inspected for the presence of the Ly line and subsequently classified.
2.1 Spectral Energy Distribution
We use the physical parameters derived from the simultaneous SED fitting of the VUDS spectra and all multi-wavelength photometry available for each galaxy, using the code GOSSIP+ as described by Thomas et al. 2017b. This method expands the classical SED fitting technique to make use of the UV rest-frame spectra in addition to photometry, improving the accuracy of physical parameter measurements (Thomas et al. 2017b, for more details about the improvement, see). It also provides measurements of physical quantities such as galaxy ages as well as the IGM transmission along the line of sight of each galaxy, an improvement compared to using a fixed transmission at a given redshift (Thomas et al. 2017a).
To fit the photometric+spectroscopic data we use templates derived from Bruzual & Charlot 2003 models with a Chabrier 2003 initial mass function. To model the star formation histories (SFH) we use an exponentially declining parametrization as ( in the range 0.1 Gyr to 30 Gyr) and two additional models with delayed SFH peaking at 1 and 3 Gyr. The templates are created in a grid of 51 ages (in the range 0.1 Gyr to 14.5 Gyr). We apply a Calzetti et al. 2000 dust extinction law to the templates, using in the range 0 to 0.5. Models with four different metallicities are used (). The parameters of interest in this paper are the stellar mass (M⋆), , dust extinction () and age (Thomas et al. 2017b, as described by), for which the median values of the probability density function are used. We expect a statistical uncertainty of 0.1 dex in stellar masses, 0.15 dex in SFR, and a uncertainty on the age (Thomas et al. 2017b). For further details about typical uncertainties on these quantities see also Ilbert et al. 2013 and Tasca et al. 2015.
2.2 Galaxy sizes
We use GALFIT (Peng et al. 2002; Peng et al. 2010) on F814W images from COSMOS (Koekemoer et al. 2007) and CANDELS (Koekemoer et al. 2011) to derive effective radii and use the total extent measurement described by Ribeiro et al. 2016 which defines the radius of a circle with the same area as the total extent of the galaxy above a limiting isophote. We also use our which is derived from the area containing 50% of the galaxy light above the same isophote. For all size related analysis, we restrict our sample of galaxies to have HST imaging coverage in the COSMOS and ECDFS fields, to have stellar masses and to be in the redshift range where our measurements of total extent are valid (see Ribeiro et al. 2016, for more details). This yields a total of 1040 galaxies with size measurements.
2.3 Ly line properties
The line fluxes and equivalent widths were measured as described by Cassata et al. 2015. In summary, we used the noao.onedspec.splot tool available from iraf (Tody 1986; Tody 1993). The continuum was estimate from two manually chosen points, one on each side of the line. The flux of the line is then computed from direct integration of the spectra above the estimated continuum. This allows to estimate accurately the properties of individual lines which often deviate from a simple Gaussian in the case of Ly. Doing this process interactively also minimizes possible issues in the continuum estimation that may from defects in individual spectra. The uncertainties were computed using the formalism from Tresse et al. 1999 and we estimate a typical uncertainty of Å (for weak absorbers and emitters) and up to Å (for strong absorbers and emitters).
We note, however, that these measurements were all performed on the extracted one-dimensional spectra. From experience in the survey we know that the spectral extraction window is often defined by the extent of the UV continuum on the 2D spectra and misses some of the flux of the Ly line, especially in cases where the line is extended or even offset from the continuum (see e.g. Fig. 1, left panel). We compute the ratio of the line flux of initial extracted 1D spectra to the flux extracted in an aperture that is centred on and encompasses the full extent of the Ly line to estimate the level of flux loss in Ly. We find an average flux loss of 19% for offset Ly emitters (with 68% of the galaxies - calculated from the 16th and 84th percentiles - having flux losses between 5% and 38%) and 8% for extended Ly emitters (with 68% of the galaxies having flux losses between 3% and 15%). We do not apply any correction to the individual spectra since this level of flux loss estimate does not affect any conclusions from our study.
3 Classification Scheme
We use the 2D spectrograms produced by VIMOS slits, with the spatial dimension of the spectrogram covering on average 10″ across the galaxy, and the spectral direction including the Ly1216Å line location, as well as the continuum emission, up to or beyond the Ciii]1907,1909Å emission (Le Fèvre et al. 2019). Our classification scheme identifies the position of the Ly line in this 2D spectrogram. Such scheme aims to divide galaxies with Ly in emission with respect to the their spatial properties as seen in the 2D spectra that were obtained with the VIMOS spectrograph. Our main classes are:
-
None, where there is no line emission detected in the 2D spectra, or the line is observed in absorption.
-
Coincident, where the total extent of the emission line coincides with the extent of the galaxy continuum.
-
Extended, where the total extent of the emission line is more extended than that of the galaxy UV continuum, but still centred on the continuum in the spatial direction.
-
Offset, where there is an offset in the spatial direction between the center of the emission line and the center of the UV continuum emission.
There are two additional classes that we use in this classification scheme. Single Line emitters, where there is only an emission line and no UV continuum flux is detected. Faint emitters, where there is no clear detection of an emission line in the 2D spectra making it impossible for it to be properly classified as one of the four main classes. Examples of each of the classes are shown in the left panel of Fig. 1.
Each class can be schematically represented by different modes of Ly escape from the galaxy. Coincident emission occurs when there is little to no scattering of the radiation and we observe the emission from its original regions. Extended emission is when there is significant scatter on the surrounding gas and we observe the halo around the galaxy. Offset emission can happen for one of two reasons, either there are two clumps/galaxies spatially offset from each other and one is emitting Ly and the second is not or there is a single galaxy with an asymmetric gas/dust distribution (potentially caused from stellar winds and/or supernovae explosions) from where the Ly photons preferentially escape from one side of the galaxy. If no emission is observed there is likely high dust contents or high density of neutral hydrogen preventing Ly from being observed in emission. Faint and single line emitters have low S/N in the line and continuum, respectively, and thus are purely observational classes. These are summarized in the right panel of Fig. 1.
3.1 Classification procedure
| Selection | Total | |||||
| All | 171 | 336 | 194 | 136 | 76 | 913* |
| 44 | 103 | 49 | 29 | 9 | 234 | |
| 43 | 85 | 34 | 38 | 11 | 211 | |
| 31 | 52 | 48 | 27 | 9 | 167 | |
| 32 | 64 | 41 | 31 | 26 | 194 | |
| 31 | 66 | 29 | 12 | 6 | 144 | |
| 30 | 71 | 41 | 32 | 14 | 188 | |
| 46 | 79 | 38 | 39 | 15 | 217 | |
| 31 | 59 | 51 | 37 | 27 | 205 | |
| 8 | 25 | 16 | 10 | 10 | 69 | |
| 28 | 78 | 49 | 18 | 13 | 186 | |
| 46 | 90 | 48 | 36 | 17 | 237 | |
| 72 | 115 | 59 | 59 | 22 | 327 | |
| 70 | 69 | 18 | 4 | 1 | 162 | |
| 29 | 84 | 48 | 8 | 4 | 173 | |
| 20 | 60 | 52 | 33 | 4 | 169 | |
| 13 | 47 | 43 | 70 | 47 | 220 | |
| *The missing galaxy that is not included in our analysis is a single line emitter at . | ||||||
In order to carry out the individual visual classification of the 4360 spectra (corresponding to 4192 individual galaxies) a total of 10 collaborators inspected the data set. The sample was divided in 20 data packages of 218 targets each and then each volunteer was assigned 4 different data packages. We distributed each data package ensuring that each is analysed by a different pair of observers, i.e. for each set of 218 spectra we have results from a different pair of collaborators. This was done in order to minimize personal bias in the final classification. Each person then used an interactive tool developed within the VUDS collaboration to carry out the classification.
One problem that may affect our results is the surface brightness limit of our observations that can prevent lower surface brightness emission halos to be seen in the 2D spectra and thus bias our classifications towards a higher fraction of coincident line emitters. Our qualitative separation into the different four classes should thus be interpreted as a classification of Ly line emission above our limiting surface brightness. This means that even if most galaxies have extended Ly halos (Wisotzki et al. 2016; Wisotzki et al. 2018; Leclercq et al. 2017, e.g.) there is a distinction between our bright extended emitters and the other class of low surface brightness halos (likely classified as coincident emitters in our study), with different underlying physical conditions likely being responsible for the observed difference in the Ly morphology. Wisotzki et al. 2016 found that when restricted to emission matching the spatial extent of the continuum (which is what effectively happens in our 1D extracted spectra), lower equivalent width galaxies have most of their flux in the surrounding halos. If that is the case, and combined with the UV-Ly size correlation, then we may expect that the coincident line emitters (being those with the lower values of , see Sect. 5.3.1) galaxies that do, in fact, include more extended Ly halos but at a surface brightness lower than our detection limit. This would mean that we are observing only the core component of Ly emission which matches roughly the continuum surface brightness profile (Leclercq et al. 2017, e.g.). We will discuss the effect of these considerations further in Sect. 6.
3.2 Classifier agreement
After the classification was done, we checked for the overall agreement between each pair of classifications for our entire sample. We have classifications for a total of 4192 galaxies, of which 84 have duplicate observations and thus 4 classifications (2 per observation). The summary of our results is shown in Fig 2. We note that we have agreement in the classification for 2833 () galaxies of which 914 have Ly in emission and 1919 have no line in emission. For the other 1359 galaxies, there is a disagreement for 797 (59%) on whether there is a line in emission or not and in most of the cases that happens when a team member chooses the Faint class and the other team member chooses no class. There are also a total of 562 galaxies for which there is an agreement on the existence of the emission line but there is a disagreement on the classification of the line. In the end, we have a sample of 914 galaxies with Ly in emission (LAGs) and for which we a have a high degree of certitude in the visual classification since both observers (or three out of four in duplicate objects) independently agreed on the same classification. We investigated if there was any redshift trend for galaxies for which we have no secure classification, and we find a constant fraction across the redshift range studied here.
This classification based on the qualitative presence of Ly in emission, rather than using the flux or equivalent width of the line, is expected to take into account the variety of possible configurations in the 2D spectrograms. The fraction of 32% [914/2833] of LAGs in the securely classified sample can be broadly compared to the fraction of LAEs in the same VUDS sample, as reported by Cassata et al. 2015, which varies from 10 to 25% for bright LAEs with Å from to . By definition of the classification performed here, LAGs include all LAEs but also include emitters with Å, hence the larger fraction of LAGs than LAEs. This is discussed further in the next sections.
4 Ly shapes
4.1 Statistics of Ly classifications
Considering the 914 LAGs with secure classifications for the line emission we find that about half of our sample () shows spatially coincident Ly in emission that is centred and within the 2D extend of the UV continuum. We find that about one fourth () of the LAG sample has extended Ly emission, has an emission line and the UV continuum is not seen, shows an emission that has a projected spatial offset with respect to the center of the 2D UV continuum, and finally is too faint to be classified. The number statistics of each sub-sample that we discuss in the following paragraphs as a function of redshift, stellar mass and line properties is summarized in Tab. 1.

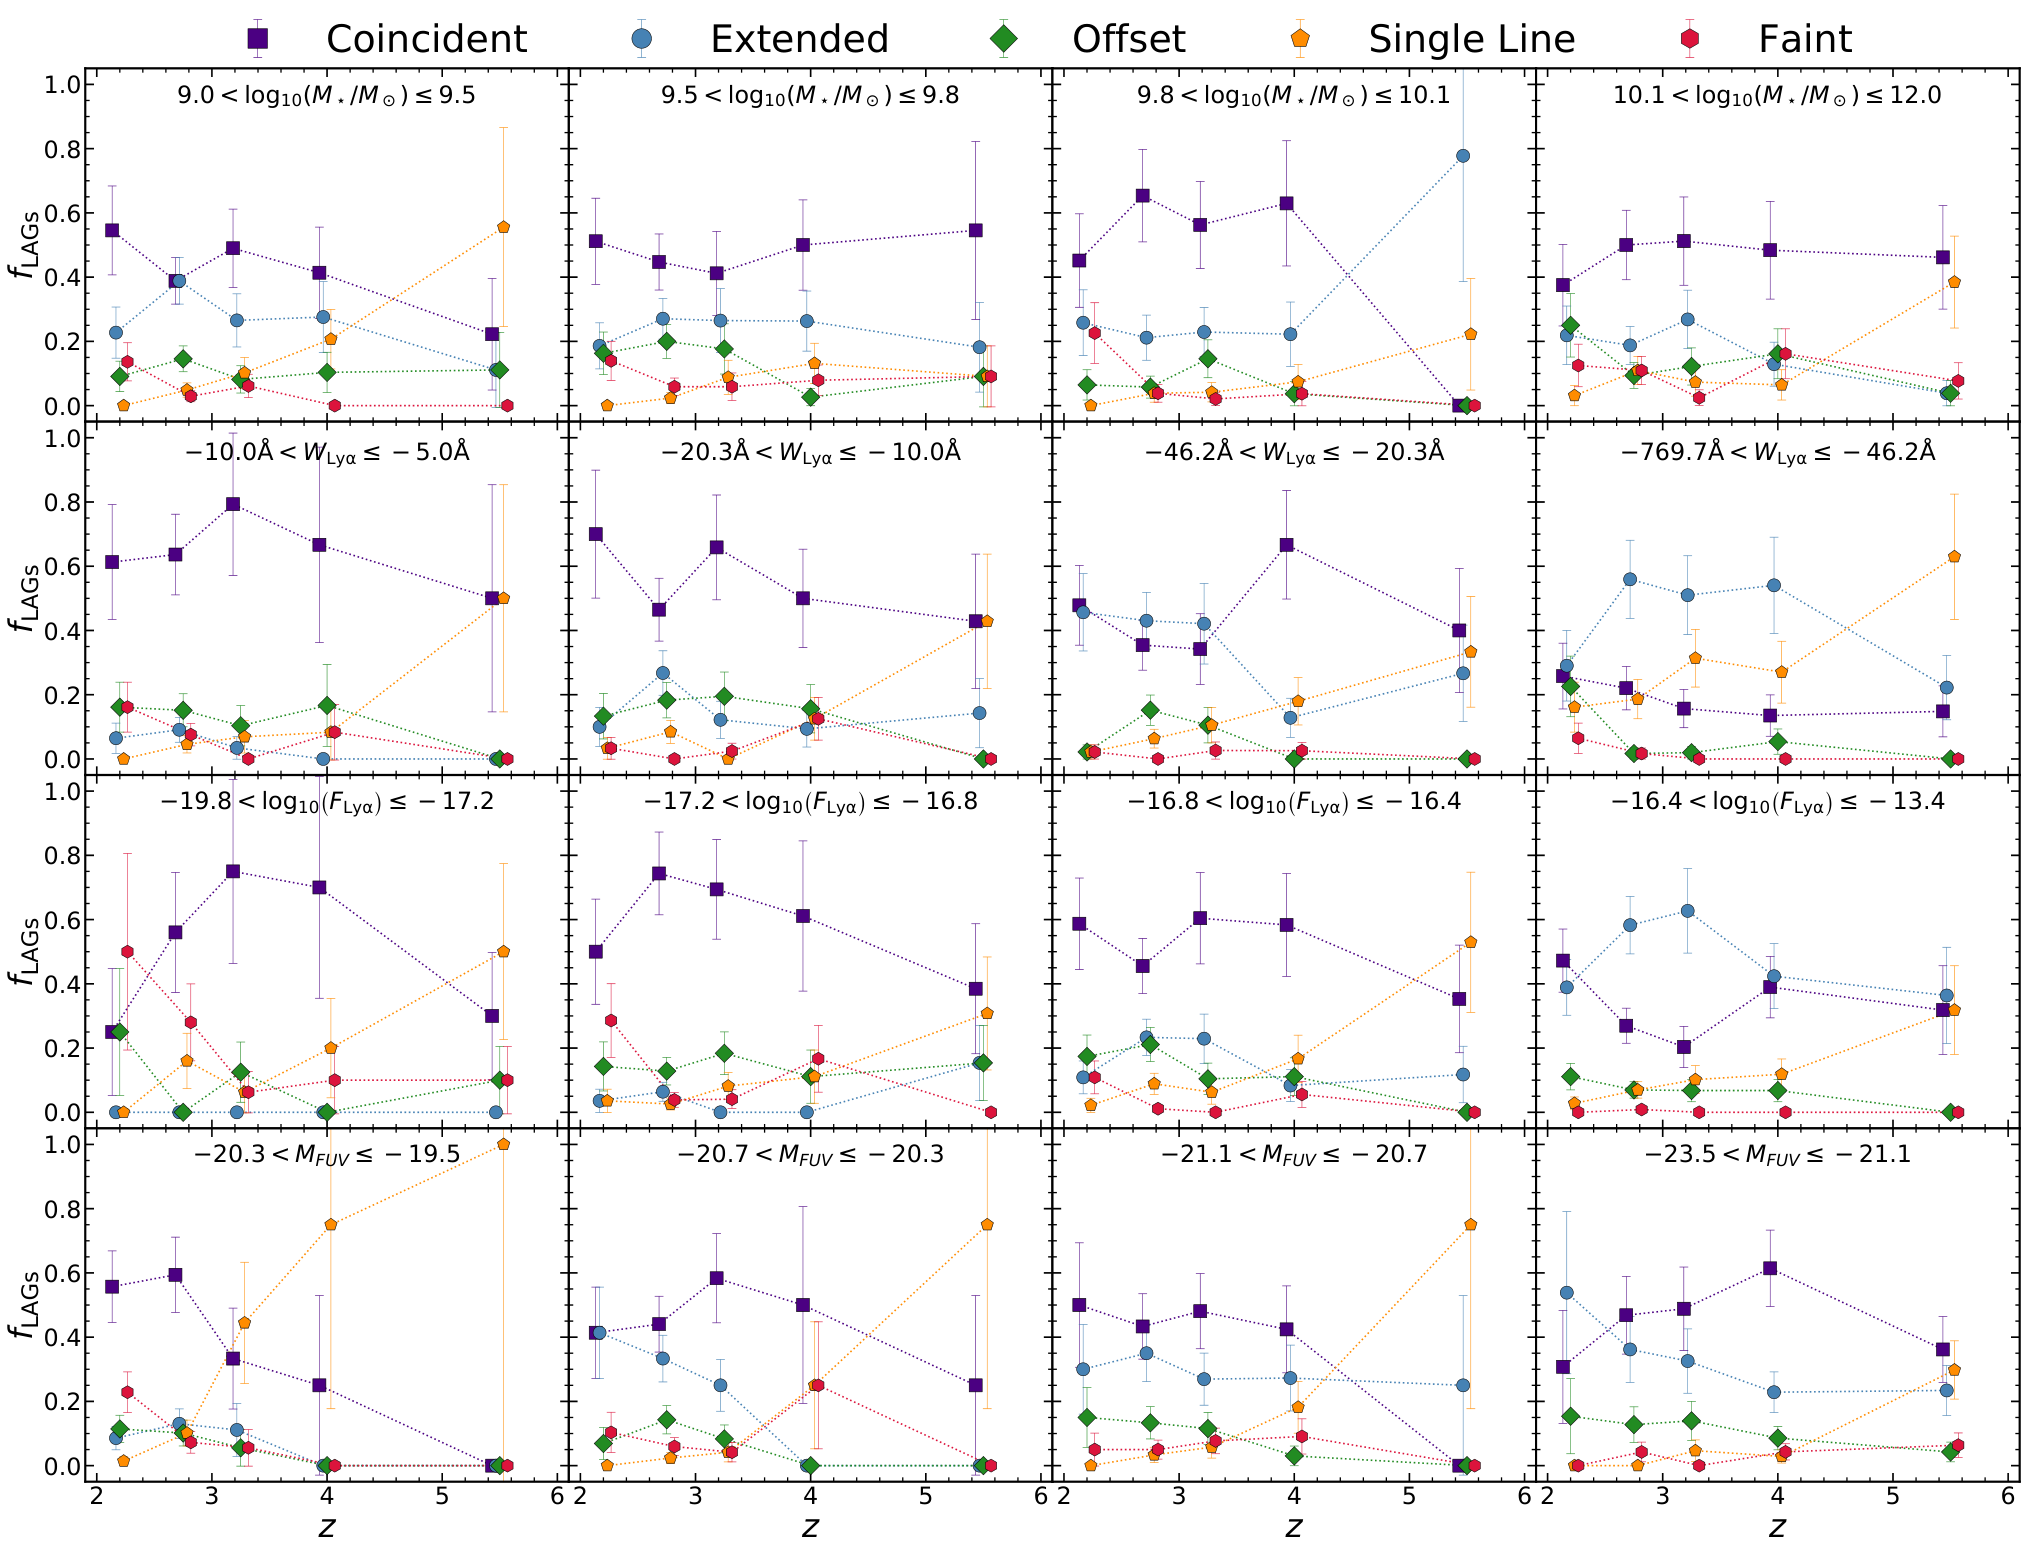
In Fig. 3 we show how these class fractions vary with redshift. We find that the class with coincident continuum and Ly emission dominates at , with fractions always above . At the most common cases are single line emitters. These show a strong increase in their fraction at high redshift, rising from at to at . This is caused by the increasing difficulty of detecting continuum in higher redshift galaxies, which naturally increases the number of single line spectra towards higher redshifts see e.g. dominance of single line emitter in UV faint galaxies in Fig. 4. The fraction of extended emission is the second most frequent case at and it shows an almost constant fraction around at any redshift. Faint and offset line emitters show a decrease in their fractions as a function of redshift and are never above .
We divide further our sample in subsets based on their stellar-mass, line equivalent width and line flux in Fig. 4. For each property we divide the sample in 4 sub-samples containing approximately 25% of the sample each (see Table 1). In terms of stellar mass, coincident Ly emitters dominate at every stellar mass at redshifts . At higher redshifts () single line, coincident, and extended emitters are the dominant population at different stellar masses.
In terms of line equivalent width, we can see an overall trend that higher equivalent width galaxies (Å) are the most common among extended and single line emitters, while coincident line emitters dominate at lower equivalent widths (Å). At intermediate values of , the dominant populations are coincident and extended emitters at lower redshifts () and single line, coincident and extended emitters at .
In terms of Ly flux, we find that at the faint end there is a large dispersion in classifications, with galaxies classified as having faint lines being significant (at ) as expected from its definition, and coincident galaxies are more common at . This is likely caused by the evolution of the continuum, with faint lines over a faint continuum being easier to classify as coincident due to the reduced contrast with the UV flux. At intermediate fluxes we find coincident line emitters to be clearly the dominant population at redshifts . At high Ly fluxes, we find extended emitters to be the most common population at , and coincident line emitters the second most common occurrence.
Finally, when dividing the sample in FUV absolute magnitude bins we find that UV-faint galaxies are dominated by single line emitters at and coincident line emitters at which is consistent with effects of cosmological surface brightness dimming preventing us from seeing the UV continuum at increasingly higher redshifts (see discussion in Sect. 3.1, and the trend for single line emitters in Fig. 3). For UV-bright galaxies ( mag) we find extended line emitters to be the most common at and coincident line emitters to be the second most common population at similar redshifts. At the highest redshifts () we find coincident, extended and single line emitters to have similar population fractions in our sample.
Galaxies with offsets in line emission are a sub-dominant population (% of the sample) across any studied property. Nevertheless, we do find them to be more common at low redshifts. They appear to be slightly more common in UV-bright galaxies, but are ubiquitous at any stellar masses and Ly derived properties.
4.2 Measuring spatial offsets from slit data
We estimate the offset, , between the Ly emission and the UV continuum centres by collapsing the 2D spectra along the wavelength direction in two windows: 1212-1225Å for Ly and 1240-1300Å for the continuum. The choice of wavelength interval for the extraction of the Ly spatial profile is compromise between maximizing the signal from the Ly line and minimizing the contamination form UV continuum emission. Before extracting the profiles, we masked all pixels that are close to prominent sky lines in the 2D spectra to avoid contamination. We then fit a Gaussian profile to the emission along the spatial direction and compute the offset distance as the absolute difference between the peaks of each Gaussian.
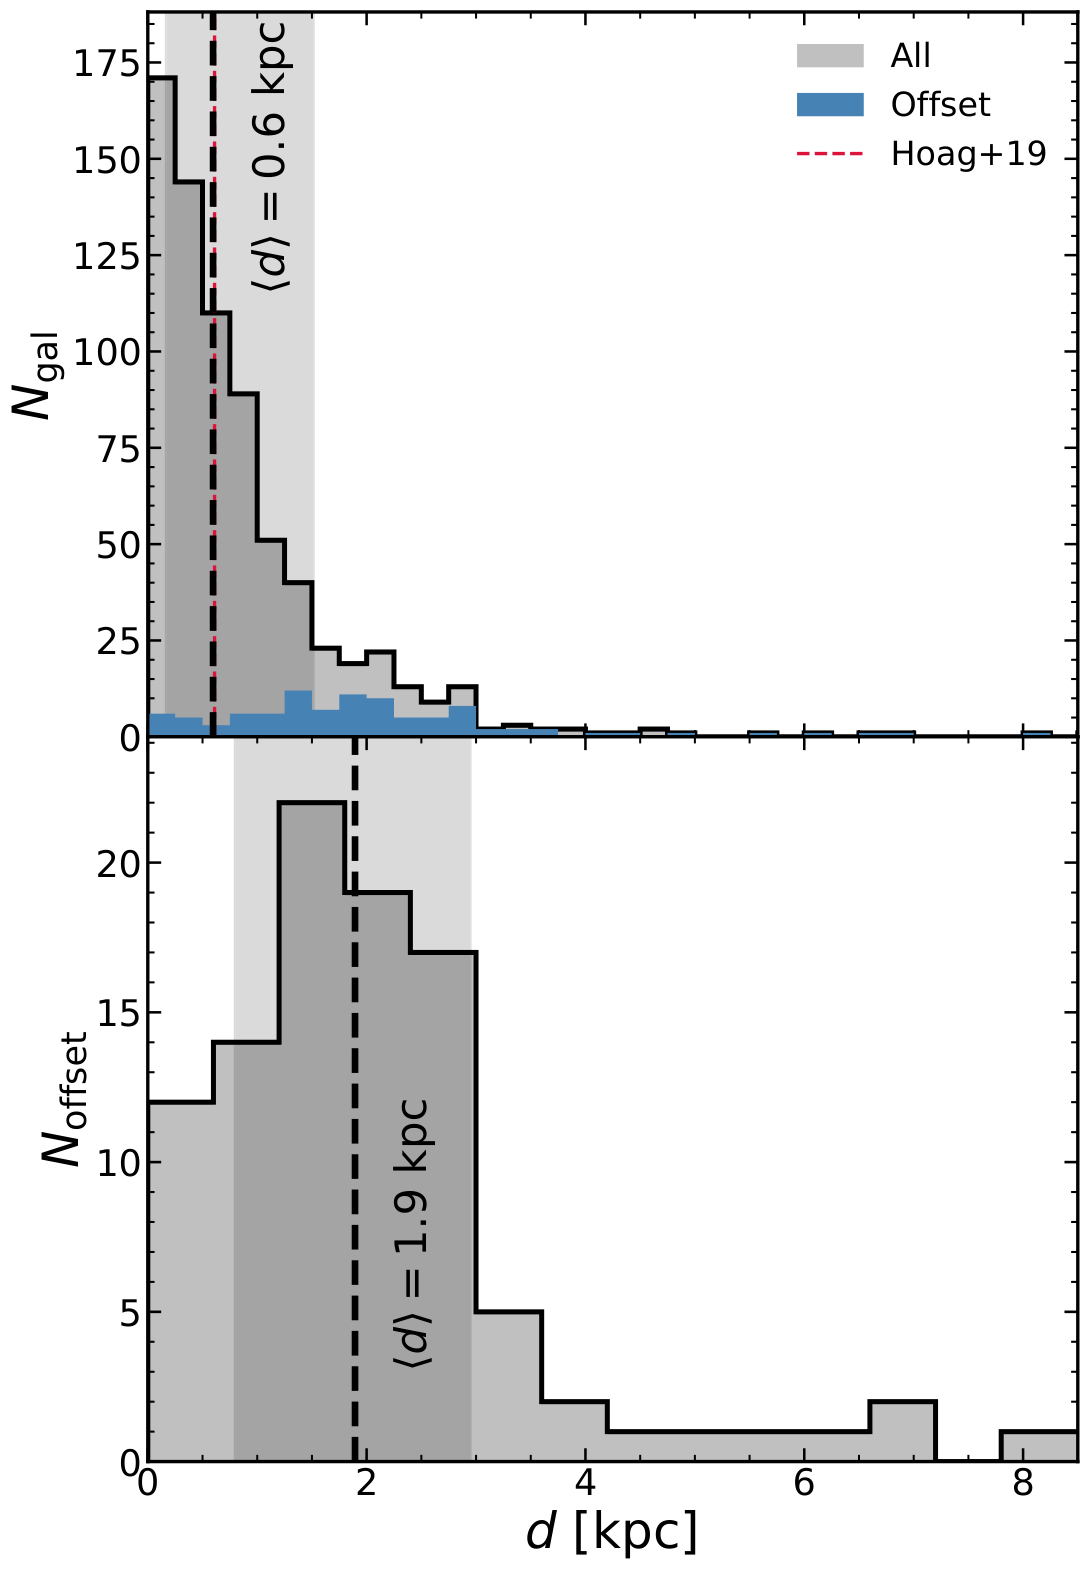
Considering our sample of offset emitters we find a median absolute physical separation of kpc (with 68% of the sample being between 0.8 kpc and 3.0 kpc), see Fig. 5. There is a recent study measuring the offsets from 2D spectra (Hoag et al. 2019, see), but there is no fair comparison that can be directly made to our sample of offset emitters due to selection bias and method disparities. To compare the two samples fairly, we computed the offset in Ly for all galaxies securely classified with a line (includes coincident, extended and offset classes) and we find a median offset of kpc, which is remarkably close to what is reported from the 1D separation of kpc from the Hoag et al. 2019 sample (see Fig. 5). When considering all secure line emitters, we also find a small evolution with redshift, with the median offset rising from kpc at to kpc at . These results are also consistent with the values derived by Lemaux et al. 2020 for a sample of galaxies at higher redshifts () and point to a non-significant evolution in the median offset since the epoch of re-ionization towards the peak of cosmic star-formation.
We find that the visual classification of offset emitters is complete for offsets larger than 1.5 pixel (3 kpc for the median redshift of the sample), and people classified objects with offsets down to separations of 0.5 pixels (1 kpc for the median redshift of the sample, albeit with higher incompleteness). This will mean that the observed distribution of offset distances (see Fig. 5 - bottom panel) will capture most large offsets but largely be incomplete for separations smaller than 3 kpc. Nevertheless, the existence of a tail extending towards larger distances is indicative of the possible existence of mergers among the offset emitters, combined with bright Ly clumps that are found at smaller offsets. We note that the incompleteness at low offset distances would only exacerbate the existence of the two scenarios, with a large concentration of small offsets for bright in-situ clumps combined with a larger tail for on-going merger events. This is consistent with the scenario described by Ribeiro et al. 2017 who studied the occurrence of bright UV clumps for the same parent sample.

5 Physical properties of Ly line morphology classes
5.1 SED derived parameters
We show in Fig. 6 the median values for stellar masses, SFRs, dust extinction and stellar age for the four main classes defined in Sect. 3. We first discuss the trends for the entire sample (left panels) and then focus on the results tracing the evolution in redshift (right panels).
When looking at the stellar masses it is clear that galaxies with no Ly emission and coincident emission tend to be slightly more massive (median of ) than galaxies with offset or extended emission (median of ). In terms of SFR, there is an interesting trend showing that the most star-forming galaxies have no Ly emission at any redshift. Coincident emission line galaxies are the second most star-forming population followed by offset and extended emission lines. The latter is the population with the lowest star-formation rate. This might be correlated with the average of each class, as other studies find an anti-correlation between SFR and Ly equivalent width (Kornei et al. 2010; Hathi et al. 2016; Pahl et al. 2020, e.g.). We note, however that among the classes of Ly emitters we find average SFRs consistent among each class which indicates that non-emitters have higher SFRs than Ly emitters (Marchi et al. 2019, as found by e.g. ).
Since the values for dust extinction and stellar age are derived from a grid of models, the median value is fixed at one of these grid values. Thus, we opt for the mean value for these two quantities in our interpretation. In terms of dust extinction it is clear that extended emission line galaxies are the ones with the least amount of dust. Then coincident and offset line galaxies are more dusty and the population with larger amounts of dust extinction is when no line emission is observed. In terms of stellar age we find that coincident line galaxies are likely the older population (but consistent with extended line emitters and to some extent offset emitters) and galaxies with no emission are on average the younger population. However, the differences of stellar ages among each class are not statistically significant and the more likely scenario is that all of the classes are comprised of relatively young galaxies with a considerable age spread.
In terms of the redshift evolution of the observed trends we show in the left panels of Fig. 6 the same quantities computed in three redshift bins. In terms of stellar mass there is a trend for higher stellar masses at higher redshifts for the four classes, it is likely the result of the VUDS sample selection function including a limiting magnitude at . The relative ratio of stellar masses between coincident and extended line emitters remains roughly constant with the latter being the least massive population. When looking at the median SFRs, the trends are broadly the same as found for the full redshift range with extended line emitters being the least star-forming population whereas galaxies with no line emission are the most star-forming.
We find again that at the extended line emitters have the least dust content and that dust content increases gradually to the offset, coincident and no line populations. We find no statistically significant differences in the mean age for each class. At the trends are not as strong but we still find, despite the error bars, that the extended line emitters have the lowest amount of dust. Interestingly, the dust attenuation in galaxies rapidly declines for for each class.
5.2 Ly escape from galaxies

We compute as a proxy of the Ly escape fraction the ratio of the SFR derived from SED fitting and those derived from the Ly luminosity. The Ly derived SFR is estimated assuming a case B recombination, in conditions that the intrinsic ratio between Ly and H is 8.7 (Lemaux et al. 2009; Hayes et al. 2011; Cassata et al. 2015; Matthee et al. 2016, e.g.). We then use the Kennicutt 1998 relation to derive (divided by a factor of 0.63 to correct for a Chabrier 2003 IMF, see e.g. Madau & Dickinson 2014).
We show in Fig. 7 the resulting median ratio for each class that has a detectable UV continuum. As expected, galaxies classified with no visible emission have this ratio equal to zero. We find a ratio of % for coincident and % for offset emitters. The extended class of emitters has a higher ratio of % . WE note that most of our emitters (excluding the Extended class) have a similar escape fraction to that computed for a field sample at by Lemaux et al. 2018. The latter higher observed escape fraction for extended line emitters is consistent with the higher equivalent width of this class of emitters (see also Sect. 5.3.1), as studies found these quantities to correlate with each other (Sobral et al. 2017; Verhamme et al. 2017; Sobral & Matthee 2019; Cassata et al. 2020, e.g.).
5.3 Composite spectra


To assess the average spectral properties we have produced composite spectra for each class defined in Sect. 3.
We combined all of the spectra by linearly interpolating individual spectra (normalized by the integrated flux over 1450-1500Å) onto a common grid of 1.5Å/pixel elements and then taking the median flux at each wavelength. We show the composite spectra in Fig. 8. Prior to combining the individual spectra, we refined our redshift estimates by cross-correlation of individual spectra to a master template of the sample (Tonry & Davis 1979; Hewett & Wild 2010; Talia et al. 2017, e.g.). In summary, we stacked every spectra with a secure classification to create a master template. Then we estimated the continuum using a 61 pixel median filter (Hewett & Wild 2010) and normalized the final template by this continuum. We then restricted our template spectra to the 1270-2050Å wavelength range. We note that this range includes both ISM absorption lines and Ciii] emission, to maximize the chance of aligning each spectrum. Since these are two different velocity components the re-fined spectrum will be weighted by the number of lines detected. And while we expect some broadening of the lines due to velocity differences of all the lines used in the master template, the centroid of each line should be robust. We repeated the same continuum estimation and wavelength restriction to individual spectra and clean the spectra with standard sigma-clipping () to remove noise spikes. Since we do not expect strong emissions and/or absorptions in the wavelength range considered, this automatic cleaning should not affect lines in the spectra. Finally, we computed the cross-correlation function, . We assumed a maximum shift of and computed the maximum of by fitting a quadratic function around the peak of (). We note that we apply our redshift correction to galaxies where to discard noisy cross-correlations (Hewett & Wild 2010, see e.g.). After correcting each individual spectra, we further refine them with a new master template re-computed from the new refined individual spectra. We repeated this procedure until we converged on a final list of redshifts.
For all subsequent analysis we use the wavelength regions which have more than 75% of the spectra contributing to that wavelength bin. With this constraint we cover the rest-frame range 1000-2000Å for all of the classes but one. The class of single line emitters is dominated by higher redshift objects and so the common range among different objects is smaller than for the other classes. The fitting procedure is described below and illustrated in Fig. 9.
To estimate the continuum level around emission and absorption lines we constructed a continuum function of wavelength by masking all regions around the lines (15Å around simple lines, 30Å around line doublets and the region 1170Å - 1220Å around Ly) and then smoothing the spectrum with a median filter of 25 pixels (corresponding to a kernel size of Å). We then used the continuum normalized spectra to compute line equivalent widths and velocity offsets from a set of different Gaussian models.
We fit each line with one of three different models, all based on Gaussian shapes. The first model is a single Gaussian function with three free parameters. The second model is the combination of two half-Gaussian functions each with its own width, and thus has four free parameters. Finally, the third model is a simple combination of two Gaussian functions, with a total of 6 parameters (of which only four are free since we fix the doublet separation and individual component widths to be the same). The half-Gaussian model is used for the Ly emission line. The double Gaussian model is used for the Ciii], Siv and Aliii doublets. The other lines are fitted with a simple Gaussian.
We assume that the systemic velocity of each composite spectra is that of the CIII]1909 emission line, which should trace nebular emission in Hii regions around star-forming regions (Talia et al. 2017, see e.g.). We could potentially use the photospheric absorption Ciii1176 but we find it to be strongly affected by the Ly red absorption wing which complicates the measurement of the systemic redshift in this line.
5.3.1 Line equivalent widths
We show in Fig. 10 the line equivalent widths for all of the lines listed in Table 2 that are present in the composite spectra. Galaxies with no emission have a significant absorption in Ly with an equivalent width of Å. For faint emitters, we observe Ly to have low equivalent widths (Å), as expected from their definition. Single line emitters show the strongest Ly equivalent width (Å), also expected due to the lack of a strong continuum detection on these sources. Galaxies with coincident and offset emission have equivalent widths of Å and Å, respectively. Galaxies which show an extended emission with respect to the continuum have Å. We expect the values for offset and extended emitters to be underestimated by 20% and 8% (see Sect. 2.3), yielding values of and Å, respectively.
For the other two emission lines seen in our composite spectra (Ciii] and Heii) we find that extended emitters are those showing strong emission also in these lines (especially in Ciii). The other classes show similar properties among themselves. This relation can be likely traced back to a tentative correlation between equivalent widths in Ly and Ciii] (Guaita et al. 2017; Le Fèvre et al. 2019, seen on stacks, see also).
Low ionization interstellar medium (ISM) absorption lines are on average stronger for galaxies with no Ly in emission and progressively weaker for faint, offset, coincident and extended line emitters. This trend is inverted with respect to Ly equivalent width which is likely the explanation for these differences among different classes, as there are several reports on the existence of weaker low ionization ISM absorption lines in stronger Ly emitters (Shapley et al. 2003; Jones et al. 2012; Jones et al. 2013; Leethochawalit et al. 2016; Pahl et al. 2020, e.g). Higher ionization ISM lines show no strong correlation on the class of emitters.

5.3.2 Velocity offsets
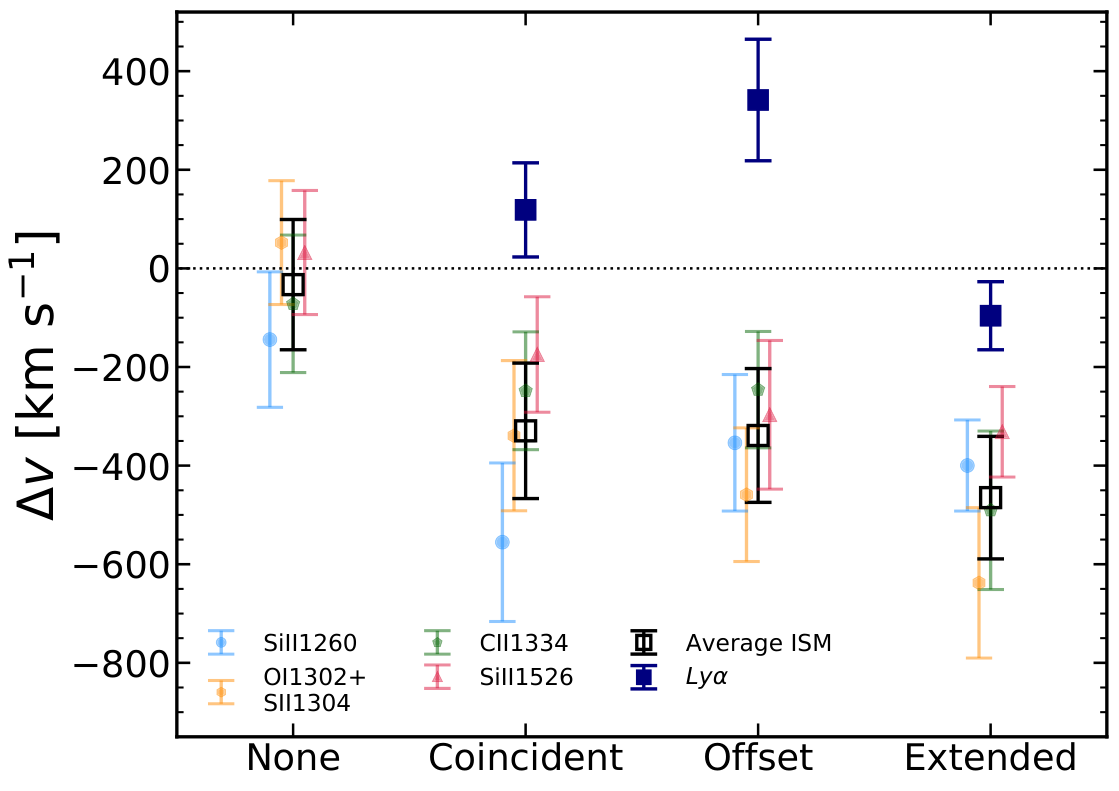
In Fig. 11 we show the velocity offsets of the blue emission peak of Ly and of low ionization ISM lines with respect to the CIII]1909 emission, assumed here as a tracer of the systemic velocity. We find that galaxies with no Ly emission have an average velocity offset of which is roughly consistent with star-forming galaxies at similar redshifts (Shapley et al. 2003; Vanzella et al. 2009; Talia et al. 2012; Talia et al. 2017). Galaxies with Ly in emission show higher velocity offsets for the low-ionization lines () with non-significant differences among the different classes. The blue-shifted ISM lines with respect to Ciii], might be indicative. Coincident and extended Ly emission galaxies show similar differences in velocity between Ly and low ionization lines despite having different equivalent widths in Ly, in agreement with other studies (Shapley et al. 2003; Jones et al. 2013; Marchi et al. 2019, see e.g.).
One interesting result is that for galaxies with offset Ly emission we find a larger difference between Ly and low ionization ISM lines velocity offsets. This is mostly driven by a red-shifted Ly emission with respect to Ciii]. We hypothesize that these offset regions that emit Ly are kinematically decoupled from the galaxy ISM. These regions have a typical spatial offset of kpc (see Sect. 4.2) which is similar to the observed median size for the same galaxies at these redshifts (Ribeiro et al. 2016, see also Fig. 5). The combination of these two quantities suggest that we are probably observing offset emission from a lopsided distribution of HI gas in the galaxy (e.g. infalling material along a filament, accretion of fainter satellite or a bright off-center star-forming clump). It might also be produced by inhomogeneous dust distribution alone, as we do not find difference in the ISM kinematics relative to the other classes of line emitters. Another possibility is if the observations were produced by gas scattering on the circum-galactic medium, but in this scenario we should expect to see larger average spatial offsets than what we find (as we do observe for individual galaxies, but it is not the dominant process).
5.4 The UV size of Ly emitting galaxies.
To compare the UV size of different classes of emitters, we use the size measurements detailed by Ribeiro et al. 2016 and briefly described in Sect. 2.2. We show in Fig. 12 the median sizes for each of the classes of Ly emission. Interestingly we do find that the extended line emitters have smaller UV extent than the other classes. The non-emitters are the largest in terms of the 50% light radius (both and ) but have similar sizes as the coincident and offset line emitters. We further explore the dependence of Ly emission on the UV rest-frame size in Fig. 13 where we show the fraction of LAEs, defined by using two Ly equivalent width cuts, as a function of the total extent of the UV rest-frame emission. We find that the smallest galaxies show the highest fraction of LAEs, regardless of the selection. This fraction is for galaxies with kpc and rises to for galaxies with kpc. We compare our results with those reported by Law et al. 2012a, where they find a similar behaviour. We note that they select as LAEs, any galaxy that has a visible Ly emission, which would translate to an equivalent width cut at 0Å. Interestingly we do find a small increase in the fraction of galaxies with Ly emission around kpc (with respect to the two adjoining bins), similar to what is reported by Law et al. 2012b. However, due to the small number of galaxies at these sizes it is likely that this bump is simply a statistical anomaly.
The results shown in Fig. 13 are correlated with what we observe in Fig. 12 concerning the UV sizes for each class. Extended emitters have the smallest UV sizes and are also the ones with the strongest line equivalent widths for Ly. Our results confirm the trend of smaller UV sizes for larger Ly equivalent width galaxies reported in the literature (Vanzella et al. 2009; Law et al. 2012a; Paulino-Afonso et al. 2018, e.g.). The prevalence of strong emitters at small UV sizes can also partially explain the difference in sizes of LAEs and LBGs or regular star-forming galaxies seen by recent studies at (Malhotra et al. 2012; Wisotzki et al. 2016; Paulino-Afonso et al. 2018, e.g.) as being due to the nature of LAE selection.


6 The physical nature of Ly emitters
We have defined a new classification system based on the extent of the Ly emission as compared to that of the UV continuum. We carried out our visual classification for a sample of objects with on the VUDS survey and compiled a sample of 914 galaxies with Ly in emission and 1919 with no emission line that have been identified in the same class by two different team members. We find that the most common case for line emitters is having coincident line and UV continuum emission () followed by extended line emitters () and then offset line emitters (). Other emitters have either a too faint continuum or line to be classified.
We find that extended line emitters are the least massive, least star-forming and have the lowest amount of dust extinction with respect to the other main classes. At the same time, it is the class for which the line equivalent width is the largest and the only one with continuum detection for which the stacked spectrum has an equivalent width high enough to be classified as a classical LAE. They also amount to 43% of all of the line emitting galaxies with Ly equivalent width Å making them the most likely population (along with single line emitters which amount to ) to be detected with narrow band surveys. These extended emitters are also the most compact, show the strongest Ciii] emission of all of the classes and have the largest Ly escape fraction, which are indications of a hard ionizing spectra. This hints that extended emitters are those more likely to be analogues of galaxies in the re-ionization epoch.
In terms of the physical properties of LAEs, we may expect that part of the observed differences is explained with the physical conditions that render their detection possible in different kinds of surveys. Selecting stronger equivalent width galaxies (as done in all narrow band surveys) produces a bias towards galaxies with bright extended Ly emission which we showed are the class of galaxies that have the strongest differences among our objects (Hathi et al. 2016, similar to those already reported by). On the other hand, our sample is primarily comprised of UV-selected objects and thus the observed differences are not as large as pure line surveys which can probe down to lower masses (Gawiser et al. 2007; Finkelstein et al. 2007; Guaita et al. 2011; Vargas et al. 2014, e.g.). We can argue that the differences among different studies are most likely due to the difference of continuum selection and line selection in the corresponding surveys, and that if we select galaxies based on optical emission lines (tracing e.g. SFR), both line emitter populations (Ly and optical) should show similar properties (Hagen et al. 2016, e.g.).
For what concerns the derived trend that larger galaxies have a lower fraction of Ly emitters, there is a possibility of biased measurements due to slit losses. This may happen since Wisotzki et al. 2016 found that the Ly extension scales with UV continuum size (Leclercq et al. 2017; Yang et al. 2017, see also e.g.) and therefore, larger galaxies are more likely to have extended Ly emission beyond the 1″ aperture of the slits. In our sample we use an equivalent width cut at Å which, as stated before, includes mostly extended and single line emitters. In turn, these galaxies are the ones with the smallest UV continuum sizes (see Fig. 12). Therefore we are confident that the trend we observe is real and not affected by slit loss problems since most of our strong emitters should have smaller UV sizes and consequently smaller Ly extension which would reduce the impact of such flux losses. It is possible that a differential surface brightness (SB) dimming effect, which would not affect the UV sizes (measured from deep imaging data) but affect (as measured from the spectra), which could produce a similar trend. However, we do not expect that to be the case since we expect a core Ly emission that has a similar profile shape as the UV continuum, and not a shallower profile which would more easily be affected by SB dimming (Leclercq et al. 2017). Also, the lower spatial resolution of VUDS 2D spectra also helps counterbalance any SB dimming effect, since in this case the SB per pixel is boosted by including photons from a larger physical area.
Our findings that galaxies with Ly emission are smaller than their non-emitting counterparts are consistent with most studies in the literature (Malhotra et al. 2012; Paulino-Afonso et al. 2018, e.g). However, we are able to show that there is a smooth trend from large to small galaxies where the fraction of strong line emitters increases (Law et al. 2012a). And this trend seems to be independent of the Ly equivalent width cut we impose, with smaller galaxies being more likely to show Ly emission.
6.1 Offset Ly emission
There is a possibility that the offset emission (observed in 10% of our line emitters’ sample) comes from a source in the foreground/background of the UV continuum source. However, there are two strong arguments against this possibility. One is the fact that the typical offset is 0.15″(see Sect. 4.2) and the probability of a serendipitous emission occurring at such distances is much smaller than the fraction of offset emitters we find. We expect to find only LAEs per arcsec2 brighter than assuming the detected number counts by Bacon et al. 2015. This would correspond to the detection of 2(5) serendipitous galaxies within a 0.15″radius for a sample of 4192 galaxies. This is an upper limit on the detection since we can only measure offsets along one spatial direction (East-West of the primary target). By imposing a minimum offset of 0.05″along that spatial direction the number of expected detections drops to 1(3) Ly. The other is the stacked spectrum for this offset class (see Fig. 8). If the detection was not at the same redshift as the continuum source for the majority of the offset sample, we would not detect other lines as the random nature of serendipitous detections would wash out all other lines from the stack.
Another possibility is that we are seeing emission from one Ly-bright clump offset from the galaxy center and produced by violent disk instabilities (VDI). Such instabilities are common in gas-rich high redshift galaxies where high surface densities lead to fragmentation under their own self-gravity to originate massive star-forming clumps (Elmegreen et al. 2004; Elmegreen et al. 2007; Genzel et al. 2006; Genzel et al. 2008; Dekel et al. 2009; Dekel & Krumholz 2013; Bournaud 2016, e.g.).
Finally, it is also possible that these offsets are indicative of merging systems for which a component is emitting Ly, while the other is not. From the fraction of mergers reported in the literature (Tasca et al. 2014; Ribeiro et al. 2017; Ventou et al. 2017, e.g.) we expect that among a sample of 914 galaxies, % would be involved in major merging. Nonetheless, we expect major merging to be a sub-dominant process since these offset emitters would need to be a combination of a non-emitting galaxy merging with a single line emitter (and thus a faint, likely low mass object) to match our definition. This is also bolstered by the distribution of separations between the Ly emission and the continuum, where most offsets are relatively small and not compared what one would expect for a major merging event. Thus, to explain the observed fraction of offset emitters as due to merging events, we would assume them to be of minor nature.
The combination of multiple processes driving galaxy evolution at high-redshift is consistent with the findings by Ribeiro et al. 2017 for the same parent sample. Such a combination of different mechanisms would likely produce two over-imposed distributions of offset distances. However, one would need a higher sample of offset Ly emitters to confidently constrain their existence and properties of each individual distribution. Therefore, the large spread in observed offsets in combination with the likely double Gaussian nature of its distribution (see Fig. 5) is compatible with the scenario where both disk instabilities and mergers are responsible for the observed offset distances distribution.
7 Summary
The results presented in this paper can be summarized as follows:
-
We have defined four different main classes of star-forming galaxies based on the spatial properties of the Ly emission as compared to the UV continuum emission. We find a total of 914 galaxies with line emission of which 45%, 24% and 11% have coincident, extended and offset line emission, respectively. We have also a sample of 1918 galaxies with no emission line at all.
-
Extended line emitters show the strongest equivalent widths. In fact, when considering all galaxies with Å, 41% of them are extended and are single line emitters. These are, by definition, the most common populations likely to be selected as LAEs in narrow-band imaging surveys.
-
In terms of physical properties, extended line emitters distinguish themselves from the other classes by being the least star-forming, with lower dust content and smaller UV continuum sizes. The extended emitters also show the strongest Ciii] emission and have likely the higher Ly escape fraction of all classes.
-
We find that the strength of the low ionization ISM lines is correlated with the value of of each class, with stronger absorptions for galaxies with no Ly emission.
-
We find that the UV size of galaxies correlates with the presence of Ly emission, with larger galaxies having a lower fraction of LAEs.
-
From the three main classes of LAGs, offset emitters show the largest velocity differences between the Ly emission and the low ionization ISM lines, driven mostly by a larger velocity offset of Ly with respect to the systemic velocity.
-
We find 11% of galaxies with offset Ly emission, with a median separation between the emission and the UV continum of kpc, and a likely double log-normal nature in the distribution of offset distances. This can be interpreted as a combination of on-going minor merger events or Ly-bright clumps within large galaxies.
We conclude that the extent of the line emission is linked to the physical properties of galaxies and that the largest Ly extent is likely coming from smaller, low-mass galaxies with little dust. Further investigation into this problem is required to confirm the extended nature of Ly emission in a larger sample by probing down to fainter surface brightness limits. It is likely that future and ongoing observations from large and deep spectroscopic surveys like VANDELS (McLure et al. 2018; Pentericci et al. 2018) and Integral Field Unit observations from MUSE/KMOS/JWST will help us understand more about the nature of Ly emission. Such surveys will place definitive constraints on the observational biases associated with the different classes presented here and will allow for the understanding of the underlying physical motivation for the differences that we report.
Acknowledgements.
This paper is dedicated to the life of Olivier Le Fèvre: a mentor both in science and in life. The first author will forever be grateful for the opportunity to pursue his scientific curiosity within such great collaboration led by him. This work is supported by funding from the European Research Council Advanced Grant ERC–2010–AdG–268107–EARLY and by INAF Grants PRIN 2010, PRIN 2012 and PICS 2013. This work is based on data products made available at the CESAM data center, Laboratoire d’Astrophysique de Marseille. This work partly uses observations obtained with MegaPrime/MegaCam, a joint project of CFHT and CEA/DAPNIA, at the Canada-France-Hawaii Telescope (CFHT) which is operated by the National Research Council (NRC) of Canada, the Institut National des Sciences de l’Univers of the Centre National de la Recherche Scientifique (CNRS) of France, and the University of Hawaii. This work is based in part on data products produced at TERAPIX and the Canadian Astronomy Data Centre as part of the Canada–France–Hawaii Telescope Legacy Survey, a collaborative project of NRC and CNRS. APA, PhD::SPACE fellow, acknowledges support from Fundação para a Ciência e a Tecnologia through the fellowship PD/BD/52706/2014 and the research grant UID/FIS/04434/2013. PC acknowledges support from the BIRD 2018 research grant from the Università degli Studi di Padova. This research made use of Astropy, a community-developed core Python package for Astronomy (Astropy Collaboration et al. 2013); Numpy & Scipy (Walt et al. 2011); an Matplotlib (Hunter 2007).References
- Acquaviva et al. (2012) Acquaviva, V., Vargas, C., Gawiser, E., & Guaita, L. 2012, ApJ, 751, L26
- Ahn et al. (2000) Ahn, S.-H., Lee, H.-W., & Lee, H. M. 2000, Journal of Korean Astronomical Society, 33, 29
- Astropy Collaboration et al. (2013) Astropy Collaboration, Robitaille, T. P., Tollerud, E. J., et al. 2013, A&A, 558, A33
- Atek et al. (2014) Atek, H., Kunth, D., Schaerer, D., et al. 2014, A&A, 561, A89
- Bacon et al. (2015) Bacon, R., Brinchmann, J., Richard, J., et al. 2015, A&A, 575, A75
- Behrens & Braun (2014) Behrens, C. & Braun, H. 2014, A&A, 572, A74
- Bond et al. (2009) Bond, N. A., Gawiser, E., Gronwall, C., et al. 2009, ApJ, 705, 639
- Bond et al. (2012) Bond, N. A., Gawiser, E., Guaita, L., et al. 2012, ApJ, 753, 95
- Bond et al. (2011) Bond, N. A., Gawiser, E., & Koekemoer, A. M. 2011, ApJ, 729, 48
- Bournaud (2016) Bournaud, F. 2016, Galactic Bulges, 418, 355
- Bouwens et al. (2004) Bouwens, R. J., Illingworth, G. D., Blakeslee, J. P., Broadhurst, T. J., & Franx, M. 2004, ApJL, 611, L1
- Bruzual & Charlot (2003) Bruzual, G. & Charlot, S. 2003, MNRAS, 344, 1000
- Calzetti et al. (2000) Calzetti, D., Armus, L., Bohlin, R. C., et al. 2000, ApJ, 533, 682
- Cassata et al. (2011) Cassata, P., Le Fèvre, O., Garilli, B., et al. 2011, A&A, 525, A143
- Cassata et al. (2020) Cassata, P., Morselli, L., Faisst, A., et al. 2020, arXiv e-prints, arXiv:2002.00967
- Cassata et al. (2015) Cassata, P., Tasca, L. A. M., Le Fèvre, O., et al. 2015, A&A, 573, A24
- Chabrier (2003) Chabrier, G. 2003, ApJ, 586, L133
- Cowie & Hu (1998) Cowie, L. L. & Hu, E. M. 1998, AJ, 115, 1319
- Dekel & Krumholz (2013) Dekel, A. & Krumholz, M. R. 2013, MNRAS, 432, 455
- Dekel et al. (2009) Dekel, A., Sari, R., & Ceverino, D. 2009, ApJ, 703, 785
- Dijkstra et al. (2006) Dijkstra, M., Haiman, Z., & Spaans, M. 2006, ApJ, 649, 14
- Dijkstra & Kramer (2012) Dijkstra, M. & Kramer, R. 2012, MNRAS, 424, 1672
- Duval et al. (2014) Duval, F., Schaerer, D., Östlin, G., & Laursen, P. 2014, A&A, 562, A52
- Elmegreen et al. (2007) Elmegreen, D. M., Elmegreen, B. G., Ravindranath, S., & Coe, D. A. 2007, ApJ, 658, 763
- Elmegreen et al. (2004) Elmegreen, D. M., Elmegreen, B. G., & Sheets, C. M. 2004, ApJ, 603, 74
- Erb et al. (2006) Erb, D. K., Shapley, A. E., Pettini, M., et al. 2006, ApJ, 644, 813
- Feldmeier et al. (2013) Feldmeier, J. J., Hagen, A., Ciardullo, R., et al. 2013, ApJ, 776, 75
- Ferguson et al. (2004) Ferguson, H. C., Dickinson, M., Giavalisco, M., et al. 2004, ApJL, 600, L107
- Finkelstein et al. (2011) Finkelstein, S. L., Cohen, S. H., Windhorst, R. A., et al. 2011, ApJ, 735, 5
- Finkelstein et al. (2013) Finkelstein, S. L., Papovich, C., Dickinson, M., et al. 2013, Nature, 502, 524
- Finkelstein et al. (2009) Finkelstein, S. L., Rhoads, J. E., Malhotra, S., & Grogin, N. 2009, ApJ, 691, 465
- Finkelstein et al. (2007) Finkelstein, S. L., Rhoads, J. E., Malhotra, S., Pirzkal, N., & Wang, J. 2007, ApJ, 660, 1023
- Fynbo et al. (2001) Fynbo, J. U., Møller, P., & Thomsen, B. 2001, A&A, 374, 443
- Garilli et al. (2010) Garilli, B., Fumana, M., Franzetti, P., et al. 2010, PASP, 122, 827
- Gawiser et al. (2007) Gawiser, E., Francke, H., Lai, K., et al. 2007, ApJ, 671, 278
- Gawiser et al. (2006) Gawiser, E., van Dokkum, P. G., Gronwall, C., et al. 2006, ApJ, 642, L13
- Genzel et al. (2008) Genzel, R., Burkert, A., Bouché, N., et al. 2008, ApJ, 687, 59
- Genzel et al. (2006) Genzel, R., Tacconi, L. J., Eisenhauer, F., et al. 2006, Nature, 442, 786
- Gronke et al. (2015) Gronke, M., Bull, P., & Dijkstra, M. 2015, ApJ, 812, 123
- Gronwall et al. (2011) Gronwall, C., Bond, N. A., Ciardullo, R., et al. 2011, ApJ, 743, 9
- Guaita et al. (2011) Guaita, L., Acquaviva, V., Padilla, N., et al. 2011, ApJ, 733, 114
- Guaita et al. (2015) Guaita, L., Melinder, J., Hayes, M., et al. 2015, A&A, 576, A51
- Guaita et al. (2017) Guaita, L., Talia, M., Pentericci, L., et al. 2017, A&A, 606, A19
- Hagen et al. (2014) Hagen, A., Ciardullo, R., Gronwall, C., et al. 2014, ApJ, 786, 59
- Hagen et al. (2016) Hagen, A., Zeimann, G. R., Behrens, C., et al. 2016, ApJ, 817, 79
- Hansen & Oh (2006) Hansen, M. & Oh, S. P. 2006, MNRAS, 367, 979
- Hao et al. (2018) Hao, C.-N., Huang, J.-S., Xia, X., et al. 2018, ApJ, 864, 145
- Harrington (1973) Harrington, J. P. 1973, MNRAS, 162, 43
- Hathi et al. (2016) Hathi, N. P., Le Fèvre, O., Ilbert, O., et al. 2016, A&A, 588, A26
- Hayes et al. (2007) Hayes, M., Östlin, G., Atek, H., et al. 2007, MNRAS, 382, 1465
- Hayes et al. (2005) Hayes, M., Östlin, G., Mas-Hesse, J. M., et al. 2005, A&A, 438, 71
- Hayes et al. (2010) Hayes, M., Östlin, G., Schaerer, D., et al. 2010, Nature, 464, 562
- Hayes et al. (2011) Hayes, M., Schaerer, D., Östlin, G., et al. 2011, ApJ, 730, 8
- Hewett & Wild (2010) Hewett, P. C. & Wild, V. 2010, MNRAS, 405, 2302
- Hoag et al. (2019) Hoag, A., Treu, T., Pentericci, L., et al. 2019, MNRAS, 488, 706
- Hunter (2007) Hunter, J. D. 2007, Computing In Science & Engineering, 9, 90
- Ilbert et al. (2013) Ilbert, O., McCracken, H. J., Le Fèvre, O., et al. 2013, A&A, 556, A55
- Jones et al. (2012) Jones, T., Stark, D. P., & Ellis, R. S. 2012, ApJ, 751, 51
- Jones et al. (2013) Jones, T. A., Ellis, R. S., Schenker, M. A., & Stark, D. P. 2013, ApJ, 779, 52
- Kennicutt (1998) Kennicutt, Jr., R. C. 1998, ARA&A, 36, 189
- Kimm et al. (2019) Kimm, T., Blaizot, J., Garel, T., et al. 2019, MNRAS, 486, 2215
- Kobayashi et al. (2016) Kobayashi, M. A. R., Murata, K. L., Koekemoer, A. M., et al. 2016, ApJ, 819, 25
- Koekemoer et al. (2007) Koekemoer, A. M., Aussel, H., Calzetti, D., et al. 2007, ApJS, 172, 196
- Koekemoer et al. (2011) Koekemoer, A. M., Faber, S. M., Ferguson, H. C., et al. 2011, ApJS, 197, 36
- Kornei et al. (2010) Kornei, K. A., Shapley, A. E., Erb, D. K., et al. 2010, ApJ, 711, 693
- Kulas et al. (2012) Kulas, K. R., Shapley, A. E., Kollmeier, J. A., et al. 2012, ApJ, 745, 33
- Kunth et al. (1998) Kunth, D., Mas-Hesse, J. M., Terlevich, E., et al. 1998, A&A, 334, 11
- Lai et al. (2008) Lai, K., Huang, J.-S., Fazio, G., et al. 2008, ApJ, 674, 70
- Lake et al. (2015) Lake, E., Zheng, Z., Cen, R., et al. 2015, ApJ, 806, 46
- Laursen et al. (2013) Laursen, P., Duval, F., & Östlin, G. 2013, ApJ, 766, 124
- Laursen et al. (2009) Laursen, P., Sommer-Larsen, J., & Andersen, A. C. 2009, ApJ, 704, 1640
- Law et al. (2012a) Law, D. R., Steidel, C. C., Shapley, A. E., et al. 2012a, ApJ, 759, 29
- Law et al. (2012b) Law, D. R., Steidel, C. C., Shapley, A. E., et al. 2012b, ApJ, 745, 85
- Le Fèvre et al. (2005) Le Fèvre, O., Guzzo, L., Meneux, B., et al. 2005, A&A, 439, 877
- Le Fèvre et al. (2019) Le Fèvre, O., Lemaux, B. C., Nakajima, K., et al. 2019, A&A, 625, A51
- Le Fèvre et al. (2015) Le Fèvre, O., Tasca, L. A. M., Cassata, P., et al. 2015, A&A, 576, A79
- Leclercq et al. (2017) Leclercq, F., Bacon, R., Wisotzki, L., et al. 2017, A&A, 608, A8
- Leethochawalit et al. (2016) Leethochawalit, N., Jones, T. A., Ellis, R. S., Stark, D. P., & Zitrin, A. 2016, ApJ, 831, 152
- Lemaux et al. (2020) Lemaux, B. C., et, & al. 2020, submitted
- Lemaux et al. (2018) Lemaux, B. C., Le Fèvre, O., Cucciati, O., et al. 2018, A&A, 615, A77
- Lemaux et al. (2009) Lemaux, B. C., Lubin, L. M., Sawicki, M., et al. 2009, ApJ, 700, 20
- Lidman et al. (2012) Lidman, C., Hayes, M., Jones, D. H., et al. 2012, MNRAS, 420, 1946
- Loeb & Rybicki (1999) Loeb, A. & Rybicki, G. B. 1999, ApJ, 524, 527
- Madau & Dickinson (2014) Madau, P. & Dickinson, M. 2014, ARA&A, 52, 415
- Malhotra et al. (2012) Malhotra, S., Rhoads, J. E., Finkelstein, S. L., et al. 2012, ApJL, 750, L36
- Marchi et al. (2018) Marchi, F., Pentericci, L., Guaita, L., et al. 2018, A&A, 614, A11
- Marchi et al. (2019) Marchi, F., Pentericci, L., Guaita, L., et al. 2019, A&A, 631, A19
- Martin & Sawicki (2004) Martin, C. L. & Sawicki, M. 2004, ApJ, 603, 414
- Matsuda et al. (2012) Matsuda, Y., Yamada, T., Hayashino, T., et al. 2012, MNRAS, 425, 878
- Matthee et al. (2018) Matthee, J., Sobral, D., Gronke, M., et al. 2018, ArXiv e-prints, arXiv:1805.11621
- Matthee et al. (2016) Matthee, J., Sobral, D., Oteo, I., et al. 2016, MNRAS, 458, 449
- McLure et al. (2018) McLure, R. J., Pentericci, L., Cimatti, A., et al. 2018, MNRAS, 479, 25
- Momose et al. (2014) Momose, R., Ouchi, M., Nakajima, K., et al. 2014, MNRAS, 442, 110
- Momose et al. (2016) Momose, R., Ouchi, M., Nakajima, K., et al. 2016, MNRAS, 457, 2318
- Morishita et al. (2014) Morishita, T., Ichikawa, T., & Kajisawa, M. 2014, ApJ, 785, 18
- Neufeld (1990) Neufeld, D. A. 1990, ApJ, 350, 216
- Neufeld (1991) Neufeld, D. A. 1991, ApJ, 370, L85
- Nilsson et al. (2011) Nilsson, K. K., Östlin, G., Møller, P., et al. 2011, A&A, 529, A9
- Oke & Gunn (1983) Oke, J. B. & Gunn, J. E. 1983, ApJ, 266, 713
- Ono et al. (2012) Ono, Y., Ouchi, M., Mobasher, B., et al. 2012, ApJ, 744, 83
- Östlin et al. (2014) Östlin, G., Hayes, M., Duval, F., et al. 2014, ApJ, 797, 11
- Östlin et al. (2009) Östlin, G., Hayes, M., Kunth, D., et al. 2009, AJ, 138, 923
- Ouchi et al. (2018) Ouchi, M., Harikane, Y., Shibuya, T., et al. 2018, Publications of the Astronomical Society of Japan, 70, S13
- Ouchi et al. (2008) Ouchi, M., Shimasaku, K., Akiyama, M., et al. 2008, ApJS, 176, 301
- Ouchi et al. (2010) Ouchi, M., Shimasaku, K., Furusawa, H., et al. 2010, ApJ, 723, 869
- Oyarzún et al. (2017) Oyarzún, G. A., Blanc, G. A., González, V., Mateo, M., & Bailey, John I., I. 2017, ApJ, 843, 133
- Pahl et al. (2020) Pahl, A. J., Shapley, A., Faisst, A. L., et al. 2020, MNRAS[arXiv:1910.04179]
- Paulino-Afonso et al. (2018) Paulino-Afonso, A., Sobral, D., Ribeiro, B., et al. 2018, MNRAS, 476, 5479
- Peng et al. (2002) Peng, C. Y., Ho, L. C., Impey, C. D., & Rix, H.-W. 2002, AJ, 124, 266
- Peng et al. (2010) Peng, C. Y., Ho, L. C., Impey, C. D., & Rix, H.-W. 2010, AJ, 139, 2097
- Pentericci et al. (2007) Pentericci, L., Grazian, A., Fontana, A., et al. 2007, A&A, 471, 433
- Pentericci et al. (2018) Pentericci, L., McLure, R. J., Garilli, B., et al. 2018, A&A, 616, A174
- Pirzkal et al. (2007) Pirzkal, N., Malhotra, S., Rhoads, J. E., & Xu, C. 2007, ApJ, 667, 49
- Quider et al. (2009) Quider, A. M., Pettini, M., Shapley, A. E., & Steidel, C. C. 2009, MNRAS, 398, 1263
- Rauch et al. (2008) Rauch, M., Haehnelt, M., Bunker, A., et al. 2008, ApJ, 681, 856
- Reddy et al. (2008) Reddy, N. A., Steidel, C. C., Pettini, M., et al. 2008, ApJS, 175, 48
- Rhoads et al. (2003) Rhoads, J. E., Dey, A., Malhotra, S., et al. 2003, AJ, 125, 1006
- Rhoads et al. (2000) Rhoads, J. E., Malhotra, S., Dey, A., et al. 2000, ApJ, 545, L85
- Rhoads et al. (2005) Rhoads, J. E., Panagia, N., Windhorst, R. A., et al. 2005, ApJ, 621, 582
- Ribeiro et al. (2017) Ribeiro, B., Le Fèvre, O., Cassata, P., et al. 2017, A&A, 608, A16
- Ribeiro et al. (2016) Ribeiro, B., Le Fèvre, O., Tasca, L. A. M., et al. 2016, A&A, 593, A22
- Rosdahl & Blaizot (2012) Rosdahl, J. & Blaizot, J. 2012, MNRAS, 423, 344
- Santos et al. (2020) Santos, S., Sobral, D., Matthee, J., et al. 2020, MNRAS, 493, 141
- Schaerer (2003) Schaerer, D. 2003, A&A, 397, 527
- Scodeggio et al. (2005) Scodeggio, M., Franzetti, P., Garilli, B., et al. 2005, PASP, 117, 1284
- Shapley et al. (2001) Shapley, A. E., Steidel, C. C., Adelberger, K. L., et al. 2001, ApJ, 562, 95
- Shapley et al. (2003) Shapley, A. E., Steidel, C. C., Pettini, M., & Adelberger, K. L. 2003, ApJ, 588, 65
- Shapley et al. (2006) Shapley, A. E., Steidel, C. C., Pettini, M., Adelberger, K. L., & Erb, D. K. 2006, ApJ, 651, 688
- Shibuya et al. (2016) Shibuya, T., Ouchi, M., Kubo, M., & Harikane, Y. 2016, ApJ, 821, 72
- Shibuya et al. (2014a) Shibuya, T., Ouchi, M., Nakajima, K., et al. 2014a, ApJ, 788, 74
- Shibuya et al. (2014b) Shibuya, T., Ouchi, M., Nakajima, K., et al. 2014b, ApJ, 785, 64
- Shimasaku et al. (2006) Shimasaku, K., Kashikawa, N., Doi, M., et al. 2006, PASJ, 58, 313
- Sobral & Matthee (2019) Sobral, D. & Matthee, J. 2019, A&A, 623, A157
- Sobral et al. (2017) Sobral, D., Matthee, J., Best, P., et al. 2017, MNRAS, 466, 1242
- Sobral et al. (2018) Sobral, D., Santos, S., Matthee, J., et al. 2018, MNRAS, 476, 4725
- Steidel et al. (2003) Steidel, C. C., Adelberger, K. L., Shapley, A. E., et al. 2003, ApJ, 592, 728
- Steidel et al. (2011) Steidel, C. C., Bogosavljević, M., Shapley, A. E., et al. 2011, ApJ, 736, 160
- Talia et al. (2017) Talia, M., Brusa, M., Cimatti, A., et al. 2017, MNRAS, 471, 4527
- Talia et al. (2012) Talia, M., Mignoli, M., Cimatti, A., et al. 2012, A&A, 539, A61
- Taniguchi et al. (2009) Taniguchi, Y., Murayama, T., Scoville, N. Z., et al. 2009, ApJ, 701, 915
- Tapken et al. (2007) Tapken, C., Appenzeller, I., Noll, S., et al. 2007, A&A, 467, 63
- Tasca et al. (2015) Tasca, L. A. M., Le Fèvre, O., Hathi, N. P., et al. 2015, A&A, 581, A54
- Tasca et al. (2014) Tasca, L. A. M., Le Fèvre, O., López-Sanjuan, C., et al. 2014, A&A, 565, A10
- Tasitsiomi (2006) Tasitsiomi, A. 2006, ApJ, 645, 792
- Thomas et al. (2017a) Thomas, R., Le Fèvre, O., Le Brun, V., et al. 2017a, A&A, 597, A88
- Thomas et al. (2017b) Thomas, R., Le Fèvre, O., Scodeggio, M., et al. 2017b, A&A, 602, A35
- Tody (1986) Tody, D. 1986, Society of Photo-Optical Instrumentation Engineers (SPIE) Conference Series, Vol. 627, The IRAF Data Reduction and Analysis System, ed. D. L. Crawford, 733
- Tody (1993) Tody, D. 1993, Astronomical Society of the Pacific Conference Series, Vol. 52, IRAF in the Nineties, ed. R. J. Hanisch, R. J. V. Brissenden, & J. Barnes, 173
- Tonry & Davis (1979) Tonry, J. & Davis, M. 1979, AJ, 84, 1511
- Trebitsch et al. (2017) Trebitsch, M., Blaizot, J., Rosdahl, J., Devriendt, J., & Slyz, A. 2017, MNRAS, 470, 224
- Tresse et al. (1999) Tresse, L., Maddox, S., Loveday, J., & Singleton, C. 1999, MNRAS, 310, 262
- van der Wel et al. (2014) van der Wel, A., Franx, M., van Dokkum, P. G., et al. 2014, ApJ, 788, 28
- Vanzella et al. (2009) Vanzella, E., Giavalisco, M., Dickinson, M., et al. 2009, ApJ, 695, 1163
- Vanzella et al. (2010) Vanzella, E., Grazian, A., Hayes, M., et al. 2010, A&A, 513, A20
- Vargas et al. (2014) Vargas, C. J., Bish, H., Acquaviva, V., et al. 2014, ApJ, 783, 26
- Venemans et al. (2005) Venemans, B. P., Röttgering, H. J. A., Miley, G. K., et al. 2005, A&A, 431, 793
- Ventou et al. (2017) Ventou, E., Contini, T., Bouché, N., et al. 2017, A&A, 608, A9
- Verhamme et al. (2012) Verhamme, A., Dubois, Y., Blaizot, J., et al. 2012, A&A, 546, A111
- Verhamme et al. (2017) Verhamme, A., Orlitová, I., Schaerer, D., et al. 2017, A&A, 597, A13
- Verhamme et al. (2006) Verhamme, A., Schaerer, D., & Maselli, A. 2006, A&A, 460, 397
- Walt et al. (2011) Walt, S. v. d., Colbert, S. C., & Varoquaux, G. 2011, Computing in Science & Engineering, 13, 22
- Wisotzki et al. (2016) Wisotzki, L., Bacon, R., Blaizot, J., et al. 2016, A&A, 587, A98
- Wisotzki et al. (2018) Wisotzki, L., Bacon, R., Brinchmann, J., et al. 2018, Nature, 562, 229
- Wofford et al. (2013) Wofford, A., Leitherer, C., & Salzer, J. 2013, ApJ, 765, 118
- Xue et al. (2017) Xue, R., Lee, K.-S., Dey, A., et al. 2017, ApJ, 837, 172
- Yamada et al. (2012) Yamada, T., Matsuda, Y., Kousai, K., et al. 2012, ApJ, 751, 29
- Yang et al. (2017) Yang, H., Malhotra, S., Rhoads, J. E., et al. 2017, ApJ, 838, 4
- Zheng et al. (2011) Zheng, Z., Cen, R., Weinberg, D., Trac, H., & Miralda-Escudé, J. 2011, ApJ, 739, 62
- Zheng & Miralda-Escudé (2002) Zheng, Z. & Miralda-Escudé, J. 2002, ApJ, 578, 33
- Zitrin et al. (2015) Zitrin, A., Labbé, I., Belli, S., et al. 2015, ApJ, 810, L12
Appendix A Composite spectra for all classes
This appendix summarizes the information on the composite spectra obtained for each class and the results from line fitting each spectra (see tables 2 and 3).
| Line | None | Faint | Coincident | Offset | Extended |
|---|---|---|---|---|---|
| Ly | |||||
| SiII1260 | |||||
| OI1302+SII1304 | |||||
| CII1334 | |||||
| SiII1526 | |||||
| SiIV1397 | |||||
| CIV1549 | |||||
| AlIII1856 | N/A | N/A | |||
| HeII1640 | N/A | ||||
| CIII1909 |
| Line | None | Coincident | Offset | Extended |
|---|---|---|---|---|
| Ly | ||||
| SiII1260 | ||||
| OI1302+SII1304 | ||||
| CII1334 | ||||
| SiII1526 | ||||
| Average ISM |