Kinematics of the isolated luminous infrared galaxy CIG 993Journal: ApJ
Abstract
We present scanning Fabry-Perot interferometric observations of CIG 993, an apparently isolated luminous infrared galaxy also exhibiting luminous blue compact and Wolf-Rayet galaxy features, as well as high star formation rate. Our high resolution observations of the H emission line allowed us to derive the radial velocity field, as well as the velocity dispersion , and the residual velocity fields of the galaxy. This galaxy exhibits several kinematical components. On one hand, the velocity gradients detected on the velocity field can be associated with a rotating disk -contrary to previous results with less spectral resolution-. However, the velocity field, the and residual velocity field show significant deviations from circular motions in the central part of the galaxy that matches a region with high number of Wolf-Rayet and O stars, coincident with the blue luminous component of the galaxy. We find narrow and broad velocity components for the ionized gas in the central part of the galaxy. The broad component is evidence of a central outflow related with the on-going burst of stellar formation. The morpho-kinematical analysis of the galaxy indicates we are only seeing the brightest parts of the galaxy which correspond to the bulge, a central bar and the beginning of the disk. We believe CIG 993 is a disk galaxy harboring important star-forming processes most likely caused by a relatively recent interaction. This could imply that small encounters could change the global characteristics of a galaxy without disturbing the main rotation disk motion, nor the morphology of the galaxy.
Keywords:
galaxies: individual (CIG 993), kinematics and dynamics, star formation, starburstI Introduction
Luminous Infrared Galaxies (LIRGs) are galaxies whose far infrared (FIR) emission is larger than the emission at all the other wavelengths combined, FIR luminosity lies between and (Sanders & Mirabel 1996). Although it seems clear that their FIR luminosities excess arises from the thermal heating of dust, the nature of the engine behind this heating has two main candidates: AGN activity, or an extreme star forming event, or a combination of both phenomena (Veilleux et al. 1995; Yuan et al. 2010; Alonso-Herrero et al. 2012).
In the Local Universe, Ishida 2004 found that of LIRGs with shows at least some evidence for tidal features and that of LIRGs with also tend to be disturbed.
Several works have shown that in the Local Universe, a high star formation rate (SFR) is primarily triggered by interactions or mergers (Kennicutt et al. 1987; Brassington et al. 2015). It can be said that there is a relation between current or past interactions and the LIRG phenomena. However, detailed multiwavelength studies of local LIRGs already identified that not all LIRGs show obvious evidence of interactions (Sanders & Mirabel 1996; Haan et al. 2011). These exceptions to the merger hypothesis may represent the end-stage of the merger after most of the obvious tidal features have disappeared, or an alternative way of producing LIGs, such as minor mergers and bar instabilities that will tend to drive star formation (Melbourne et al. 2008; Haan et al. 2011).
In order to identify the processes behind these galaxies we study the kinematics of one of them: an apparently isolated LIRG that has not experienced any interaction or merger and without detected nuclear activity. Isolated galaxy samples should provide the baseline for interpreting the high SFR in LIRGs that are not mergers, due to the fact that isolated galaxies are minimally affected by the environment (neighbor galaxies). In these sense, perhaps the best compilation of isolated galaxies available is the Catalog of Isolated Galaxies (Karachentseva 1973, CIG,) and the Analysis of the interstellar Medium of Isolated GAlaxies (Verdes-Montenegro et al. 2005, AMIGA,). The Karachentseva 1973 Catalog was original assembled with the requirement that no similar sized galaxies with diameter D (between 1/4 and 4 times diameter D of the CIG galaxy) lie within a radius of 20D, but some CIG galaxies have neighbors that were later identified by Verley et al. 2007 and Argudo-Fernández et al. 2013.
In this paper we focus on the optical kinematic properties of CIG 993. In Section 2, a brief bibliographical review on this galaxy is presented. The observations and data reduction are presented in Section 3. In Section 4, we present the derived velocity field, velocity dispersion field, emission profile decomposition, rotation curve of the galaxy, and the residual velocity field, paying special attention to the role of non-circular motions. In Section 5, we present a morphological analysis of the galaxy at different wavelengths. In Section 6, we discuss the link between galaxy properties at different wavelengths and the kinematic features. Finally, the conclusions are shown in Section 7. In this paper, we adopt km s-1 Mpc-1, , and .
II CIG 993
Left panel of Fig.1 shows CIG 993, also called Mrk 309, a spiral galaxy classified as Sa (de Vaucouleurs et al. 1991, hereafter RC3) and as Sc (Sulentic et al. 2006), with an heliocentic velocity of 12636 km s-1 (11). General parameters of the galaxy are shown in Table 1. Some other properties of the galaxy are summarized in the following subsections.
| Parameter | Value | Reference |
|---|---|---|
| Galaxy name | CIG 993, Mrk 309 | NEDaaThe NASA/IPAC Extragalactic Database (NED) is operated by the Jet Propulsion Laboratory, California Institute of Technology, under contract with the National Aeronautics and Space Administration. |
| RA (J2000) | NEDaaThe NASA/IPAC Extragalactic Database (NED) is operated by the Jet Propulsion Laboratory, California Institute of Technology, under contract with the National Aeronautics and Space Administration. | |
| DEC (J200) | NEDaaThe NASA/IPAC Extragalactic Database (NED) is operated by the Jet Propulsion Laboratory, California Institute of Technology, under contract with the National Aeronautics and Space Administration. | |
| Hubble Type | Sa | 11 |
| Sc | Sulentic et al. 2006 | |
| Nuclear activity | HII | Poggianti & Wu 2000 |
| Redshift | 0.042149 | 11 |
| Velocity | 12636 km s-1 | 11 |
| Distance | 183.9 Mpc | Fernandez et al. 2010 |
| Major axisbbMeasured up to 25.0 mag isophote in B-band | 11 | |
| Minor axisbbMeasured up to 25.0 mag isophote in B-band | 11 | |
| Poggianti & Wu 2000 | ||
| Lisenfeld et al. 2007 | ||
| Fernandez et al. 2010 | ||
| 6.7 | Poggianti & Wu 2000 | |
| 90.9 | Poggianti & Wu 2000 | |
| 54.52 | This work |

II.1 LIRG
CIG 993 is a LIRG because of its high FIR luminosity. In this work we follow the convention established in Sanders & Mirabel 1996, in which the FIR luminosity () corresponds to a spectral range between 40 - 500 . Lisenfeld et al. 2007 and Fernandez et al. 2010 reported for CIG 993 of and , respectively. Both groups used the Sanders & Mirabel 1996 equation to determine in the range between 40 - 500 , but the values differ because of the redshift determination distance (i.e. adopted value) and the method to derive flux density from the IRAS observations, Lisenfeld et al. 2007 derive flux estimation from the best fitting point source temperature and the maximum flux density within the signal range, while Fernandez et al. 2010 took the flux density from the IRAS Point Source Catalog.
Poggianti & Wu 2000 also derived the FIR luminosity but in the range of 42.2 to 122.5 using the Dennefeld et al. 1986 equation finding a FIR luminosity of .
II.2 Isolation
Although, CIG 993 is an isolated galaxy (Karachentseva 1973), 20 neighbor galaxies are reported in the vicinity of the galaxy according to the neighbors catalog of the AMIGA project (Verley et al. 2007). Only one neighbor lies within a radius of twenty times the diameter of CIG 993 having a similar size. This could be a background galaxy or a truly interacting neighbor, but because of the lack of redshift measurements this fact is unknown.
II.3 Nuclear Activity
In a spectroscopy study of galaxies with ultraviolet (UV) continuum, Afanas’ev et al. 1980 classified CIG 993 as a Seyfert 2 galaxy. Sabater et al. 2008 used the FIR color criterion (de Grijp et al. 1985) in which galaxies hosting an AGN have in general a flatter spectrum in FIR, to propose CIG 993 as an AGN candidate. However in the same article, Sabater et al. 2008 use the q-parameter (Helou et al. 1985) that relates the radio and the FIR emission, and according to this method, the galaxy is not an AGN. O’Halloran et al. 2005 also did IR diagnostics with ISO fluxes. Considering that the ratio of the 7.7 flux to the continuum level at this wavelength can provide a measure of the level of activity within the nucleus (Genzel et al. 1998), they concluded that CIG 993 hosts a compact burst of star formation and that an AGN is not required within the central burst (O’Halloran et al. 2005).
Other optical diagnostic tests by Osterbrock & Dahari 1983 and Poggianti & Wu 2000 concluded that CIG 993 is clearly an object in which the nuclear gas is photoionized by O stars. Following the previous results we assume that the galaxy does not host an AGN.
II.4 e(c) class
Poggianti & Wu 2000 did optical spectroscopy of CIG 993 and classified it as an e(c) (Dressler et al. 1999). The e(c) spectrum was identified because of its weak to moderate Balmer lines in absorption, an equivalent width (EW) of [O II] in emission shorter than and emission shorter than .
The e(c) spectra are similar to those in present-day spirals (Poggianti et al. 1999). However there is an alternative way of reproducing an e(c) spectrum: starbursts of sufficiently long duration (0.1 Gyr) can in their later phases mimic the e(c) classes. After an initial e(b) phase, in which the spectrum displays very strong emission lines associated with a galaxy that is undergoing strong star formation (Dressler et al. 1999), the starbursting galaxy displays an e(c) spectrum as long as the star formation continues (Poggianti et al. 1999).
II.5 Luminous compact blue galaxies (LCBGs)
According to Pisano et al. 2001 and Garland et al. 2004 criterion, CIG 993 is a LCBG because its absolute blue magnitude () is brighter than −18.5 mag in a effective radii of 4′′, its effective surface brightness is brighter than 21 mag arcsec-2 in the B band and its rest-frame - colour is bluer than 0.6 mag (Pérez-Gallego et al. 2011).
The LCBG class is mostly populated by a morphological mixture of starburst galaxies with a compact and highly ionized central zone (Garland et al. 2004). However Mallén-Ornelas et al. 1999 sample of LCBG can be identified with bright irregulars or late-type spirals.
II.6 Wolf-Rayet galaxy
A striking feature in the spectrum of CIG 993 is the presence of a broad emission band at a rest wavelength of (Osterbrock & Cohen 1982; Kunth & Schild 1986; Fernandes et al. 2004). They interpret this band as arising from the contribution in the integrated spectra of about Wolf-Rayet (WR) stars whose emission seem to come largely if not entirely from the center of the galaxy (Osterbrock & Cohen 1982; Fernandes et al. 2004). By using emission, Osterbrock & Cohen 1982, Kunth & Schild 1986 and Fernandes et al. 2004 concluded that CIG 993 hosts the same number of O stars than WR stars implying that a massive star formation episode must have occurred recently, about the time required for an O star to evolve to a WR star, roughly yr ago and over a time fairly short in comparison with this age (Osterbrock & Cohen 1982). This point will be discussed in Section VI.
II.7 Kinematics - Previous works
Pérez-Gallego et al. 2011 used three-dimensional optical spectroscopy observations to study the kinematics of CIG 993. Objects from the Pérez-Gallego et al. 2011 sample were observed using the PMAS spectrograph (Roth et al. 2005) in the PPAK mode (Kelz et al. 2006) at the Calar Alto 3.5-m telescope. The spectrum was centered at and included emission of the galaxy. The configuration used provided a nominal spectral resolution of FWHM ( km s-1 at ). Pérez-Gallego et al. 2011 derived the velocity field of this galaxy using different dithering positions and spatially binned the data (coadding fibres to achieve a minimum signal-to-noise of 13) in the outer area of the galaxy. CIG 993 was classified as a galaxy with complex kinematics, meaning that neither the velocity map nor the velocity width map are compatible with regular disk rotation. Those authors also found that the velocity map is misaligned by with the morphological major axis (Pérez-Gallego et al. 2011, Figure 4 in).
Additionally, Mirabel & Sanders 1988 and Fernandez et al. 2010 studied the HI profile of CIG 993 at a resolution of 8.3 km s-1 and 23.8 km s-1, respectively. Both used the Arecibo Observatory 305m radio telescope and found that CIG 993 profiles are asymmetric. In their works, these authors suggested that asymmetric profiles can be due to dynamical disruptions of the disks of spiral galaxies, due to interactions. However, Espada et al. 2011 found a lack of a strong correlation between and asymmetric HI flux in the AMIGA sample, i.e., that induced star formation caused by possible interactions in the AMIGA sample is small compared to that from secular evolution. Still, there is an excess of about 10% of asymmetric profiles for the LIRGs in that sample. This might be linked to recent accretion events in a small number of CIG galaxies (Espada et al. 2011).
III Observations and Data Reduction
Observations of CIG 993 were done on November 2014 at the f/7.5 Cassegrain focus of the 2.1 m telescope at the Observatorio Astronómico Nacional of San Pedro Mártir (OAN-SPM), Mexico, using the scanning Fabry-Perot interferometer PUMA (Rosado et al. 1995). We used a Marconi 2 CCD detector, with a binning factor of four, resulting in a field of view of pixels with a spatial sampling of /pixel.
A filter, centered in and with a bandwidth of , was selected according to the recession velocity of the galaxy. We obtained one object interferogram with 48 channels and two calibration interferograms, producing velocity cubes of , with 180 s exposure time per channel, covering a full spectral range of or the equivalent of 945 km s-1 with a finesse of .
In order to calibrate the cube we used a neon lamp whose line was the closest to the redshifted nebular wavelength to scan the same 48 channels. These were later used for phase and wavelength calibration of the data cubes. Observational and instrumental parameters are listed in Table 2.
The data were processed using the ADHOCw11 1 The manual is available at www.astro.umontreal.ca/fantomm/Modedemploi/ADHOC_manuel.pdf (developed by J. Boulesteix) and IRAF22 2 IRAF is distributed by National Optical Astronomy Observatory, operated by the Association of Universities for Research in Astronomic, Inc., under cooperative agreement with the National Science Foundation. softwares. Standard corrections were done in each cube (like removal of cosmic rays, subtraction of bias, etc.).
The calibration in wavelength was fixed for each profile per pixel using the calibration cube. After the calibration of the raw data cube for which the surfaces of constant wavelength are paraboloids, the cube was converted to a Cartesian cuboid of 48 planes, each pixels separated by . Once the wavelength calibration was done, the OH sky lines were subtracted using as reference Fig. 13 from Osterbrock et al. 1996
| Parameter | Value |
|---|---|
| Instrument | PUMA |
| Size detector | |
| Image scale ( binning) | |
| Detector | Marconi 2 |
| Finesse () | |
| Order of interference | 317 for |
| Free spectral range () | (945.5 km s-1) |
| Spectral Resolution | (19.7 km s-1) |
| FP Scanning Steps | 48 |
Once this process was done, we obtained for each pixel an intensity value (counts) for each channel. The intensity profile found along the scanning process contains information about the monochromatic emission and continuum emission of CIG 993. The continuum was obtained by considering the mean of the 3 lowest intensities of the 48 channels. The monochromatic value for each panel was obtained by integrating the monochromatic profile. Both maps are shown in Fig. 1.
Finally, the velocity maps were derived by computing the barycenter of the profile for each pixel. We performed a spectral gaussian smoothing () and in order to get a sufficient signal-to-noise ratio on the outer parts of the galaxy we performed three spatial gaussian smoothings (), so that a variable resolution radial velocity map was built using less spatially and spectrally smoothed pixels for regions with an originally higher signal-to-noise ratio and more spatially and spectrally smoothed pixels for the outer parts of the galaxy (see left panel of Fig. 2)
Positional astrometry was performed by comparing the positions of the brightest stars in the Fabry-Perot field with the positions in the SDSS images and USNO catalog yielding maximum uncertainties in position of 0.5′′.

IV Kinematic Results
IV.1 Velocity Field
Left panel of Fig. 2 shows the velocity field (VF) of CIG 993. The largest velocity values are seen on south-southeastern side of the galaxy; the lowest velocity values are seen on the extreme of northern side, along with a region in the central parts of the galaxy that seems to lie perpendicular to the main axis of the galaxy indicated with region A in Fig.2. Globally, a velocity gradient is seen from low velocity values on the NW side of the galaxy to the SE side where large velocity values are seen. This type of gradient is associated with a rotating disk, the so-called ”spider diagram”. However, important contributions of both low and high velocities are seen in the central parts of the galaxy (regions A and B in left panel of Fig. 2). These will be discussed in the following sections. Also, in the NW side of the galaxy. a particular pattern of velocities is seen close to the NW tip of the galaxy. Instead of the usual velocity distribution associated with a rotating disk, the VF of CIG 993 shows a region (region E in left panel of Fig. 2) with larger velocities that the regions on one side and the other of the main axis of the galaxy (regions C and D). The velocity distributions seen in regions C and D correspond more to the spider diagram velocity distribution than the velocities in region E. The velocities along the apparent warp of the galaxy (region F) show no particular distribution other than the one that is expected on a spider diagram.
IV.2 Velocity Dispersion Field
The velocity dispersion, , for each pixel was computed from the H velocity profiles after correction from instrumental and thermal widths, 16.4 km s-1 and 9.1 km s-1, respectively. The latter value was estimated by assuming an electronic temperature of Te = 104 K (Spitzer 1978; Osterbrock 1989) in the expression =(kTe/mH)1/2. Assuming that all the profiles (instrumental, thermal, and turbulent) are described by gaussians, the velocity dispersion was estimated using . Right panel of Fig.2 shows the velocity dispersion field of CIG 993. The largest velocity dispersion values (160 km s-1) are seen for pixels in the central region and its surroundings, particularly along the minor axis of the galaxy (region A in Fig.2). The velocity dispersion values in the northern side of the galaxy are in average 20 km s-1 larger than those in the southern half, especially in region E.
IV.3 Emission Profiles
Figure 3 shows the emission profiles from different regions in CIG 993; all of them show the emission line. Inspection of the emission profiles of CIG 993 showed the presence of composite profiles in the central parts of the galaxy (panel (c) in Figure 3). The location of these profiles matches the region on the velocity dispersion map with the largest values (region A in Fig.2). The composite profiles in the central parts of the galaxy were fitted with a narrow and a broad gaussian components. Values for each component are given in Table 3. No composite profiles are seen on the northern or southern sides of the galaxy (panels (a) and (b) in Fig.2).

| Pixel | Preak | Center | Width | Height |
|---|---|---|---|---|
| [km s-1] | [km s-1] | [counts] | ||
| 1 | 1 | 12733 | 105 | 136 |
| (284,239) | 2 | 12603 | 402 | 80 |
| 2 | 1 | 12735 | 104 | 125 |
| (284,240) | 2 | 12612 | 413 | 83 |
| 3 | 1 | 12733 | 108 | 208 |
| (285,239) | 2 | 12622 | 389 | 109 |
| 4 | 1 | 12735 | 107 | 192 |
| (285,240) | 2 | 12624 | 393 | 113 |
| 5 | 1 | 12732 | 112 | 86 |
| (285,241) | 2 | 12627 | 421 | 58 |
| 6 | 1 | 12730 | 114 | 144 |
| (286,239) | 2 | 12646 | 315 | 75 |
| 7 | 1 | 12732 | 115 | 136 |
| (286,240) | 2 | 12636 | 352 | 77 |
IV.4 Rotation Curve
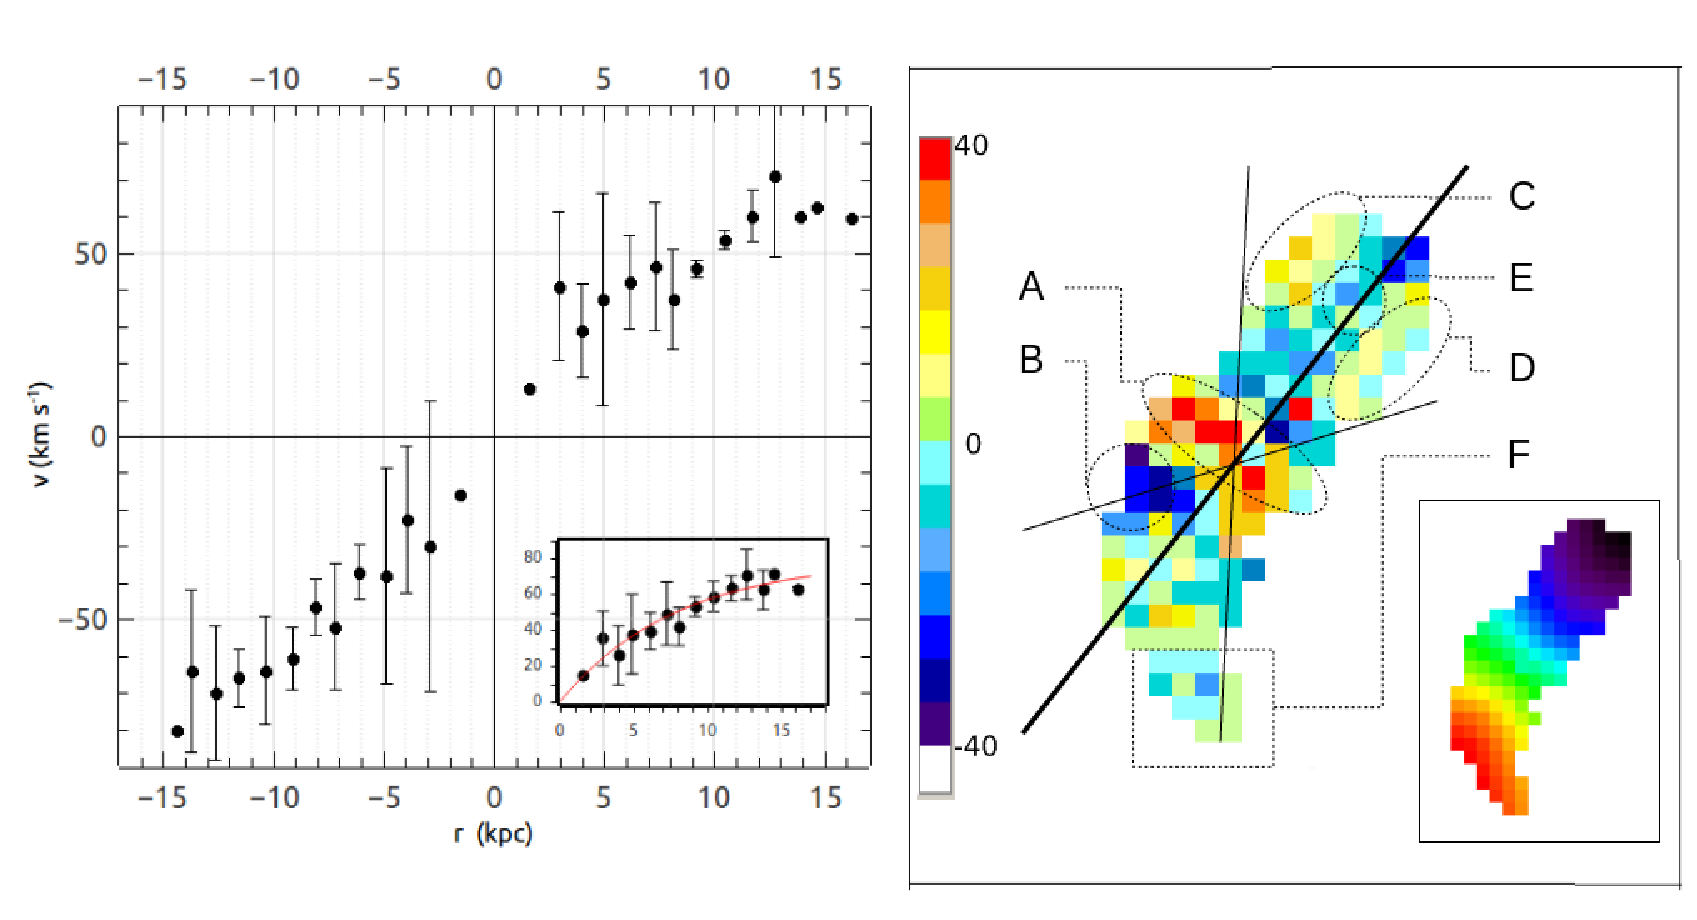
In Section IV.1, we pointed out the different velocity components of CIG 993 that do not seem to follow the rotation motion of a disk (regions A, B and E in Fig.2). Still, a global velocity gradient can be seen from one extreme of the galaxy to the other. We thus derived a rotation curve (RC) from the kinematics of the ionized gas of the galaxy. The RC of the galaxy is derived from the VF, which gives the projected velocity along the line of sight in each position of the galaxy. The RC of the galaxy was obtained with the ADHOCw software. In order to plot the RC, we obtained a velocity value at a radius by considering an elliptical ring of one pixel width () whose main axis equals and whose inclination matches the inclination of the galaxy disk. Considering the VF of CIG 993 is perturbed in different regions, we derived two RCs taking into account different considerations:
- 1.
Kinematic parameters were chosen in order to obtain a symmetric flat curve for all points on the VF inside a certain angular sector, and to minimize the scatter on each side of the curve. The following set of values was used: kinematical center (RA=, DEC=) -which matches the photometric center within (0.86 kpc)-, inclination angle of the galaxy and position angle of the major axis (PA=+322, measured from the north to the east). Additional parameters include the systemic velocity of the galaxy km s-1 and an angular sector of on each side of the major axis (see Fig 2). Only points within these sectors are considered for the derivation of the RC in order to reduce the dispersion. Uncertainties in the parameters were computed by varying each parameter and evaluating the symmetry and dispersion of the RC. The derived RC is shown in Fig.4. Table 4 summarizes these results. The maximum rotation velocity derived from these values is 80 km s-1. We shall call this RC, the “H RC”.
- 2.
Considering that the central parts of the galaxy are undergoing a strong starburst and that the profile decomposition in this region has shown the presence of large velocity dispersions and of two velocity components (Figs. 2 and 3), it might not be a reliable assumption to seek to symmetrize the inner parts of the galaxy in order to derive the RC. For this reason, we derived a second RC based on the parameters given by the K-band image (see bottom middle panel of Fig. 6) which traces the old stellar disk of the galaxy. The RC was then derived considering as kinematical center the photometric center of the K-band image (RA=, DEC=), and the inclination and P.A. were derived from the fit of an ellipse to the outermost isophotes of this image ( and PA=+333.5∘, respectively). The photometric center of the K band (see Fig. 6) is shifted 1 pix in the PUMA images (1.27 arcsec = 1.09 kpc) from the center used to derive the “H RC”. Fig.5 shows the RC derived with these assumptions. Table 4 shows these results. We shall call this RC, the “K-band RC”.
The inserts plotted in Fig. 4 and 5 show the global RC that was derived by averaging the velocities on both sides of the galaxy (approaching and receding sides) for a single radius in each case. The red line is the best fit using minimum chi-square estimation and the parametric function where A and b are constants. Their values are presented in Table 4.
The “H RC” is less dispersed on both sides of the galaxy than the “K-band RC”. Large error bars ( 46 km s-1) are seen for the “K-band RC” from 3 to 7 kpc for the receding side of the galaxy. The same occurs for the average RC, the average “K-band RC” shows larger error bars than the “H RC” up to 15 kpc. The fit of the average RCs show no significant difference for the value within the error bars. The turning point of the fitted RC, , is slightly shorter for the “K-band RC”.
| Parameter | RC | K-band RC |
|---|---|---|
| Systemic Velocity () | 12715 km s-1 | 12709 km s-1 |
| Inclination () | +58.5 | +68.8 |
| Position angle (PA) | +322 | +333.5 |
| Center (RA,DEC) | () | (, ) |
| Angular sector | ||
| AaaThe best fit using the parametric function | km s-1 | km s-1 |
| aaThe best fit using the parametric function |

IV.5 Model velocity map and residual velocity filed
The presence of non-circular motions within the galactic disk was explored by deriving the residual velocities map, which is obtained by subtracting a rotation model velocity field from the observed velocity field. This model is a two-dimensional projection of the analytical fit of the observed RC assuming there are only uniform circular motions in the plane of the galaxy (Fuentes-Carrera et al. 2004). These fields prove to be very useful to evaluate the validity of the parameters chosen to compute the rotation curve of a disk galaxy (Warner et al. 1973).
Using each RC, we derived the residual velocities field for CIG 993. These are shown in the right panels of Figures 4 and 5. In none of the residual velocity fields do we find a residual velocity pattern that could be related to an error in the determination of the kinematics parameters (Warner et al. 1973), so that the different velocities displayed in the galaxy correspond to actual non-circular motions of the gas. Both residual maps (right panel of Fig.4 and 5) show net residual velocities close to zero, mainly outside the 4 kpc central radius. Considering the spectral resolution of our observations (see Table 2), residual velocity values of 10 km s-1 can be considered close to zero, implying the predominance of circular motions in of the galaxy especially in the outer parts where ionized gas is detected. Important non-circular motions are seen in both residual velocity fields along the minor axis of the galaxy (region A). In the central region (inner 4 kpc), there are important velocity differences, that go from -37 to +43 km s-1 for the H residual velocity field, and from -38 to +75 km s-1 for the K-band residual velocity field These residual velocities could be associated with gas ejected from the active star formation in the central parts of the galaxy (Veilleux et al. 2005; Oparin & Moiseev 2015). For both maps, residual velocity values close to zero are seen in the SW tip of the galaxy (region E in Figures 4 and 5).
Though both residual velocity fields are quite similar, the residual velocity distribution seems less symmetrical for the K-based residual velocity field, especially regarding regions C and D, which have similar velocity values in both the VF and the dispersion velocity map (Fig. 2). The RC and residual velocity field that best describe the rotational motion of CIG 993 will be discussed in Section VI.
V CIG 993 in different wavelengths

Fig. 6 shows images of CIG 993 in different wavelengths in order to identify particular morphological features. The far and near ultraviolet (FUV and NIR) images from GALEX show bright emission in the central part of the galaxy. Emission is also seen in the northwestern part of the galaxy (see black circle in Fig. 6). This feature, which is also visible in the images (see Fig. 1), becomes less conspicuous as we move to redder wavelengths.
A central round-like ( 3 kpc in radius) bright region is seen in all bands (see white ellipse in Fig. 6). This feature could be associated with the bulge of the galaxy. It is also detected in the UV bands because of the central starburst and the LBCG nature of CIG 993. Fig.6 shows that the location of the photometric center remains almost constant from band to band. The green crosses in the images represent the photometric FUV center and blue crosses indicate the location of photometric center at each wavelength.
A broad elongated arc-like feature is seen on both sides of the bulge, especially on the DSS B-band image, the SDSS images, and the 2MASS J-band image. If this feature corresponds to the disk of CIG993, the southern side is more curved than the northern one, ressembling a warp.
ISO images at 7.7 and 14.3 are reported in Fig.1 of O’Halloran et al. 2005. The center is detected in both images. At low flux levels the 7.7 contours outline the disk of the galaxy, while the 14.3 is more compact, just like the WISE images.
VI Discussion
The VF of CIG 993 shows several kinematical components indicated with letters A to F in Fig.2, 4 and 5. These indicate the presence of non-circular motions in the central parts of the galaxy (regions A and B) and in the northwestern tip (region E), as well as circular motions implying disk-like rotation in regions C, D and F of the same Figure. This implies that CIG 993 does harbor “complex kinematics” as Pérez-Gallego et al. 2011 mentioned in their work, “embedded” in a field of rotational velocities which the spectral resolution of PUMA allows us to identify. Despite the Pérez-Gallego et al. 2011 results, we find that the velocity map is aligned with the morphological major axis.
Making use of this spectral resolution, we fitted the H emission profiles from the central region of the galaxy with a narrow and a broad components (see Fig. 3). The mean FWHM of the narrow and broad components are 109 km s-1 and 384 km s-1, respectively, which correspond to 42 km s-1 and 161 km s-1. The value of the narrow component is similar in average to the values found on the rest of the profiles on the galaxy (Fig.2). The broad component is most likely associated with an outflow from the strong SF in the central parts of the galaxy (inner 4 kpc). The presence of ionized gas outflows in LIRGs seems to be common based on the detection of an broad line (Arribas et al. 2014). The FWHM values of CIG 993 seem to be in the range of the values that Arribas et al. 2014 find for the broad components in that type of outflows. Those authors also point out that a central starburst is frequently associated with the presence of such ionized gas outflows. As previously mentioned, CIG 993 is classified as an LCBG and shows WR features in its central parts. In the same central region (see regions A and B in Fig. 2), there is an important velocity difference in the residual velocity field; the difference in residual velocities goes from -37 to +43 km s-1, covering of the observed galaxy (where the outflow is presumed to be). This reinforces the fact that the kinematics in the central parts of the galaxy are highly disturbed from those of a rotating disk as a result of the stellar winds coming from the central star-forming region. The ionized gas in the central parts of the galaxy is due to the combined influence of photoionization of young hot stars and shocks produced by stellar winds due to the on-going star formation.
Two RCs were derived for CIG 993 under different assumptions: the first RC (“H RC”) seeked to obtain the most symmetric and less dispersed RC from the kinematical information given by the VF; the second one (“K-band RC”) was computed using paramaters (center, and ) derived from the K-band image -which best traces the old stellar disk of the galaxy. The latter RC was derived in order to limit the effects of non-circular motions that the gas could have in the central parts of the RC due to the outflow detected in the VF, the map and the emission profile decomposition. A comparison of the RCs and of the associated residual velocity fields (Fig. 4 and 5) shows no major differences. However the “H RC” has less dispersion on both the approaching and receding sides than the “K-band RC”. Also, the resulting residual velocity field of the former is more symmetric and best represents the peculiar motions detected in both the VF and map (regions C, D, and E in Fig.2). For this reason, we consider the “H RC” as the RC that best describes the rotation motion of the galaxy; even though non-circular motions are important in the central parts of the galaxy. It is important to note that the regions associated with the outflow (regions A and B in Fig.2) fall mostly outside the sector considered to compute the RC in both cases. The adopted RC does not reach the flat part of the curve, but we estimated a maximum rotation velocity of 80 km s-1 by using the limit in the RC fit. The length of the curve is different for the approaching and receding sides, around 1 kpc larger for the approaching side. The points in region F in Fig.2 associated with the apparent warp follow the global behaviour of the RC and do not seem to be associated with any particular motion other than the rotation of the galaxy.
CIG 993 is a LIRG galaxy that does not harbor nuclear activity which means that all the luminosity is due to the star formation phenomena. Using the conversion between FIR luminosity () and star formation rate (SFR) given in (Kennicutt 1998), we find that CIG 993 has a SFR of 54.52 . This points to the starburst linked to the LCBG nature of the galaxy and the high number of WR and O stars in the galaxy. Although a LIRG event needs a high fraction of dust covering the star formation and one might think that the two properties, LIRG and LCBG, cannot coexist, it is not odd to find systems with high FIR and blue luminosity (Melbourne et al. 2005; Leitherer et al. 2013; Arribas et al. 2014) or WR stars and FIR luminosity properties (Armus et al. 1988). This seemingly paradoxical result is the consequence of their inhomogeneous ISM as Leitherer et al. 2013 suggest for LIRGs with important emission in UV band. CIG 993 shows most of the emission in the B-band in the central parts of the galaxy (inner 4 kpc). This is confirmed by the ultraviolet (GALEX), and (this work) images (left and central top panels in Fig.6 and right panel of Fig.1, respectively). Along with the WR features and the broad emission line component, this confirms the presence of a circumnucleur starbust in CIG 993. The profiles near the center of the galaxy are two to eight times brighter than the profiles in the rest of the galaxy. The profiles on the northern side of the galaxy have more counts than the profiles on the southern side, approximately 5 to 10%. This can also be seen in the number of counts in the right panel of Fig. 1. The profile width also changes: the profile width in the northern side of the galaxy is larger than that in the southern half The monochromatic H image shows a region of high H intensity in the northern part of the galaxy, besides the already mentioned central parts of the galaxy. This is probably a star formation region that is also visible in UV GALEX bands and optical images (Fig.6). In the velocity and residual map there is a peculiar distribution of velocities along the major axis in the north side of the galaxy that could be interpreted as non-circular velocities associated with strong stellar winds in the star-forming region (marked E in Fig.2 and 4). Unfortunately the S/N on these parts of the galaxy does not allow us to do a further decomposition of the H emission profiles.
CIG 993 shows several morphological and kinematical peculiarities. The apparent disk of the galaxy looks warped in optical (SDSS) and infrared (2MASS) images, but the residual velocity map does not show significant differences in velocity over the southwestern side of CIG 993 (values are actually close to zero). Kinematically, there is no indication of warping over the whole disk. Figure 7 shows the DSS B-band of the galaxy with isophotes corresponding to the faintest emission. The isophotes seem to trace an extended structure in the SW part of the disk, this feature looks like the beginning of an arm. A similar feature is seen from the isophotes on the composite SDSS image in Fig. 7. This extended feature to the SW of the galaxy is probably not seen in SDSS optical or NIR bands because of the size of the telescopes and the respective exposure times.
In order to explain the morpho-kinematics of CIG 993, we propose the following picture: we believe CIG 993 is similar to the SB(s)c Seyfert 2 galaxy NGC 7479 (UGC 12343). This galaxy has a very strong bar that dominates the surface profile with respect to the disk (Sánchez-Portal et al. 2004). NGC 7479 also shows strong HII regions at one end of the bar (Hernandez et al. 2005). The kinematics derived from FP scanning interferometry by Garrido et al. 2005 show that the velocities associated with the inner parts of NGC 7479 (within the inner ) slightly trace the rotation of the disk and that the amplitude associated to the RC in those inner parts corresponds to a fraction of the total Vmax of the galaxy -see their Figure A26. In the case of CIG 993, this would explain why the extension of the galaxy and the low rotation velocities do not seem to match; for a galaxy of such size and luminosity, higher velocities are expected. For CIG 993, considering the outermost isophotes of the DSS B-band and SDSS images leads to inclination values between and . These inclination values are considerably lower than those found in Section IV.4 which result in values from the RC between 71 km s-1 and 80 km s-1. Another way of inferring the inclination value for a galaxy is through the Tully-Fisher relation (TFR). Using the luminosity (i.e. magnitude) data and the HI profile width, one is able to derive the inclination of a disk galaxy. We used the TFR derived from 2MASS bands following the methodology of Masters et al. 2008 which gives inclination values between and for J and K bands, respectively. Using the TFR for the WISE bands with the methodology of Lagattuta et al. 2013, we find an inclination value of . These results argue for a more face on configuration than the one inferred from shallower images of the galaxy in other wavelengths, as a consequence, a different RC can be derived where the maximum rotation velocity varies from 85 km s-1 (considering ) to 126 km s-1 (considering ). Fig. 8 shows the RC taking into account the same values of the “H RC” except for the inclination value (). We do not find evidence of a different position angle. The extension of the RC seems quite small (less than 14 kpc) respect to the H and K-band RC and flatter than the other two.
Using this value for the inclination of the disk of CIG 993, the Fernandez et al. 2010 and Mirabel & Sanders 1988 results on the HI line width (220.5 km s-1 at 50% and 215 km s-1 at 20%), and the Bottinelli et al. 1980 formula that correlates them, we estimated a value of 183 km s-1. This value is 1.5 times larger than the one found with the optical RC. The difference between the values might be related to the fact that the TFR makes use of the HI information which is usually more extended than the information from the ionized gas. In particular for this galaxy, the ionized gas is confined to the central parts of the galaxy and the inner parts of the disk, thus the optical RC is tracing less mass than the HI RC. Also the flat part of the optical RC is not reached. Since neutral hydrogen emission can be detected over almost the entire radial extent of a spiral galaxy, 21-cm line data is a more powerful source of information on the kinematics and thus the dynamics of the galaxy as a whole, while the interferometric observations of the ionized gas give important information on the different kinematical components in the inner parts of CIG 993 where the outflows are being detected.
What we are probably observing in this case is the central parts of a galaxy similar to NGC 7479 but five times further away, so that only the bulge, the bar and the beginning of the disk -including one of the spiral arms- are seen. Contrary to CIG 993, NGC 7479 does not harbor a circumnuclear starburst, but is classified as a Sy2 galaxy. This could indicate that CIG 993 is in a previous stage in the evolution from a LIRG galaxy to an active galaxy as shown by several authors (Sanders et al. 1988; Hopkins et al. 2008, e.g.). CIG 993 is probably a late type spiral because of the high star formation rate, like the LCBG sample of Mallén-Ornelas et al. 1999, rather than Sa (RC3).


According to Armus et al. 1988 the high number of WR stars in relation to the number of O-type stars (inferred from the flux ratio of the and features) may argue against a continuous steady state star formation in CIG 993, and in favor of recent burst of star formation occurring approximately yr ago. On the other hand if the galaxy is isolated (according to the Karachentseva criterion) then it has a lower time limit for a possible past interaction, that is around yr. The fact that CIG 993 is classified as an e(c) galaxy imposes a lower time limit for the starburst duration of yr, as long as the SF continues, which is the case for this galaxy. The two last arguments point to a long star-forming process if induced by an interaction. Finally, the estimation of the number of WR stars in the galaxy might have been over-estimated because of an “artificial” widening of the emission profiles due to the central outflow in the galaxy. In such a case, a possible past interaction could have triggered the star formation in CIG 993 and originate the LIRG, LCBG, WR galaxy, dusty starburst, e(c) features, the asymmetrical HI profile (Fernandez et al. 2010) and the central outflow. Also, outflows have serious impact on the structure and chemical composition of the interstellar medium and mass distribution being also the primary mechanism by which dust and metals are distributed over large scales within the galaxy transferring the kinetic energy and starting the processes of star formation (Veilleux et al. 2005), as a consequence they contribute to the metal enrichment of the intergalactic medium. This scenario could explain the metallicity of in CIG 993 (Schaerer et al. 2000).
VII Conclusion
We present the kinematic analysis of the ionized gas of the galaxy CIG 993, using the scanning Fabry-Perot interferometer PUMA. Analysis of the velocity map reveals a gradient from northwest to southeast, indicating the presence of rotational motions in the galaxy. However important departures from circular motion in the central region of the galaxy are detected on the VF, the map and the residual velocity map of the galaxy. The spectral resolution of PUMA allowed us to decompose the H emission profiles in this region and identify both a narrow and a broad components. There is a strong concentration of H emission in the central zone of the galaxy where strong massive star formation is taking place, marked by high number of WR and O stars.
The broad band component could thus be associated with the presence of an outflow most likely related to the LBCG and e(c) nature of the galaxy, as well as the presence of WR features. In the north side of the galaxy there is a zone of high star formation where both the VF and residual velocities map indicate the presence of non-circular motions probably associated with stellar winds from young massive stars. The morphology of CIG 993 is difficult to define. The direct images in different bands indicate the presence of a bulge, a disk-like feature seen with a high inclination and a warp. However kinematically it is difficult to associate Vmax from the derived RC with the apparent size of the galaxy. Plus, the DSS B-band and SDSS composite color images show an interesting feature in the southwestern side of the disk (see Fig.6), where instead of a warp, the emission seems to trace the beginning of a spiral arm. We think that CIG 993 is most likely a galaxy similar to NGC 7479, an SBc galaxy with a very bright bar and HII regions both in the inner and outer parts of the galaxy. Since CIG 993 is located five times further away than NGC 7479, neither H emission or emission in other bands is detected from the underlying disk. The fact that we are only detecting ionized gas from the central parts of the galaxy results in a low velocity RC for different inclinations, centers and P.A. The present analysis shows that the structure of CIG993 is different when considering the fainter outer regions, revealing a more face-on galaxy. Authors as Davies 1973 have already mentioned the important of the outer regions in the determination of the axis ratio as well as the inclination of disk galaxies.
Although CIG 993 is an isolated galaxy, the AMIGA project found that about 92% of neighbor galaxies that show recession velocities similar to the corresponding CIG galaxy are not considered in the CIG neighbors catalog (Verley et al. 2007) because these neighbors are most likely dwarf systems, with less than a quarter diameter of the AMIGA galaxies’. However, interactions with this type of galaxies may have had considerable influence on the evolution of CIG galaxies (Argudo-Fernández et al. 2013). Additionally, the asymmetric HI profile reported by Mirabel & Sanders 1988 and Fernandez et al. 2010 might be linked to recent accretion events taking place between to yr ago (Osterbrock & Cohen 1982; Verdes-Montenegro et al. 2005). This results suggest a gravitational perturbation could have triggered the star formation responsible for the central outflow in CIG 993, as well as the LIRG, LCBG, WR galaxy, dusty starburst and e(c) features. If this is the case, this interaction -probably a small satellite accretion- did not leave either a morphological or kinematical imprint, but could still “ignite” long-lived SF events given the galaxy had enough gas supply and the correct encounter parameters.
References
- Afanas’ev et al. (1980) Afanas’ev, V. L., Lipovetskii, V. A., Markaryan, B. E., & Stepanyan, D. A. 1980, Astrophysics, 16, 119
- Alonso-Herrero et al. (2012) Alonso-Herrero, A., Pereira-Santaella, M., Rieke, G. H., & Rigopoulou, D. 2012, ApJ, 744, 2
- Arribas et al. (2014) Arribas, S., Colina, L., Bellocchi, E., Maiolino, R., & Villar-Martín, M. 2014, A&A, 568, A14
- Argudo-Fernández et al. (2013) Argudo-Fernández, M., Verley, S., Bergond, G., et al. 2013, A&A, 560, A9
- Armus et al. (1988) Armus, L., Heckman, T. M., & Miley, G. K. 1988, ApJ, 326, L45
- Begeman (1989) Begeman, K. G. 1989, A&A, 223, 4
- Bottinelli et al. (1980) Bottinelli, L., Gouguenheim, L., Paturel, G., & de Vaucouleurs, G. 1980, ApJ, 242, L153
- Brassington et al. (2015) Brassington, N. J., Zezas, A., Ashby, M. L. N., et al. 2015, ApJS, 218, 6
- Davies (1973) Davies, R. D. 1973, MNRAS, 161, 25P
- de Grijp et al. (1985) de Grijp, M. H. K., Miley, G. K., Lub, J., & de Jong, T. 1985, Nature, 314, 240
- de Vaucouleurs et al. (1991) de Vaucouleurs, G., de Vaucouleurs, A., Corwin, H. G., Jr., et al. 1991, Third Reference Catalogue of Bright Galaxies.
- Dennefeld et al. (1986) Dennefeld, M., Karoji, H., & Belfort, P. 1986, Star-forming Dwarf Galaxies and Related Objects, 351
- Dressler et al. (1999) Dressler, A., Smail, I., Poggianti, B. M., et al. 1999, ApJS, 122, 51
- Espada et al. (2011) Espada, D., Verdes-Montenegro, L., Huchtmeier, W. K., et al. 2011, A&A, 532, A117
- Fernandes et al. (2004) Fernandes, I. F., de Carvalho, R., Contini, T., & Gal, R. R. 2004, MNRAS, 355, 728
- Fernandez et al. (2010) Fernandez, M. X., Momjian, E., Salter, C. J., & Ghosh, T. 2010, AJ, 139, 2066
- Fuentes-Carrera et al. (2004) Fuentes-Carrera, I., Rosado, M., Amram, P., et al. 2004, A&A, 415, 451
- Garrido et al. (2005) Garrido, O., Marcelin, M., Amram, P., et al. 2005, MNRAS, 362, 127
- Garland et al. (2004) Garland, C. A., Pisano, D. J., Williams, J. P., Guzmán, R., & Castander, F. J. 2004, ApJ, 615, 689
- Genzel et al. (1998) Genzel, R., Lutz, D., Sturm, E., et al. 1998, ApJ, 498, 579
- Haan et al. (2011) Haan, S., Surace, J. A., Armus, L., et al. 2011, AJ, 141, 100
- Helou et al. (1985) Helou, G., Soifer, B. T., & Rowan-Robinson, M. 1985, ApJ, 298, L7
- Hernandez et al. (2005) Hernandez, O., Carignan, C., Amram, P., Chemin, L., & Daigle, O. 2005, MNRAS, 360, 1201
- Hopkins et al. (2008) Hopkins, P. F., Hernquist, L., Cox, T. J., Dutta, S. N., & Rothberg, B. 2008, ApJ, 679, 156
- Ishida (2004) Ishida, C. M. 2004, Thesis (PhD)
- Karachentseva (1973) Karachentseva, V. E. 1973, Soobshch. Spets. Astrofiz. Obs, 8, 72
- Kelz et al. (2006) Kelz, A., Verheijen, M. A. W., Roth, M. M., et al. 2006, PASP, 118, 129
- Kennicutt et al. (1987) Kennicutt, R. C., Jr., Roettiger, K. A., Keel, W. C., van der Hulst, J. M., & Hummel, E. 1987, AJ, 93, 1011
- Kennicutt (1998) Kennicutt, R. C., Jr. 1998, ARA&A, 36, 189
- Kunth & Schild (1986) Kunth, D., & Schild, H. 1986, A&A, 169, 71
- Lagattuta et al. (2013) Lagattuta, D. J., Mould, J. R., Staveley-Smith, L., et al. 2013, ApJ, 771, 88
- Lequeux (1983) Lequeux, J. 1983, A&A, 125, 394
- Leitherer et al. (2013) Leitherer, C., Chandar, R., Tremonti, C. A., Wofford, A., & Schaerer, D. 2013, ApJ, 772, 120
- Lisenfeld et al. (2007) Lisenfeld, U., Verdes-Montenegro, L., Sulentic, J., et al. 2007, A&A, 462, 507
- Mallén-Ornelas et al. (1999) Mallén-Ornelas, G., Lilly, S. J., Crampton, D., & Schade, D. 1999, ApJ, 518, L83
- Masters et al. (2008) Masters, K. L., Springob, C. M., & Huchra, J. P. 2008, AJ, 135, 1738
- Mirabel & Sanders (1988) Mirabel, I. F., & Sanders, D. B. 1988, ApJ, 335, 104
- Melbourne et al. (2008) Melbourne, J., Ammons, M., Wright, S. A., et al. 2008, AJ, 135, 1207
- Melbourne et al. (2005) Melbourne, J., Koo, D. C., & Le Floc’h, E. 2005, ApJ, 632, L65
- Nordsieck (1973) Nordsieck, K. H. 1973, ApJ, 184, 719
- O’Halloran et al. (2005) O’Halloran, B., McBreen, B., Metcalfe, L., Delaney, M., & Coia, D. 2005, A&A, 439, 539
- Oparin & Moiseev (2015) Oparin, D. V., & Moiseev, A. V. 2015, Astrophysical Bulletin, 70, 392
- Osterbrock (1989) Osterbrock, D. E. 1989, Research supported by the University of California, John Simon Guggenheim Memorial Foundation, University of Minnesota, et al. Mill Valley, CA, University Science Books, 1989, 422 p.,
- Osterbrock & Cohen (1982) Osterbrock, D. E., & Cohen, R. D. 1982, ApJ, 261, 64
- Osterbrock & Dahari (1983) Osterbrock, D. E., & Dahari, O. 1983, ApJ, 273, 478
- Osterbrock et al. (1996) Osterbrock, D. E., Fulbright, J. P., Martel, A. R., et al. 1996, PASP, 108, 277
- Pisano et al. (2001) Pisano, D. J., Kobulnicky, H. A., Guzmán, R., Gallego, J., & Bershady, M. A. 2001, AJ, 122, 1194
- Pérez-Gallego et al. (2011) Pérez-Gallego, J., Guzmán, R., Castillo-Morales, A., et al. 2011, MNRAS, 418, 2350
- Poggianti et al. (1999) Poggianti, B. M., Smail, I., Dressler, A., et al. 1999, ApJ, 518, 576
- Poggianti & Wu (2000) Poggianti, B.M. & Wu, H. 2000, ApJ, 539, 157
- Rosado et al. (1995) Rosado, M., Langarica, R., Bernal, A., Cobos, F., et al. 1995, Revista Mexicana de Astronomia y Astrofisica Conference Series, 3, 264
- Roth et al. (2005) Roth, M. M., Kelz, A., Fechner, T., et al. 2005, PASP, 117, 620
- Sabater et al. (2008) Sabater, J., Leon, S., Verdes-Montenegro, L., et al. 2008, A&A, 486, 73
- Sanders & Mirabel (1996) Sanders, D. B. & Mirabel, I. F. 1996, ARA&A, 34, 746
- Sanders et al. (1988) Sanders, D. B., Soifer, B. T., Elias, J. H., et al. 1988, ApJ, 325, 74
- Sánchez-Portal et al. (2004) Sánchez-Portal, M., Díaz, Á. I., Terlevich, E., & Terlevich, R. 2004, MNRAS, 350, 1087
- Schaerer et al. (2000) Schaerer, D., Guseva, N. G., Izotov, Y. I., & Thuan, T. X. 2000, A&A, 362, 53
- Spitzer (1978) Spitzer, L. 1978, Physical processes in the interstellar medium, by Lyman Spitzer. New York Wiley-Interscience, 1978. 333 p.,
- Sulentic et al. (2006) Sulentic, J. W., Dultzin-Hacyan, D., Marziani, P., et al. 2006, Rev. Mexicana Astron. Astrofis., 42, 23
- Veilleux et al. (2005) Veilleux, S., Cecil, G., & Bland-Hawthorn, J. 2005, ARA&A, 43, 769
- Veilleux et al. (1995) Veilleux, S., Kim, D.-C., Sanders, D. B., Mazzarella, J. M., & Soifer, B. T. 1995, ApJS, 98, 171
- Verdes-Montenegro et al. (2005) Verdes-Montenegro, L., Sulentic, J., Lisenfeld, U., Leon, S., Espada, D., Garcia, E., Sabater, J. & Verley, S. 2005, A&A, 436, 443
- Verley et al. (2007) Verley, S., Odewahn, S. C., Verdes-Montenegro, L., et al. 2007, A&A, 470, 505
- Warner et al. (1973) Warner, P. J., Wright, M. C. H., & Baldwin, J. E. 1973, MNRAS, 163, 163
- Wu et al. (1998) Wu, H., Zou, Z. L., Xia, X. Y. & Deng, Z. G. 1998, A&AS , 132, 181
- Yuan et al. (2010) Yuan, T.-T., Kewley, L. J., & Sanders, D. B. 2010, ApJ, 709, 884