The -Process Alliance:
J15213538, a very metal-poor,
extremely -process-enhanced star with , and the class of -III starsJournal: ApJThis paper includes data gathered with the 6.5 m Magellan Telescopes located at Las Campanas Observatory, Chile.
Based on observations obtained at the Gemini Observatory (Prop. IDs: GS-2015A-Q-205), which is operated by the Association of Universities for Research in Astronomy (AURA), Inc., under a cooperative agreement with the National Science Foundation (NSF) on behalf of the Gemini partnership: the NSF (United States), the National Research Council (Canada), CONICYT (Chile), Ministerio de Ciencia, Tecnología e Innovación Productiva (Argentina), and Ministério da Ciência, Tecnologia e Inovação (Brazil).
Based on observations collected at the European Organisation for Astronomical
Research in the Southern Hemisphere under ESO programme(s) 092.D-0308(A).
Facilities: Magellan:Clay (MIKE), Gemini:South (GMOS)MOOG (Sneden 1973; Sobeck et al. 2011), MIKE Carnegie Python Pipeline (Kelson 2003), IRAF (Tody 1986; Tody 1993), NumPy (van der Walt et al. 2011), SciPy (Jones et al. 2001), Matplotlib (Hunter 2007), Astropy (Astropy Collaboration et al. 2013)
Abstract
We report the discovery of J15213538, a bright (), very metal-poor ([Fe/H] ) strongly -process enhanced field horizontal branch star, based on a high-resolution, high signal-to-noise Magellan/MIKE spectrum. J15213538 shows the largest -process element over-abundance in any known -process-enhanced star, with [Eu/Fe] , and its chemical abundances of 22 neutron-capture elements closely match the scaled solar -process pattern. J15213538 is also one of few known carbon-enhanced metal-poor stars with -process enhancement (CEMP- stars), as found after correcting the measured C abundance for the star’s evolutionary status. We propose to extend the existing classification of moderately enhanced () -I and strongly -process enhanced () -II stars to include an -III class, for -process stars such as J15213538, with and , or times the solar ratio of europium to iron. Using cosmochronometry, we estimate J15213538 to be Gyr and Gyr old, using two different sets of initial production ratios. These ages are based on measurements of the Th line at 4019 Å and other r-process element abundances. This is broadly consistent with the old age of a low-mass metal-poor field red horizontal branch star. J15213538 (catalog 2MASS J15213995-3538094) likely originated in a low-mass dwarf galaxy that was later accreted by the Milky Way, as evidenced by its highly eccentric orbit.
Keywords:
nucleosynthesis — Galaxy: halo — stars: abundances — stars: Population II — stars: individual (2MASS J152139953538094)I Introduction
The atmospheres of -billion-year-old stars reflect the chemical composition of interstellar gas at the time of their birth, supplying details about element formation shortly after the Big Bang. Very metal-poor ([Fe/H] ) stars are believed to have formed from gas enriched by only one or a few progenitor supernovae or nucleosynthetic events (Frebel & Norris 2015). A very small fraction (3–5%) of these ancient stars formed from gas enriched by the rapid neutron-capture (-) process (Barklem et al. 2005; Hansen et al. 2018; Sakari et al. 2018, R. Ezzeddine et al. 2020, in prep.). The -process is responsible for producing the heaviest elements () in the Universe, along with the slow (-) neutron-capture process (Karakas & Lattanzio 2014; Gull et al. 2018), and the intermediate (-) neutron-capture process (Dardelet et al. 2014; Hampel et al. 2016). The observed elemental abundance patterns of metal-poor -process-enhanced stars can thus be used to characterize the yields of -process production events and associated sites in the early Universe.
The -process principally occurs when seed nuclei (e.g., iron-group elements) are bombarded rapidly with neutrons, resulting in neutron-rich, unstable isotopes. A distinct chemical abundance pattern of heavy elements up to and including uranium is created from the radioactive decay of these isotopes. Evidence from stars displaying the -process pattern, including the Sun and metal-poor stars (e.g., Sneden et al. 1996; Hill et al. 2002; Frebel et al. 2007; Casey & Schlaufman 2017; Placco et al. 2017; Holmbeck et al. 2018; Sakari et al. 2018), strongly suggests that the pattern is universal across cosmic time, at least for elements Ba to Hf. This behavior has been associated with the main component of the -process (the “main--process”) (Truran et al. 2002). On the contrary, variations can exist between lighter elements () and the corresponding scaled-solar -process pattern (e.g., Barklem et al. 2005; Roederer et al. 2014a; Ji et al. 2016b; Ji & Frebel 2018; Cain et al. 2018). These variations might be caused by a “limited -process” which is postulated to only produce neutron-capture elements lighter than barium (Wanajo et al. 2001; Travaglio et al. 2004). Additionally, the abundances of the actinide elements Th and U occasionally deviate from the scaled-solar -process pattern in the form of stars displaying an “actinide-boost” (e.g., Mashonkina et al. 2014; Holmbeck et al. 2018) or an actinide deficiency (e.g., Ji & Frebel 2018).
Decades of observational and theoretical efforts have been devoted towards understanding the origins of the -process (see Frebel 2018 and references therein). Evidence from the “kilonova” electromagnetic counterpart of the merger of a neutron star pair GW170817 (Abbott et al. 2017a; Abbott et al. 2017b) strongly supports neutron star mergers as viable main -process sites (Coulter et al. 2017; Drout et al. 2017; Kilpatrick et al. 2017; Shappee et al. 2017). Simulations also show that collapsar (the collapse of rapidly rotating massive stars) accretion disks may yield sufficient -process elements to explain a significant contribution to the Universe’s main -process enrichment (Surman et al. 2006; Siegel et al. 2019). The limited -process may occur during core-collapse supernovae, through a high-entropy neutrino wind (e.g., Meyer et al. 1992; Woosley & Hoffman 1992; Kratz et al. 2007; Arcones & Montes 2011; Wanajo 2013) or jet-like explosions during magnetorotationally driven core-collapse supernovae (Nishimura et al. 2015).
The amount of -process enhancement in metal-poor stars can provide constraints on the yields and astrophysical sites of the -process(es) if the mass of the birth gas clouds is known. Observational evidence from the -process-rich ultra-faint dwarf (UFD) galaxy Reticulum II first suggested that the astrophysical site of the main -process was a prolific event such as a neutron star merger (Ji et al. 2016a; Ji et al. 2016b; Roederer et al. 2016). The gas dilution mass of Reticulum II and the level of -process-enhancement from several of its metal-poor stars were used to estimate the yield of the rare -process event that enriched the galaxy, consistent with that of a single neutron star merger.
While -process stars in UFDs can provide constraints on the yields of -process events, UFD stars are particularly difficult to observe due to their faint magnitudes. On the contrary, metal-poor -process-enhanced Galactic halo stars are generally brighter and can be easily observed to obtain a very-high-S/N spectrum for detailed chemical abundance analysis. -process enhancement is also not restricted to any particular evolutionary status, making it possible to use different samples to discover them. Nevertheless, most searches have focused on cooler giants whose absorption lines are stronger and thus easier to measure when elemental abundances are low.
About half of metal-poor -process-enhanced halo stars have been estimated to be accreted from now-destroyed -process UFDs such as Reticulum II (Brauer et al. 2019). The natal gas cloud masses from which halo stars originally formed, however, remain unknown, so that -process yields cannot be inferred. Information about their birth sites may instead be inferred from their kinematics (Roederer et al. 2018a) and chemical abundances. Statistically large samples of ancient -process halo stars can thus help trace the origins of -process enhancement in the Galaxy shortly after the Big Bang.
The goal of the -Process Alliance (Hansen et al. 2018, RPA;) is to better understand the -process and its astrophysical production site(s) by increasing the number of known -process-enhanced stars in the Milky Way. Recent results from the RPA include detailed chemical abundances of both strongly enhanced -II stars ([Eu/Fe) and moderately enhanced -I stars ( [Eu/Fe] ) in the Galactic halo (e.g., Cain et al. 2018; Hansen et al. 2018; Holmbeck et al. 2018; Roederer et al. 2018b; Sakari et al. 2018; Sakari et al. 2019). We here present a newly discovered very metal-poor ([Fe/H]) red horizontal branch star, 2MASS J152139953538094 (hereafter J15213538), found as part of the ongoing discovery work of the RPA. J15213538 is extremely -process-enhanced with [Eu/Fe], the highest value of any -process-enhanced star known to date. J15213538 is also one of a small but growing number of -process-enhanced horizontal branch stars. In this paper we describe the chemical abundance pattern of J15213538, and introduce a new regime in the parameter space of extreme -process-enhancement in very metal-poor stars.
II Observations and Line Measurements
J15213538, with 15:21:39.8, 35:38:08.3, , was first identified as a potential metal-poor star from photometry (Meléndez et al. 2016, based on the criteria of) and spectroscopy in RAVE DR5 (Kunder et al. 2017). The star was followed-up with medium-resolution () spectroscopy using the ESO New Technology Telescope (EFOSC-2; semester 2014A) and the Gemini South Telescope (GMOS-S; semester 2015A). Both observing setups used similar gratings ( l mm-1) and slits (0) in blue setup, to cover at least the wavelength range -5300 Å and exposure times to yield signal-to-noise (S/N) ratios of per pixel at Å. Further details on the observations, data reduction, and processing can be found in Placco et al. 2018. Atmospheric parameters and carbon abundances were determined from the final, combined spectra using the n-SSPP (Beers et al. 2014; Beers et al. 2017): T K, , , . Additional medium resolution stellar parameters are listed in Table 1.
| Source | g | [Fe/H] | ||
|---|---|---|---|---|
| [K] | [cgs] | [km s-1] | ||
| High-Resolution Stellar Parameters | ||||
| LTE | ||||
| NLTE | ||||
| Medium-Resolution Stellar Parameters | ||||
| RAVE DR5 | … | |||
| RAVE-onaaCasey et al. 2017 | … | |||
| n-SSPP | … | |||
Note. — High-resolution LTE parameters are adopted for our chemical abundance analysis.
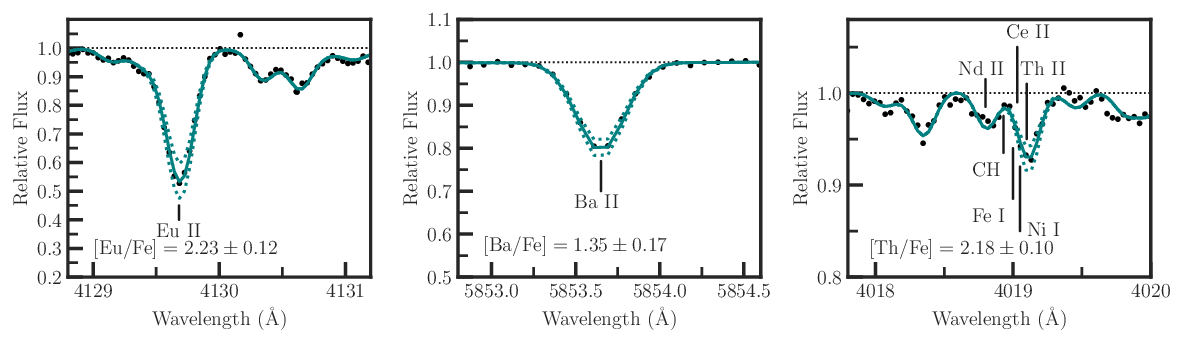
We then observed J15213538 using the Magellan-Clay telescope and the MIKE spectrograph (Bernstein et al. 2003) at Las Campanas Observatory on 2016 April 16 and 2017 May 6. We obtained a high-resolution spectrum with nominal resolving power of in the blue and in the red wavelength regime, using a slit and binning. The spectra cover Å to Å, with the blue and red CCDs overlapping at around Å. The total exposure time was 15 minutes in 2016 and 20 minutes in 2017. Data reductions were completed using the MIKE Carnegie Python pipeline (Kelson 2003). To combine the data from both nights, we first reduced the data from each night separately. The reduced spectra from both nights were combined after shifting each to the rest frame to account for spatial and spectral shifts between nights. The resulting S/N for the combined spectrum is at Å, at Å, and at Å. Representative portions of the spectrum, including the Eu ii line at 4130 Å, the Ba ii line at 5853 Å, and the Th ii line at 4019 Å, are shown in Figure 1.
We measured heliocentric radial velocities (vhelio) by cross-correlating the two individual spectra against a template spectrum of HD 140283. Although HD 140283 is a subgiant star, it is an ideal candidate for radial velocity cross-correlation because it has a similar effective temperature and metallicity to J15213538 (see Section III). We find vhelio values of km s-1 and km s-1 for the 2016 and 2017 observations, respectively. We derive uncertainties from the standard deviation of vhelio measurements found using several different template spectra. The resulting uncertainties agree with the level of stability of MIKE. We adopt a final heliocentric radial velocity of km s-1 by averaging our results and an uncertainty of km s-1 by inverse variance weighting.
Previous survey observations also report vhelio values for J15213538. RAVE DR5 (Kunder et al. 2017) reports a heliocentric radial velocity of km s-1 from 2005 May 28. Gaia DR2 records a radial velocity of km s-1 collected between 2014 July 25 and 2016 May 23 (Gaia Collaboration et al. 2016a; Gaia Collaboration et al. 2016b). These measurements, along with our data, suggest that J15213538 is a single star, in line with the majority of metal-poor -process-enhanced stars (Hansen et al. 2015b).
We then performed a standard abundance analysis for our star following the procedure described in Frebel et al. 2013. We used the 2017 version of the MOOG code11 1 https://github.com/alexji/moog17scat (Sneden 1973), which accounts for Rayleigh scattering as coherent, isotropic scattering (Sobeck et al. 2011). Together with MOOG, we employ an ATLAS9 (Castelli & Kurucz 2004) 1D plane-parallel model atmosphere with -enhancement and no overshooting, and assuming local thermodynamic equilibrium (LTE). All line measurements, stellar parameters, and abundance measurements were made using the SMHR software (Casey 2014).
We derived iron equivalent widths (EW) using a line list compiled from several data sources (O’Brian et al. 1991; Kurucz 1998; Meléndez & Barbuy 2009; Den Hartog et al. 2014; Ruffoni et al. 2014). Neutron-capture line lists used data from Hill et al. 2002; Hill et al. 2017. Synthesis line lists based on atomic data from Sneden et al. 2009; Sneden et al. 2014; Sneden et al. 2016 were provided by Chris Sneden and supplemented with data from Kurucz 1998. The CH synthesis line list was taken from Masseron et al. 2014.
We obtained EW measurements by fitting a -minimized Gaussian profile to each absorption line in our list. Lines with strong damping wings were disregarded. In addition, we performed synthesis measurements for heavily blended lines or lines with hyperfine structure by fitting the line of interest and any surrounding lines within a local wavelength region by using already measured abundances. We obtained a upper limit on the abundance of lines too weak to be detected. [X/H] and [X/Fe] values were calculated using solar abundances from Asplund et al. 2009. Wavelengths (), excitation potentials (EP), values, EWs, and derived abundances () are listed in Table 2.
| Element | EP | gf | EW | (X) | |
|---|---|---|---|---|---|
| [Å] | [eV] | [mÅ] | |||
| CH | 4312 | … | … | syn | 6.20 |
| Na i | 5889.95 | 0.00 | 0.11 | 121.0 | 3.69 |
| Na i | 5895.92 | 0.00 | 0.19 | 89.7 | 3.54 |
| Mg i | 3986.75 | 4.35 | 1.03 | 12.9 | 5.25 |
| Mg i | 4057.51 | 4.35 | 0.89 | 11.0 | 5.03 |
| Mg i | 4167.27 | 4.35 | 0.71 | 23.2 | 5.22 |
| Mg i | 4702.99 | 4.33 | 0.38 | 35.9 | 5.10 |
| Mg i | 5528.40 | 4.34 | 0.50 | 32.7 | 5.16 |
| Mg i | 5711.09 | 4.34 | 1.72 | 3.4 | 5.30 |
| Al i | 3944.00 | 0.00 | syn | 2.93 | |
| Al i | 3961.52 | 0.01 | 0.34 | 79.4 | 2.88 |
| Si i | 3906.52 | 1.91 | 1.09 | syn | 4.79 |
| Ca i | 4283.01 | 1.89 | 0.22 | 20.2 | 3.86 |
| Ca i | 4318.65 | 1.89 | 0.21 | 21.8 | 3.89 |
Note. — “syn” denotes spectrum synthesis was used to measure the abundance. For ease of reading, we include the full list at the end of the paper in Table 7.
III Stellar parameters
Stellar parameters for J15213538 were determined spectroscopically using EWs from 154 Fe i and 21 Fe ii lines following the procedure in Frebel et al. 2013. Our final adopted stellar parameters are K, , , and km s-1. These parameters are consistent with the star being located on the red horizontal branch, as gleaned from a Gyr isochrone from the PARSEC models (Marigo et al. 2017)22 2 http://stev.oapd.inaf.it/cgi-bin/cmd for . We note here that technically, horizontal branch stars were not included in the Frebel et al. 2013 stellar parameter calibration. However, a sample of five horizontal branch stars (A. Frebel et al. 2020, in prep.) suggests that in order to adequately deal with abundances of strong lines, significant effective temperate decreases (together with higher values) are necessary to bring these abundances in line with those of weaker lines. The resulting cooler temperatures are not unlike those investigated in Frebel et al. 2013. While this issue is being explored, we preemptively decided to apply the non-horizontal branch correction to J1512-3538, as a mitigation. We adopt typical systematic uncertainties in the stellar parameters as obtained from a spectroscopic analysis (Frebel et al. 2013; Ji et al. 2016a). We take K, dex, and km s-1. Statistical contributions to , , and are negligible in comparison, due to the brightness of J15213538 (), the high S/N of the spectrum, and the large number of Fe i lines measured. The uncertainty in [Fe/H] is dex, which is derived from the standard deviation of Fe i line abundances. Our stellar parameters agree well with results from the EFOSC/GMOS medium-resolution spectrum and results from RAVE surveys (see Table 1).
We also determined stellar parameters assuming non-LTE (NLTE). Deviations from LTE are significant for minority species, such as Fe i. These NLTE effects are particularly strong in metal-poor stars, as they have lower atmospheric electron densities and fewer atomic collisions. Thus, stellar parameters derived assuming NLTE are generally more accurate than the LTE parameters. To determine NLTE stellar parameters, we first determined NLTE abundances for Fe i and Fe ii lines using a comprehensive Fe atom (Ezzeddine et al. 2016) with up-to-date atomic data, especially for hydrogen collisions from Barklem 2018. Starting from the LTE stellar parameters, we changed each parameter iteratively until excitation and ionization equilibrium were attained in NLTE between abundances of Fe i and Fe ii lines. Using this procedure, outlined in Ezzeddine et al. 2017, we derived NLTE stellar parameters of T K, dex, 0.15, and km s-1. The uncertainties listed are those determined in Ezzeddine et al. 2018 for metal-poor stars with detectable Fe ii lines, which we adopt here. The derived temperature and surface gravity are consistent with J15213538 being a red horizontal branch star. The derived NLTE metallicity of agrees well with the predicted NLTE metallicity of from the Ezzeddine et al. 2017 equation
Since the metallicity was increased and Fe i is primarily affected by NLTE, the surface gravity had to also be increased by dex to reach ionization balance. The NLTE microturbulence was lowered by 0.55 km s-1. However, in order to readily calculate consistent abundance ratios and to compare our results to literature values, we use the LTE parameters for the chemical abundance analysis and interpretation throughout the paper. Future capabilities able to produce full NLTE abundance patterns would hopefully make use of our NLTE stellar parameters.
| Element | [X/H] | [X/Fe] | N | |||
|---|---|---|---|---|---|---|
| C | ||||||
| Na i | ||||||
| Mg i | ||||||
| Al i | ||||||
| Si i | ||||||
| Ca i | ||||||
| Sc ii | ||||||
| Ti i | ||||||
| Ti ii | ||||||
| V ii | ||||||
| Cr i | ||||||
| Mn i | ||||||
| Fe i | ||||||
| Fe ii | ||||||
| Co i | ||||||
| Ni i | ||||||
| Zn i | ||||||
| Sr ii | ||||||
| Y ii | ||||||
| Zr ii | ||||||
| Ru i | ||||||
| Ba ii | ||||||
| La ii | ||||||
| Ce ii | ||||||
| Pr ii | ||||||
| Nd ii | ||||||
| Sm ii | ||||||
| Eu ii | ||||||
| Gd ii | ||||||
| Tb ii | ||||||
| Dy ii | ||||||
| Ho ii | ||||||
| Er ii | ||||||
| Tm ii | ||||||
| Yb ii | ||||||
| Hf ii | ||||||
| Os i | ||||||
| Ir i | 1 | … | ||||
| Th ii | ||||||
| U ii | 1 | … |
IV Chemical Abundances
We obtained abundance measurements using both spectrum synthesis and EW analysis. Our final abundances are summarized in Table 3 and fully detailed in Table 2. We derive statistical abundance uncertainties, , from the standard deviation of line abundances, which was corrected for small samples when five or fewer lines were measured. Systematic uncertainties due to, e.g., NLTE effects, 1D stellar model atmospheres, and gf-values, are not explicitly considered. Small sample standard deviations for elements with measured abundances of 2–5 lines were obtained following Keeping 1962, by multiplying the range of values covered by our line abundances with the k-factor calculated for small samples. For elements with one line only, we adopt an uncertainty between 0.1 and 0.3 dex, depending on the data and fit quality. Finally, we adopt a minimum uncertainty of 0.10 dex, as better precision is improbable due to continuum placement difficulties. Table 4 enumerates the systematic uncertainties in our chemical abundances resulting from uncertainties in our model atmosphere parameters, obtained from varying the stellar parameters by their uncertainties in the positive direction ( K, dex, km s-1), and recording the resulting change in abundance.
| Element | Total | |||
|---|---|---|---|---|
| +150 K | +0.30 dex | +0.30 km s-1 | Error | |
| C | +0.10 | 0.38 | ||
| Na i | +0.10 | 0.07 | 0.12 | |
| Mg i | +0.07 | 0.10 | 0.13 | |
| Al i | +0.15 | 0.01 | 0.15 | |
| Ca i | +0.09 | 0.01 | 0.01 | 0.11 |
| Ti i | +0.14 | 0.00 | 0.00 | 0.14 |
| Ti ii | +0.08 | +0.10 | 0.03 | 0.13 |
| Cr i | +0.16 | 0.01 | 0.03 | 0.16 |
| Fe i | +0.13 | 0.01 | 0.04 | 0.14 |
| Fe ii | +0.03 | +0.10 | 0.02 | 0.11 |
| Ni i | +0.21 | 0.04 | 0.08 | 0.23 |
| Zn i | +0.10 | +0.01 | 0.01 | 0.08 |
| Sr ii | +0.06 | +0.13 | 0.04 | 0.15 |
| Ba ii | +0.08 | +0.10 | 0.04 | 0.13 |
| Ce ii | 0.05 | +0.05 | 0.05 | 0.09 |
| Nd ii | +0.11 | +0.11 | 0.01 | 0.16 |
| Eu ii | +0.06 | +0.07 | +0.02 | 0.09 |
| Er ii | +0.14 | +0.08 | 0.02 | 0.16 |
| Os i | 0.28 | |||
| Th ii | 0.10 |
Note. — The individual systematic errors are added in quadrature to compute the total error.

IV.1 Light Elements
We measured light-element abundances (C, Na, Mg, Al, Si, Ca, Sc, Ti, V, Cr, Mn, Co, Ni, and Zn) for J15213538. They are in agreement with the abundances of other metal-poor stars analyzed by Yong et al. 2013, as can be seen in Figure 2. We note that we did not measure O (e.g., from the O i 6300 Å line) or K (e.g., from the K i 7664 Å line), as they were too weak to be measured, and blended with telluric features.
Carbon. We measured a carbon abundance of [C/Fe] by performing spectrum synthesis on the CH G-bandhead at 4313 Å and assuming [O/Fe] . The CH feature at 4323 Å was too weak to be measured. We estimate a low value consistent with 4 (the approximate equilibrium value of the CN cycle) for the 12C/13C ratio from the line at 4217 Å, supporting our assertion that J15213538 is a horizontal branch star. For the same reason, its carbon abundance can be assumed to be depleted by the CN cycle having operated during the star’s evolution along the giant branch. Therefore, we correct the carbon abundance to account for its evolutionary status to obtain an abundance more representative of the natal gas cloud from which J15213538 formed. We apply the maximum correction of dex following Placco et al. 2014, yielding a corrected carbon abundance of [C/Fe] . J15213538 adds to the small number of known -process rich carbon-enhanced metal-poor stars (CEMP-; with [C/Fe] ; Beers & Christlieb 2005; Aoki et al. 2007).
Sodium and Aluminum. Sodium abundances ([Na/Fe] ) are derived from the EWs of the Na doublet at 5890 Å and 5895 Å. There are about seven interstellar medium (ISM) Na features which are clearly spread apart and separate from the stellar lines. It can never be excluded that there is an ISM feature at the same velocity as the star, but since the two Na lines give consistent abundances, it is likely that the stellar lines are not affected. We apply non-LTE corrections to the Na abundance using results from Lind et al. 2011, yielding a corrected value of [Na/Fe] . We measure the aluminum abundance ([Al/Fe] ) from spectrum synthesis of the Al I line at 3944 Å and an EW measurement of the Al I at 3961 Å. The abundances derived from both lines exhibit excellent agreement, with values of 2.93 and 2.88, respectively.
Magnesium, Silicon, Calcium, Titanium. The abundances of Mg, Si, Ca, and Ti (also known as -elements) were obtained using a mixture of EW measurements and spectrum synthesis. We measured the Si line at 3905 Å using spectrum synthesis. The Si I line at 4102 Å was heavily blended and could not be measured. The abundances of the -elements were [Mg/Fe] , [Si/Fe] , [Ca/Fe] , and [Ti/Fe] . This level of -element enhancement () is consistent with stars whose light-element abundance enhancement originates primarily from core-collapse supernovae, rather than Type Ia supernovae. The low Si abundance is likely a model atmosphere effect because J15213538 is a hot horizontal branch star (cf. Preston et al. 2006), so the measured abundance likely does not reflect the true cosmic abundance.
Scandium through Zinc. Sc was measured from eight equivalent widths, yielding an abundance of V was measured using spectrum synthesis of the 3952 Å line and the 4005 Å line. The abundances derived from these lines agreed well, with [V/Fe] values of +0.17 and +0.18, respectively. Ni and Cr were measured from several lines using EW measurements, whereas Mn and Co were measured using synthesis measurements. Zinc () was measured from the EW of the strongest available line at 4810 Å. No other Zn lines were detectable. We adopt a conservative error estimate for Zn of dex, because this line was in fact very weak.
IV.2 Neutron-Capture Elements
We derive abundances for 22 neutron-capture elements for J15213538. Measurements or upper limits for Sr, Y, Zr, Ru, Ba, La, Pr, Sm, Eu, Tb, Dy, Ho, Tm, Yb, Hf, Os, Ir, Th, and U were measured with spectrum synthesis to account for hyperfine structure and blending of absorption features. Abundances based on EWs were obtained for Ce, Nd, Gd, and Er. For Ba and Eu measurements, we used the -process isotope composition as given in Sneden et al. 2008. Mo, Pd, Ag, Lu, and Pb could not be measured. Abundance results and uncertainties are given in Table 3. The full set of line abundances and associated atomic data of all measured elements are presented in Table 2. Figure 3 displays our neutron-capture element abundances overlaid with the scaled solar -process pattern from Burris et al. 2000. We scaled the solar -process pattern by the difference between the mean measured abundances for elements Ba to Yb in J15213538 and the Sun.

Strontium, Yttrium, Zirconium. Using spectrum synthesis, we measured the Sr abundance from the line at 4161 Å, as the lines at 4077 Å and 4215 Å were saturated. Y and Zr were measured from 10 and 8 lines, respectively. These elements are just slightly heavier than those at the first -process peak and may be produced by the limited -process (Wanajo & Ishimaru 2006; Siqueira Mello et al. 2014). Because the limited -process is thought to occur at different astrophysical site(s) than the main -process, the abundances of Sr, Y, and Zr are often offset from the main -process pattern. In the case of J15213538, however, the Sr and Zr abundances agree very well with the scaled solar -process pattern, as shown in Figure 3. The Y residual is larger ( dex), though this deviation is common and can be attributed to our choice of solar -process pattern, so it should not be regarded as a concern (Arlandini et al. 1999). The overall agreement between Sr, Y, and Zr and the main -process elements with the scaled solar -process pattern indicates that J15213538 likely inherited a substantial amount of material from the main -process.
Barium through Hafnium. Two barium lines were measured using spectrum synthesis at 4130 Å and 5853 Å. The 4130 Å line was blended with Gd and Ce, but a good fit was obtained using the independently measured Gd and Ce abundances. The line at 5853 Å is clean, and is shown in Figure 1. Its abundance agreed well with the 4130 Å line, yielding an overall uncertainty of dex. The Ba lines at 4553 Å, 6142 Å, and 6497 Å were saturated. A total of 18 lanthanum lines were measured between 3795 Å and 5123 Å using spectrum synthesis. All line abundances agreed within 0.3 dex. Cerium, neodymium, and gadolinium abundances were derived from the EWs of 20, 46, and 9 lines, respectively. The uncertainties on these measurements were low ( dex) due to the large number of lines measured and low spread ( dex).
Eight praseodymium lines were measured between 4063 Å and 4449 Å. Spectrum synthesis was used to account for the hyperfine structure. The lines at 4179 Å and 4449 Å were blended with Nd ii and Dy ii, respectively. Nevertheless, the derived abundances were consistent with other values, with an overall uncertainty of 0.10 dex. Samarium was also measured from 13 lines using spectrum synthesis. All of the measured Sm lines were weak; however, the derived abundance of agrees well with the scaled solar -process pattern in Figure 3.
We measured the europium abundance from seven lines at 3725 Å, 3820 Å, 3907 Å, 4129 Å, 4205 Å, 6645 Å, and 7218 Å. The 4129 Å line is shown in Figure 1. We used an isotope ratio of , following Sneden et al. 2008. Lines at 6645 Å and 7218 Å were weaker, whereas the other five lines were strong. The 3725 Å line was located in the wing of a Balmer line, so the continuum was fit locally. The final abundance for the line at 3725 Å (with ) agreed well with the average line abundance (). The line at 7218 Å yielded the highest abundance () and was included due to its high quality (no blending or distortions). The 4205 Å line had the lowest abundance (), but the overall fit was very good. We find , with a standard deviation in values of dex.
We measured Tb, Dy, Ho, Yb, and Hf using spectrum synthesis, and Er using EW measurements. We measured Tb from three lines at 3569 Å, 3659 Å, and 3899 Å. The line at 3702 Å was located in the wing of a Balmer line and could not be measured. Although the 3569 Å and 3659 Å lines were located in noisier portions of the spectrum, all line measurements agreed well with the average value of , within dex. The measurements were remarkably consistent, with a range of values of dex. We measured the 4077 Å Dy line with spectrum synthesis. This required increasing the abundance of the strong blending Sr line by an artificial dex to account for the saturation of the contributing line. We measured Yb from one line at 3694 Å, and adopt a conservative uncertainty of 0.20 dex. Hf was measured from one line at 4093 Å, yielding an abundance of . The Hf line at 3917 Å was excluded because it was heavily blended, though we note its abundance () agrees well with our adopted abundance.
Overall, the chemical abundances of barium through hafnium show remarkable agreement with the scaled solar -process pattern shown in Figure 3.
Osmium and Iridium. We determined the Os abundance from the line at 4419 Å using spectrum synthesis. We adopt an uncertainty of 0.30 dex to account for the quality of the line, which was very weak and heavily blended with Sm. This measurement yielded an abundance of (). Our adopted abundance agrees within with the scaled solar -process pattern. We also obtained consistent upper limits of and from two weak lines at 4260 Å and 4136 Å, respectively.
A upper limit for Ir was measured from the line at 3513 Å, yielding an abundance of . A tighter bound on the abundance upper limit of was derived from the line at 3800 Å, but this was value was not adopted because the line was blended with a Balmer line. Instead, we adopt the more conservative upper limit from the 3513 Å line.
Thorium and Uranium. We determined the Th abundance from the line at Å, taking into account various blends (e.g., C, Fe, Ni, Ce, Pr). The fit, which yielded , is shown in Figure 1. Abundance variations of dex are also given to show the quality of the fit. For U, only an upper limit could be determined from a synthetic fit of the line at 3859 Å. This line is located on the wing of a saturated Fe line, so we increased the Fe abundance by dex to obtain a better fit. We adopt a final conservative, upper limit of .
Thorium and uranium are radioactive isotopes solely produced by the -process. J15213538 does not appear to have an unusual amount of Th (“actinide boost”) compared to expectations of the decay and taking into account its presumably old age. This makes it possible to estimate a stellar age for J15213538, by comparing abundance ratios involving Th with theoretical -process production ratios, as further described in Section V.3.
V Discussion and Conclusion
V.1 The Class of -III Stars
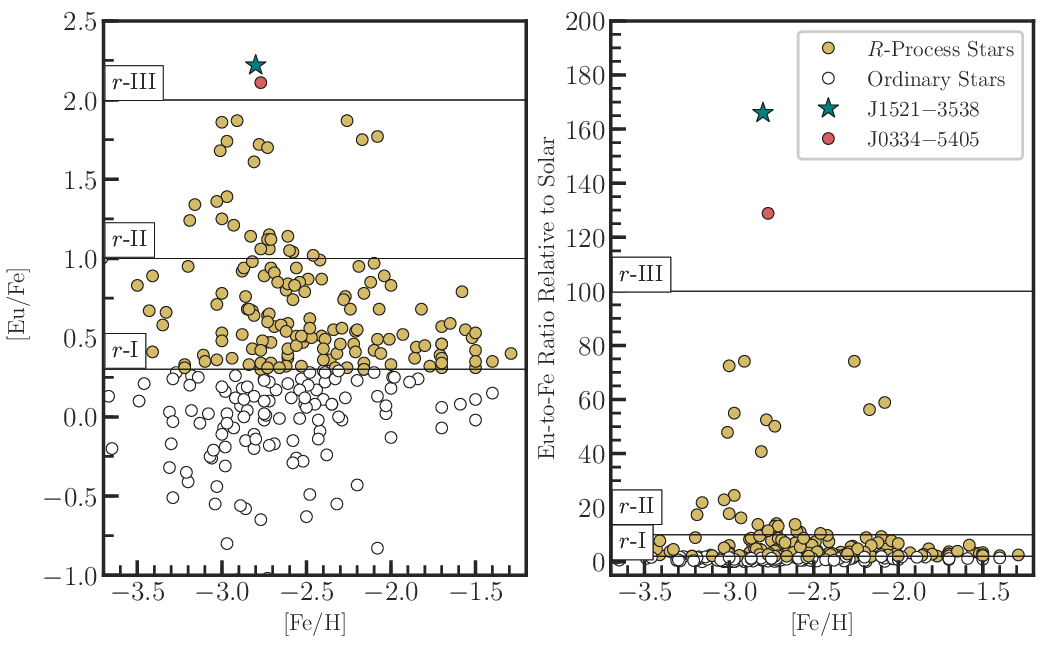
J15213538 is the second -process enhanced star with a [Eu/Fe] abundance larger than ; i.e., the abundance ratio is enhanced by a factor of compared to the solar ratio. This is shown in Figure 4. At , this implies that J15213538 contains only 4 times less Eu than the Sun. The other such star known is J03345405, with , a star in the -process dwarf galaxy Reticulum ii (Ji et al. 2016a; Roederer et al. 2016). Though its absolute Eu abundance is very similar to that of J15213538, the result was not initially considered significant because the S/N of the spectrum was fairly low. Given this leap by more than a factor of two in -process enhancement compared to previously known -process rich stars (with ), we propose to extend the existing classification scheme (Beers & Christlieb 2005) to include an “-III” class for stars with [Eu/Fe] . The other classes are the moderately enhanced () -I and the strongly enhanced -process () -II stars. The three classes are illustrated in Figure 4. The -I stars make up about 15% of metal-poor halo stars with , whereas -II stars are less common with -% (Barklem et al. 2005; Sakari et al. 2018). The -III stars are thus extremely rare, making up roughly 5% of all -II stars (excluding J03345405), which implies a frequency of % among halo stars.
V.2 Kinematics
The second data release from the Gaia mission (Lindegren et al. 2018) included measurements of the parallax ( mas) and proper motions ( mas yr-1, mas yr-1) of J15213538 (catalog 2MASS J15213995-3538094). We use these data, plus the coordinates and the heliocentric radial velocity measured from our spectra, to compute the six-dimensional position and space velocity of J15213538 (catalog 2MASS J15213995-3538094). We follow the method described by Roederer et al. 2018a. That study adopted MWPotential2014 for the Milky Way gravitational potential (Bovy 2015), computed orbits using the Agama code (Vasiliev 2019), and evaluated the specific energy and integrals of motion using the algorithm described by Binney 2012, as implemented in Agama. We resample the input quantities times and recompute the kinematic properties from each resample. Table 5 lists the results of our calculations. The uncertainties quoted in Table 5 reflect statistical uncertainties only, and they do not account for systematic uncertainties in, e.g., the gravitational potential.
Our calculations indicate that J15213538 (catalog 2MASS J15213995-3538094) is on a bound, prograde orbit around the Galaxy, with a high eccentricity of 0.82. It is currently located relatively near its orbital pericenter kpc from the Galactic center, and its eccentric orbit carries it more than 60 kpc from the Galactic center and 30 kpc above the Galactic plane. This presumably makes J15213538 (catalog 2MASS J15213995-3538094) an outer halo star. However, we note J15213538 (catalog 2MASS J15213995-3538094) has energy and actions that are distinct from any of the 35 highly r-process-enhanced stars whose kinematics were studied by Roederer et al. 2018a, so it is not likely to be affiliated with any of the groups identified in that study. All this, taken together with the low metallicity of J15213538 (catalog 2MASS J15213995-3538094), suggests it would have been born in a relatively low-mass dwarf galaxy (e.g., Kirby et al. 2013; Walker et al. 2016). The extreme r-process enhancement found in J15213538 (catalog 2MASS J15213995-3538094) may be a consequence of its birth in such a system if it underwent an early -process event. A low-mass, low-density dwarf galaxy on an orbit similar to J15213538 (catalog 2MASS J15213995-3538094) would have been tidally disrupted long ago, and we suggest that this scenario led to the accretion of J15213538 (catalog 2MASS J15213995-3538094) by the Milky Way. Searches for other stars with similar kinematic properties may prove fruitful in the study of the nature and environment of the r-process (e.g., Yuan et al. 2020).
| Quantity | Description | Units | Value |
|---|---|---|---|
| Distance (inverse parallax) | kpc | 2.25 | |
| Orbital pericentric radius | kpc | 5.95 | |
| Orbital apocentric radius | kpc | 61.9 | |
| Maximum height above or below the Galactic midplane | kpc | 32.0 | |
| Eccentricity | 0.82 | ||
| Radial component of velocity in cylindrical coordinates | km s-1 | 121 | |
| Azimuthal component of velocity in cylindrical coordinatesaaDefined such that this quantity is positive for prograde rotation. | km s-1 | 326 | |
| Vertical component of velocity in cylindrical coordinates | km s-1 | 249 | |
| km s-1 | 277 | ||
| Radial action integral | kpc km s-1 | 3150 | |
| Azimuthal action integralaaDefined such that this quantity is positive for prograde rotation. | kpc km s-1 | 2000 | |
| Vertical action integral | kpc km s-1 | 536 | |
| Specific orbital energy | (km s-1)2 | 51700 |
Note. — The uncertainties reflect the range between the 50th percentile and the 84th () and 16th () percentiles of the distributions.
V.3 Age Estimate for J15213538
Stellar age estimates can be obtained if radioactive elements are present in the star and their abundances can be measured. The -process produces thorium and uranium isotopes which have half-lives of 14 Gyr and 4.7 Gyr, respectively. Assuming that a single -process event took place soon before the formation of the star, the abundances of such radioactive species can provide information on the age, provided that an initial production ratio is known. Theoretical -process production ratios have been derived (Schatz et al. 2002; Hill et al. 2017) but remain uncertain given our incomplete understanding of the -process itself and its astrophysical site of operation. Given these production ratios, the age estimate can be calculated from
originally derived in Cayrel et al. 2001. Stellar abundance measurement uncertainties also have a significant impact on the resulting age. The statistical uncertainty for ages derived from Th (neglecting uncertainties in the initial production ratio) is given by
where is the standard error in abundance.
Despite these challenges, we provide age estimates for J15213538 as derived from elemental abundances of Th with those of other heavy neutron-capture elements, such as Th/Eu. Since U only has an upper limit, it cannot be used to determine a meaningful age or limit. We employ production ratios derived from -process waiting-point calculations (Schatz et al. 2002) and a high-entropy neutrino wind -process model (Hill et al. 2017) to illustrate the impact of different theoretical assumptions. We caution that the results should be broadly interpreted only to show that J15213538 and other metal-poor stars are indeed ancient, in line with their low [Fe/H] values.
Table 6 list the results for various elemental abundance ratios involving Th for both sets of production ratios. We base our best age estimates on the abundance ratios Th/Ce, Th/Eu, Th/Dy, and Th/Er because they have the lowest statistical uncertainties, following Placco et al. 2017. Our analysis yields 12.5 Gyr using the Hill et al. 2017 production ratios and 8.9 Gyr when using the Schatz et al. 2002 values. We note that an age of 12.5 Gyr is more in line with expectations for a low-mass metal-poor star with on the red horizontal branch. The other age of Gyr may also be reasonable, given the uncertainties and the possibility that J15213538 was born in a low-mass dwarf galaxy.
Age uncertainties stemming from measurement uncertainties are listed in Table 6. Realistically, we adopt 5 Gyr for our age uncertainty. Uncertainties arising from the production ratios are difficult to quantify but can principally be regarded of order a few Gyr as well. Historically, just the Th/Eu alone has been used to date many -process stars (e.g., Johnson & Bolte 2001; Hayek et al. 2009). Using just this ratio, we find 15 Gyr and 11 Gyr, respectively. Regardless of these uncertainties, the results for J15213538, as well as the ages of other -process metal-poor stars, show that it remains important to find ways to characterize the progenitor -process event and the birth site of each -process star so that these events can be modeled individually. Given the actinide-boost phenomenon, it has become clear that perhaps not all -process events produce the same amount of -process elements. In this context, understanding the nature and origin of the actinide boost would also be crucial for obtaining more accurate stellar ages via cosmochronometry.
| ThX | PRiiProduction ratios from a high-entropy neutrino wind -process model (Hill et al. 2017). | Age (Gyr) | PRiiiiProduction ratios from -process waiting-point calculations (Schatz et al. 2002). | Age (Gyr) | (Gyr) |
|---|---|---|---|---|---|
| Th/Ba | |||||
| Th/La | |||||
| Th/Ce | |||||
| Th/Pr | |||||
| Th/Nd | |||||
| Th/Sm | |||||
| Th/Eu | |||||
| Th/Gd | |||||
| Th/Tb | |||||
| Th/Dy | |||||
| Th/Ho | |||||
| Th/Er | |||||
| Th/Tm | |||||
| Average |
Note. — Abundance ratios used for determining ages are Th/Ce, Th/Eu, Th/Dy, and Th/Er. Age averages are given the standard deviation of the age measurements included in the average, for illustrative purposes. is the statistical error calculated from measurement uncertainties. The large spread in age estimates reflects measurement uncertainties and uncertainties in the theoretical models used to derive the production ratios.
VI Summary
The metal-poor horizontal branch star J15213538 was observed as part of efforts by the -Process Alliance that aim to advance our understanding of the -process by studying -process-enhanced Galactic halo stars. We have discovered that J15213538 displays the strongest over-abundance of -process elements observed in any -process-enhanced star. The heavy-element abundance pattern from Sr to Th closely matches the scaled solar -process pattern. A kinematic analysis of J15213538 (catalog 2MASS J15213995-3538094) shows it to be on a bound, prograde orbit around the Galaxy. This is distinct from other highly -process-enhanced stars (Roederer et al. 2018a). Given that it also has a highly eccentric orbit, it was likely accreted from a low-mass dwarf galaxy. Other -process stars with a similar kinematic signature may confirm this origin scenario.
Our detailed chemical abundance analysis shows that J15213538 is Gyr and Gyr old using the technique of cosmochronometry, which invokes abundance ratios of a radioactive element to other stable r-process elements. We used abundances from the Th II line at 4019 Å and lines of various r-process elements to derive these adopted ages. The two ages result from using two different sets of initial production ratios. The discrepancy highlights that the underlying r-process theory still requires fine tuning, or that the astrophysical site may play a significant role in the elemental yields of actinide-to-stable r-process element abundances. Hopefully, major facilities such as the Facility for Rare Isotope Beams (FRIB) will help to alleviate such discrepancies by providing fundamental nuclear species measurements that ultimately improve -process predictions. Regardless, J15213538 (catalog 2MASS J15213995-3538094) is clearly an old star, which is supported by it being a low-mass metal-poor field red horizontal branch star. Hence, J15213538 (catalog 2MASS J15213995-3538094) adds to the growing inventory of highly -process enhanced stars that will help to better characterize the nature of the -process and its astrophysical site of operation.
References
- Abbott et al. (2017a) Abbott, B. P., Abbott, R., Abbott, T. D., et al. 2017a, Physical Review Letters, 119, 161101
- Abbott et al. (2017b) —. 2017b, ApJ, 848, L12
- Abohalima & Frebel (2018) Abohalima, A., & Frebel, A. 2018, ApJS, 238, 36
- Aoki et al. (2007) Aoki, W., Beers, T. C., Christlieb, N., et al. 2007, ApJ, 655, 492
- Aoki et al. (2002a) Aoki, W., Norris, J. E., Ryan, S. G., Beers, T. C., & Ando, H. 2002a, PASJ, 54, 933
- Aoki et al. (2002b) Aoki, W., Ando, H., Honda, S., et al. 2002b, PASJ, 54, 427
- Arcones & Montes (2011) Arcones, A., & Montes, F. 2011, ApJ, 731, 5
- Arlandini et al. (1999) Arlandini, C., Käppeler, F., Wisshak, K., et al. 1999, ApJ, 525, 2
- Asplund et al. (2009) Asplund, M., Grevesse, N., Sauval, A. J., & Scott, P. 2009, ARA&A, 47, 481
- Astropy Collaboration et al. (2013) Astropy Collaboration, Robitaille, T. P., Tollerud, E. J., et al. 2013, A&A, 558, A33
- Barbuy et al. (2005) Barbuy, B., Spite, M., Spite, F., et al. 2005, A&A, 429, 1031
- Barklem (2018) Barklem, P. S. 2018, A&A, 612, A90
- Barklem et al. (2005) Barklem, P. S., Christlieb, N., Beers, T. C., et al. 2005, A&A, 439, 129
- Beers & Christlieb (2005) Beers, T. C., & Christlieb, N. 2005, ARA&A, 43, 531
- Beers et al. (2014) Beers, T. C., Norris, J. E., Placco, V. M., et al. 2014, ApJ, 794, 58
- Beers et al. (2017) Beers, T. C., Placco, V. M., Carollo, D., et al. 2017, ApJ, 835, 81
- Bernstein et al. (2003) Bernstein, R., Shectman, S. A., Gunnels, S. M., Mochnacki, S., & Athey, A. E. 2003, Proc. SPIE, 4841, 1694
- Binney (2012) Binney, J. 2012, MNRAS, 426, 1324
- Bovy (2015) Bovy, J. 2015, ApJS, 216, 29
- Brauer et al. (2019) Brauer, K., Ji, A. P., Frebel, A., et al. 2019, ApJ, 871, 247
- Burris et al. (2000) Burris, D. L., Pilachowski, C. A., Armandroff, T. E., et al. 2000, ApJ, 544, 302
- Cain et al. (2018) Cain, M., Frebel, A., Gull, M., et al. 2018, ApJ, 864, 43
- Casey (2014) Casey, A. R. 2014, ArXiv e-prints, arXiv:1405.5968
- Casey & Schlaufman (2017) Casey, A. R., & Schlaufman, K. C. 2017, ApJ, 850, 179
- Casey et al. (2017) Casey, A. R., Hawkins, K., Hogg, D. W., et al. 2017, ApJ, 840, 59
- Castelli & Kurucz (2004) Castelli, F., & Kurucz, R. L. 2004, ArXiv Astrophysics e-prints, astro-ph/0405087
- Cayrel et al. (2001) Cayrel, R., Depagne, E., Spite, M., et al. 2004, A&A, 416, 1117
- Cayrel et al. (2004) Cayrel, R., Hill, V., Beers, T.C., et al. 2001, Nature, 409, 691-692
- Cohen et al. (2003) Cohen, J. G., Christlieb, N., Qian, Y.-Z., & Wasserburg, G. J. 2003, ApJ, 588, 1082
- Cohen et al. (2006) Cohen, J. G., McWilliam, A., Shectman, S., et al. 2006, AJ, 132, 137
- Coulter et al. (2017) Coulter, D. A., Foley, R. J., Kilpatrick, C. D., et al. 2017, Science, 358, 1556
- Cui et al. (2013) Cui, W. Y., Sivarani, T., & Christlieb, N. 2013, A&A, 558, A36
- Dardelet et al. (2014) Dardelet, L., Ritter, C., Prado, P., et al. 2014, in XIII Nuclei in the Cosmos (NIC XIII), 145
- Den Hartog et al. (2014) Den Hartog, E. A., Ruffoni, M. P., Lawler, J. E., et al. 2014, ApJS, 215, 23
- Drout et al. (2017) Drout, M. R., Piro, A. L., Shappee, B. J., et al. 2017, Science, 358, 1570
- Ezzeddine et al. (2017) Ezzeddine, R., Frebel, A., & Plez, B. 2017, ApJ, 847, 142
- Ezzeddine et al. (2016) Ezzeddine, R., Merle, T., & Plez, B. 2016, Astronomische Nachrichten, 337, 850
- Ezzeddine et al. (2018) Ezzeddine, R., Merle, T., Plez, B., et al. 2018, A&A, 618, A141
- Frebel (2018) Frebel, A. 2018, Annual Review of Nuclear and Particle Science, 68, 237
- Frebel et al. (2013) Frebel, A., Casey, A. R., Jacobson, H. R., & Yu, Q. 2013, ApJ, 769, 57
- Frebel et al. (2007) Frebel, A., Christlieb, N., Norris, J. E., et al. 2007, ApJ, 660, L117
- Frebel & Norris (2015) Frebel, A., & Norris, J. E. 2015, ARA&A, 53, 631
- Gaia Collaboration et al. (2016a) Gaia Collaboration, Brown, A. G. A., Vallenari, A., et al. 2016a, A&A, 595, A2
- Gaia Collaboration et al. (2016b) Gaia Collaboration, Prusti, T., de Bruijne, J. H. J., et al. 2016b, A&A, 595, A1
- Gull et al. (2018) Gull, M., Frebel, A., Cain, M. G., et al. 2018, ApJ, 862, 174
- Hampel et al. (2016) Hampel, M., Stancliffe, R. J., Lugaro, M., & Meyer, B. S. 2016, ApJ, 831, 171
- Hansen et al. (2015a) Hansen, T., Hansen, C. J., Christlieb, N., et al. 2015a, ApJ, 807, 173
- Hansen et al. (2015b) Hansen, T. T., Andersen, J., Nordström, B., et al. 2015b, A&A, 583, A49
- Hansen et al. (2018) Hansen, T. T., Holmbeck, E. M., Beers, T. C., et al. 2018, ApJ, 858, 92
- Hayek et al. (2009) Hayek, W., Wiesendahl, U., Christlieb, N., et al. 2009, A&A, 504, 511
- Hill et al. (2017) Hill, V., Christlieb, N., Beers, T. C., et al. 2017, A&A, 607, A91
- Hill et al. (2002) Hill, V., Plez, B., Cayrel, R., et al. 2002, A&A, 387, 560
- Hollek et al. (2015) Hollek, J. K., Frebel, A., Placco, V. M., et al. 2015, ApJ, 814, 121
- Holmbeck et al. (2018) Holmbeck, E. M., Beers, T. C., Roederer, I. U., et al. 2018, ApJ, 859, L24
- Honda et al. (2011) Honda, S., Aoki, W., Beers, T. C., & Takada-Hidai, M. 2011, ApJ, 730, 77
- Honda et al. (2004) Honda, S., Aoki, W., Kajino, T., et al. 2004, ApJ, 607, 474
- Hunter (2007) Hunter, J. D. 2007, Computing in Science & Engineering, 9, 90
- Ivans et al. (2006) Ivans, I. I., Simmerer, J., Sneden, C., et al. 2006, ApJ, 645, 613
- Ivans et al. (2003) Ivans, I. I., Sneden, C., James, C. R., et al. 2003, ApJ, 592, 906
- Jacobson et al. (2015) Jacobson, H. R., Keller, S., Frebel, A., et al. 2015, ApJ, 807, 171
- Ji & Frebel (2018) Ji, A. P., & Frebel, A. 2018, ApJ, 856, 138
- Ji et al. (2016a) Ji, A. P., Frebel, A., Chiti, A., & Simon, J. D. 2016a, Nature, 531, 610
- Ji et al. (2016b) Ji, A. P., Frebel, A., Simon, J. D., & Chiti, A. 2016b, ApJ, 830, 93
- Johnson (2002) Johnson, J. A. 2002, ApJS, 139, 219
- Johnson & Bolte (2001) Johnson, J. A., & Bolte, M. 2001, The Astrophysical Journal, 554, 888
- Johnson & Bolte (2004) —. 2004, ApJ, 605, 462
- Jones et al. (2001) Jones, E., Oliphant, T., Peterson, P., et al. 2001, SciPy: Open source scientific tools for Python, ,
- Jonsell et al. (2006) Jonsell, K., Barklem, P. S., Gustafsson, B., et al. 2006, A&A, 451, 651
- Karakas & Lattanzio (2014) Karakas, A. I., & Lattanzio, J. C. 2014, Publications of the Astronomical Society of Australia, 31, e030
- Keeping (1962) Keeping, E. S. 1962, Introduction to Statistical Inference (Princeton, N.J., Van Nostrand)
- Kelson (2003) Kelson, D. D. 2003, PASP, 115, 688
- Kilpatrick et al. (2017) Kilpatrick, C. D., Foley, R. J., Kasen, D., et al. 2017, Science, 358, 1583
- Kirby et al. (2013) Kirby, E. N., Cohen, J. G., Guhathakurta, P., et al. 2013, ApJ, 779, 102
- Kratz et al. (2007) Kratz, K.-L., Farouqi, K., Pfeiffer, B., et al. 2007, ApJ, 662, 39
- Kunder et al. (2017) Kunder, A., Kordopatis, G., Steinmetz, M., et al. 2017, AJ, 153, 75
- Kurucz (1998) Kurucz, R. L. 1998, in IAU Symposium, Vol. 189, Fundamental Stellar Properties, ed. T. R. Bedding, A. J. Booth, & J. Davis, 217
- Lai et al. (2008) Lai, D. K., Bolte, M., Johnson, J. A., et al. 2008, ApJ, 681, 1524
- Li et al. (2015) Li, H.-N., Zhao, G., Christlieb, N., et al. 2015, ApJ, 798, 110
- Lind et al. (2011) Lind, K., Asplund, M., Barklem, P. S., & Belyaev, A. K. 2011, A&A, 528, A103
- Lindegren et al. (2018) Lindegren, L., Hernández, J., Bombrun, A., et al. 2018, A&A, 616, A2
- Marigo et al. (2017) Marigo, P., Girardi, L., Bressan, A., et al. 2017, ApJ, 835, 77
- Mashonkina et al. (2014) Mashonkina, L., Christlieb, N., & Eriksson, K. 2014, Astronomy and Astrophysics, 569, A43
- Masseron et al. (2006) Masseron, T., van Eck, S., Famaey, B., et al. 2006, A&A, 455, 1059
- Masseron et al. (2014) Masseron, T., Plez, B., Van Eck, S., et al. 2014, A&A, 571, A47
- McWilliam et al. (1995) McWilliam, A., Preston, G. W., Sneden, C., & Searle, L. 1995, AJ, 109, 2757
- Meléndez & Barbuy (2009) Meléndez, J., & Barbuy, B. 2009, A&A, 497, 611
- Meléndez et al. (2016) Meléndez, J., Placco, V. M., Tucci-Maia, M., et al. 2016, A&A, 585, L5
- Meyer et al. (1992) Meyer, B. S., Mathews, G. J., Howard, W. M., Woosley, S. E., & Hoffman, R. D. 1992, ApJ, 399, 656
- Nishimura et al. (2015) Nishimura, N., Takiwaki, T., & Thielemann, F.-K. 2015, ApJ, 810, 109
- O’Brian et al. (1991) O’Brian, T. R., Wickliffe, M. E., Lawler, J. E., Whaling, J. W., & Brault, W. 1991, Journal of the Optical Society of America B Optical Physics, 8, 1185
- Placco et al. (2013) Placco, V. M., Frebel, A., Beers, T. C., et al. 2013, ApJ, 770, 104
- Placco et al. (2014) Placco, V. M., Frebel, A., Beers, T. C., & Stancliffe, R. J. 2014, ApJ, 797, 21
- Placco et al. (2015) Placco, V. M., Beers, T. C., Ivans, I. I., et al. 2015, ApJ, 812, 109
- Placco et al. (2017) Placco, V. M., Holmbeck, E. M., Frebel, A., et al. 2017, ApJ, 844, 18
- Placco et al. (2018) Placco, V. M., Beers, T. C., Santucci, R. M., et al. 2018, AJ, 155, 256
- Preston & Sneden (2001) Preston, G. W., & Sneden, C. 2001, AJ, 122, 1545
- Preston et al. (2006) Preston, G. W., Sneden, C., Thompson, I. B., Shectman, S. A., & Burley, G. S. 2006, AJ, 132, 85
- Roederer et al. (2014a) Roederer, I. U., Cowan, J. J., Preston, G. W., et al. 2014a, MNRAS, 445, 2970
- Roederer et al. (2018a) Roederer, I. U., Hattori, K., & Valluri, M. 2018a, AJ, 156, 179
- Roederer et al. (2016) Roederer, I. U., Mateo, M., Bailey, J. I., et al. 2016, MNRAS, 455, 2417
- Roederer et al. (2014b) Roederer, I. U., Preston, G. W., Thompson, I. B., et al. 2014b, AJ, 147, 136
- Roederer et al. (2018b) Roederer, I. U., Sakari, C. M., Placco, V. M., et al. 2018b, ApJ, 865, 129
- Roederer et al. (2010) Roederer, I. U., Sneden, C., Thompson, I. B., Preston, G. W., & Shectman, S. A. 2010, ApJ, 711, 573
- Roederer et al. (2008) Roederer, I. U., Frebel, A., Shetrone, M. D., et al. 2008, ApJ, 679, 1549
- Ruffoni et al. (2014) Ruffoni, M. P., Den Hartog, E. A., Lawler, J. E., et al. 2014, MNRAS, 441, 3127
- Sakari et al. (2018) Sakari, C. M., Placco, V. M., Hansen, T., et al. 2018, ApJ, 854, L20
- Sakari et al. (2019) Sakari, C. M., Roederer, I. U., Placco, V. M., et al. 2019, ApJ, 874, 148
- Schatz et al. (2002) Schatz, H., Toenjes, R., Pfeiffer, B., et al. 2002, ApJ, 579, 626
- Shappee et al. (2017) Shappee, B. J., Simon, J. D., Drout, M. R., et al. 2017, Science, 358, 1574
- Siegel et al. (2019) Siegel, D. M., Barnes, J., & Metzger, B. D. 2019, Nature, 569, 241
- Siqueira Mello et al. (2012) Siqueira Mello, C., Barbuy, B., Spite, M., & Spite, F. 2012, A&A, 548, A42
- Siqueira Mello et al. (2014) Siqueira Mello, C., Hill, V., Barbuy, B., et al. 2014, A&A, 565, A93
- Skúladóttir et al. (2015) Skúladóttir, Á., Tolstoy, E., Salvadori, S., et al. 2015, A&A, 574, A129
- Sneden et al. (2008) Sneden, C., Cowan, J. J., & Gallino, R. 2008, ARA&A, 46, 241
- Sneden et al. (2016) Sneden, C., Cowan, J. J., Kobayashi, C., et al. 2016, ApJ, 817, 53
- Sneden et al. (2009) Sneden, C., Lawler, J. E., Cowan, J. J., Ivans, I. I., & Den Hartog, E. A. 2009, ApJS, 182, 80
- Sneden et al. (2014) Sneden, C., Lucatello, S., Ram, R. S., Brooke, J. S. A., & Bernath, P. 2014, ApJS, 214, 26
- Sneden et al. (1996) Sneden, C., McWilliam, A., Preston, G. W., et al. 1996, ApJ, 467, 819
- Sneden (1973) Sneden, C. A. 1973, PhD thesis, The University of Texas at Austin.
- Sobeck et al. (2011) Sobeck, J. S., Kraft, R. P., Sneden, C., et al. 2011, AJ, 141, 175
- Spite et al. (2014) Spite, M., Spite, F., Bonifacio, P., et al. 2014, A&A, 571, A40
- Surman et al. (2006) Surman, R., McLaughlin, G. C., & Hix, W. R. 2006, The Astrophysical Journal, 643, 1057
- Tody (1986) Tody, D. 1986, in Proc. SPIE, Vol. 627, Instrumentation in astronomy VI, ed. D. L. Crawford, 733
- Tody (1993) Tody, D. 1993, in Astronomical Society of the Pacific Conference Series, Vol. 52, Astronomical Data Analysis Software and Systems II, ed. R. J. Hanisch, R. J. V. Brissenden, & J. Barnes, 173
- Travaglio et al. (2004) Travaglio, C., Gallino, R., Arnone, E., et al. 2004, ApJ, 601, 864
- Truran et al. (2002) Truran, J. W., Cowan, J. J., Pilachowski, C. A., & Sneden, C. 2002, PASP, 114, 1293
- van der Walt et al. (2011) van der Walt, S., Colbert, S. C., & Varoquaux, G. 2011, Computing in Science & Engineering, 13, 22
- Vasiliev (2019) Vasiliev, E. 2019, MNRAS, 482, 1525
- Walker et al. (2016) Walker, M. G., Mateo, M., Olszewski, E. W., et al. 2016, ApJ, 819, 53
- Wanajo (2013) Wanajo, S. 2013, ApJ, 770, L22
- Wanajo & Ishimaru (2006) Wanajo, S., & Ishimaru, Y. 2006, Nuclear Physics A, 777, 676
- Wanajo et al. (2001) Wanajo, S., Kajino, T., Mathews, G. J., & Otsuki, K. 2001, ApJ, 554, 578
- Woosley & Hoffman (1992) Woosley, S. E., & Hoffman, R. D. 1992, ApJ, 395, 202
- Yong et al. (2013) Yong, D., Norris, J. E., Bessell, M. S., et al. 2013, ApJ, 762, 26
- Yuan et al. (2020) Yuan, Z., Myeong, G. C., Beers, T. C., et al. 2020, ApJ, 891, 1
| Element | EP | gf | EW | (X) | |
|---|---|---|---|---|---|
| [Å] | [eV] | [mÅ] | |||
| CH | 4312 | … | … | syn | 6.20 |
| Na i | 5889.95 | 0.00 | 0.11 | 121.0 | 3.69 |
| Na i | 5895.92 | 0.00 | 0.19 | 89.7 | 3.54 |
| Mg i | 3986.75 | 4.35 | 1.03 | 12.9 | 5.25 |
| Mg i | 4057.51 | 4.35 | 0.89 | 11.0 | 5.03 |
| Mg i | 4167.27 | 4.35 | 0.71 | 23.2 | 5.22 |
| Mg i | 4702.99 | 4.33 | 0.38 | 35.9 | 5.10 |
| Mg i | 5528.40 | 4.34 | 0.50 | 32.7 | 5.16 |
| Mg i | 5711.09 | 4.34 | 1.72 | 3.4 | 5.30 |
| Al i | 3944.00 | 0.00 | syn | 2.93 | |
| Al i | 3961.52 | 0.01 | 0.34 | 79.4 | 2.88 |
| Si i | 3906.52 | 1.91 | 1.09 | syn | 4.79 |
| Ca i | 4283.01 | 1.89 | 0.22 | 20.2 | 3.86 |
| Ca i | 4318.65 | 1.89 | 0.21 | 21.8 | 3.89 |
| Ca i | 4425.44 | 1.88 | 0.36 | 13.8 | 3.79 |
| Ca i | 4434.96 | 1.89 | 0.01 | 27.9 | 3.81 |
| Ca i | 4454.78 | 1.90 | 0.26 | 61.1 | 4.07 |
| Ca i | 4455.89 | 1.90 | 0.53 | 9.7 | 3.81 |
| Ca i | 5265.56 | 2.52 | 0.26 | 11.0 | 4.17 |
| Ca i | 5594.47 | 2.52 | 0.10 | 16.1 | 3.99 |
| Ca i | 5598.49 | 2.52 | 0.09 | 6.1 | 3.71 |
| Ca i | 5857.45 | 2.93 | 0.23 | 5.5 | 3.72 |
| Ca i | 6102.72 | 1.88 | 0.79 | 7.8 | 3.90 |
| Ca i | 6122.22 | 1.89 | 0.32 | 18.5 | 3.85 |
| Ca i | 6162.17 | 1.90 | 0.09 | 28.9 | 3.87 |
| Ca i | 6439.07 | 2.52 | 0.47 | 20.1 | 3.71 |
| Sc ii | 4246.81 | 0.32 | 0.24 | 107.4 | 0.56 |
| Sc ii | 4314.08 | 0.62 | 0.10 | 52.1 | 0.40 |
| Sc ii | 4324.98 | 0.59 | 0.44 | 29.2 | 0.36 |
| Sc ii | 4400.38 | 0.60 | 0.54 | 26.3 | 0.41 |
| Sc ii | 4415.54 | 0.59 | 0.67 | 22.9 | 0.46 |
| Sc ii | 5031.01 | 1.36 | 0.40 | 8.0 | 0.39 |
| Sc ii | 5526.77 | 1.77 | 0.02 | 7.6 | 0.32 |
| Sc ii | 5657.89 | 1.51 | 0.60 | 5.6 | 0.54 |
| Ti i | 3989.76 | 0.02 | 0.13 | 19.8 | 2.68 |
| Ti i | 3998.64 | 0.05 | 0.02 | 13.5 | 2.37 |
| Ti i | 4533.24 | 0.85 | 0.54 | 11.1 | 2.49 |
| Ti i | 4534.78 | 0.83 | 0.35 | 9.8 | 2.61 |
| Ti i | 4981.73 | 0.85 | 0.57 | 9.8 | 2.38 |
| Ti i | 4991.07 | 0.83 | 0.45 | 16.3 | 2.73 |
| Ti i | 4999.50 | 0.82 | 0.32 | 15.3 | 2.82 |
| Ti i | 5007.21 | 0.82 | 0.17 | 9.4 | 2.73 |
| Ti ii | 3489.74 | 0.14 | 2.00 | 39.7 | 2.29 |
| Ti ii | 3491.05 | 0.11 | 1.10 | 96.0 | 2.40 |
| Ti ii | 3913.46 | 1.11 | 0.36 | 124.2 | 2.76 |
| Ti ii | 4025.13 | 0.61 | 2.11 | 23.9 | 2.35 |
| Ti ii | 4028.34 | 1.89 | 0.92 | 33.0 | 2.59 |
| Ti ii | 4053.82 | 1.89 | 1.07 | 10.7 | 2.16 |
| Ti ii | 4163.64 | 2.59 | 0.13 | 34.4 | 2.48 |
| Ti ii | 4290.22 | 1.16 | 0.87 | 71.3 | 2.35 |
| Ti ii | 4300.04 | 1.18 | 0.46 | 102.1 | 2.41 |
| Ti ii | 4337.91 | 1.08 | 0.96 | 67.9 | 2.31 |
| Ti ii | 4394.06 | 1.22 | 1.77 | 15.9 | 2.37 |
| Ti ii | 4395.03 | 1.08 | 0.54 | 112.7 | 2.56 |
| Ti ii | 4395.84 | 1.24 | 1.93 | 13.2 | 2.46 |
| Ti ii | 4399.77 | 1.24 | 1.19 | 41.7 | 2.33 |
| Ti ii | 4417.71 | 1.17 | 1.19 | 56.0 | 2.45 |
| Ti ii | 4418.33 | 1.24 | 1.99 | 13.3 | 2.51 |
| Ti ii | 4441.73 | 1.18 | 2.41 | 7.1 | 2.58 |
| Ti ii | 4443.80 | 1.08 | 0.71 | 97.2 | 2.46 |
| Ti ii | 4450.48 | 1.08 | 1.52 | 37.8 | 2.44 |
| Ti ii | 4464.45 | 1.16 | 1.81 | 19.1 | 2.43 |
| Ti ii | 4468.49 | 1.13 | 0.63 | 103.3 | 2.53 |
| Ti ii | 4501.27 | 1.11 | 0.77 | 90.2 | 2.44 |
| Ti ii | 4533.96 | 1.24 | 0.53 | 99.2 | 2.46 |
| Ti ii | 4563.77 | 1.22 | 0.96 | 78.1 | 2.56 |
| Ti ii | 4571.97 | 1.57 | 0.31 | 96.3 | 2.52 |
| Ti ii | 4589.91 | 1.24 | 1.79 | 20.3 | 2.51 |
| Ti ii | 4657.20 | 1.24 | 2.29 | 8.2 | 2.58 |
| Ti ii | 4708.66 | 1.24 | 2.35 | 4.6 | 2.37 |
| Ti ii | 4779.98 | 2.05 | 1.37 | 16.5 | 2.77 |
| Ti ii | 4798.53 | 1.08 | 2.68 | 5.2 | 2.59 |
| Ti ii | 4805.09 | 2.06 | 1.10 | 20.4 | 2.62 |
| Ti ii | 5129.16 | 1.89 | 1.34 | 12.4 | 2.43 |
| Ti ii | 5185.90 | 1.89 | 1.41 | 8.8 | 2.34 |
| Ti ii | 5188.69 | 1.58 | 1.05 | 31.9 | 2.31 |
| Ti ii | 5226.54 | 1.57 | 1.26 | 20.7 | 2.28 |
| Ti ii | 5336.79 | 1.58 | 1.60 | 14.8 | 2.46 |
| Ti ii | 5381.02 | 1.56 | 1.97 | 13.1 | 2.75 |
| V ii | 3951.41 | 1.48 | 0.78 | syn | 1.31 |
| V ii | 4005.71 | 1.82 | 1.52 | syn | 1.32 |
| Cr i | 3578.68 | 0.00 | 0.42 | 74.9 | 2.56 |
| Cr i | 4254.33 | 0.00 | 0.09 | 65.4 | 2.54 |
| Cr i | 4274.80 | 0.00 | 0.22 | 58.4 | 2.57 |
| Cr i | 4289.72 | 0.00 | 0.37 | 52.7 | 2.64 |
| Cr i | 5206.04 | 0.94 | 0.02 | 28.7 | 2.73 |
| Cr i | 5208.42 | 0.94 | 0.17 | 35.2 | 2.70 |
| Cr i | 5409.77 | 1.03 | 0.67 | 4.6 | 2.61 |
| Mn i | 4030.75 | 0.00 | 0.50 | syn | 1.92 |
| Mn i | 4033.06 | 0.00 | 0.65 | syn | 1.86 |
| Mn i | 4034.48 | 0.00 | 0.84 | syn | 1.81 |
| Mn i | 4041.35 | 2.11 | 0.28 | syn | 1.98 |
| Fe i | 3417.84 | 2.22 | 0.68 | 22.6 | 4.55 |
| Fe i | 3476.70 | 0.12 | 1.51 | 104.1 | 4.96 |
| Fe i | 3497.84 | 0.11 | 1.55 | 95.8 | 4.78 |
| Fe i | 3521.26 | 0.91 | 0.99 | 61.4 | 4.29 |
| Fe i | 3558.52 | 0.99 | 0.63 | 107.9 | 5.03 |
| Fe i | 3608.86 | 1.01 | 0.09 | 114.1 | 4.67 |
| Fe i | 3610.16 | 2.81 | 0.12 | 38.8 | 4.65 |
| Fe i | 3709.25 | 0.91 | 0.62 | 110.1 | 4.50 |
| Fe i | 3727.62 | 0.96 | 0.61 | 117.8 | 4.69 |
| Fe i | 3742.62 | 2.94 | 0.81 | 13.5 | 4.88 |
| Fe i | 3765.54 | 3.24 | 0.48 | 55.6 | 4.70 |
| Fe i | 3787.88 | 1.01 | 0.84 | 100.5 | 4.58 |
| Fe i | 3790.09 | 0.99 | 1.74 | 39.4 | 4.51 |
| Fe i | 3795.00 | 0.99 | 0.74 | 108.5 | 4.63 |
| Fe i | 3805.34 | 3.30 | 0.31 | 66.3 | 5.07 |
| Fe i | 3812.97 | 0.96 | 1.05 | 106.4 | 4.86 |
| Fe i | 3816.34 | 2.20 | 1.20 | 9.2 | 4.37 |
| Fe i | 3841.05 | 1.61 | 0.04 | 113.9 | 4.64 |
| Fe i | 3846.80 | 3.25 | 0.02 | 28.9 | 4.77 |
| Fe i | 3849.97 | 1.01 | 0.86 | 108.1 | 4.75 |
| Fe i | 3865.52 | 1.01 | 0.95 | 103.5 | 4.74 |
| Fe i | 3867.22 | 3.02 | 0.45 | 16.2 | 4.67 |
| Fe i | 3872.50 | 0.99 | 0.89 | 102.5 | 4.63 |
| Fe i | 3878.02 | 0.96 | 0.90 | 107.7 | 4.71 |
| Fe i | 3887.05 | 0.91 | 1.14 | 81.1 | 4.43 |
| Fe i | 3895.66 | 0.11 | 1.67 | 112.8 | 4.75 |
| Fe i | 3898.01 | 1.01 | 2.04 | 39.6 | 4.82 |
| Fe i | 3902.95 | 1.56 | 0.44 | 93.7 | 4.58 |
| Fe i | 3917.18 | 0.99 | 2.15 | 23.5 | 4.62 |
| Fe i | 3920.26 | 0.12 | 1.73 | 108.5 | 4.73 |
| Fe i | 3940.88 | 0.96 | 2.60 | 11.7 | 4.68 |
| Fe i | 3949.95 | 2.18 | 1.25 | 10.9 | 4.48 |
| Fe i | 3977.74 | 2.20 | 1.12 | 19.2 | 4.64 |
| Fe i | 4005.24 | 1.56 | 0.58 | 92.9 | 4.68 |
| Fe i | 4009.71 | 2.22 | 1.25 | 14.6 | 4.65 |
| Fe i | 4014.53 | 3.05 | 0.59 | 21.2 | 4.97 |
| Fe i | 4067.98 | 3.21 | 0.53 | 15.0 | 4.88 |
| Fe i | 4071.74 | 1.61 | 0.01 | 120.8 | 4.68 |
| Fe i | 4076.63 | 3.21 | 0.59 | 19.8 | 5.08 |
| Fe i | 4084.49 | 3.33 | 0.54 | 7.3 | 4.66 |
| Fe i | 4132.06 | 1.61 | 0.68 | 96.1 | 4.86 |
| Fe i | 4132.90 | 2.85 | 1.01 | 8.6 | 4.75 |
| Fe i | 4134.68 | 2.83 | 0.65 | 19.4 | 4.77 |
| Fe i | 4137.00 | 3.42 | 0.45 | 10.3 | 4.81 |
| Fe i | 4143.87 | 1.56 | 0.51 | 97.5 | 4.67 |
| Fe i | 4147.67 | 1.48 | 2.07 | 13.5 | 4.71 |
| Fe i | 4153.90 | 3.40 | 0.28 | 9.9 | 4.61 |
| Fe i | 4156.80 | 2.83 | 0.81 | 13.1 | 4.73 |
| Fe i | 4157.78 | 3.42 | 0.40 | 10.9 | 4.79 |
| Fe i | 4172.75 | 0.96 | 3.02 | 5.2 | 4.70 |
| Fe i | 4175.64 | 2.85 | 0.83 | 21.2 | 5.00 |
| Fe i | 4181.76 | 2.83 | 0.37 | 29.3 | 4.70 |
| Fe i | 4184.89 | 2.83 | 0.87 | 12.0 | 4.75 |
| Fe i | 4187.04 | 2.45 | 0.56 | 39.2 | 4.70 |
| Fe i | 4187.80 | 2.42 | 0.51 | 37.1 | 4.59 |
| Fe i | 4191.43 | 2.47 | 0.67 | 33.7 | 4.74 |
| Fe i | 4199.10 | 3.05 | 0.16 | 43.0 | 4.62 |
| Fe i | 4202.03 | 1.49 | 0.69 | 92.7 | 4.68 |
| Fe i | 4216.18 | 0.00 | 3.36 | 16.8 | 4.64 |
| Fe i | 4217.55 | 3.43 | 0.48 | 11.5 | 4.91 |
| Fe i | 4222.21 | 2.45 | 0.91 | 17.7 | 4.61 |
| Fe i | 4227.43 | 3.33 | 0.27 | 41.3 | 4.75 |
| Fe i | 4233.60 | 2.48 | 0.60 | 30.0 | 4.61 |
| Fe i | 4238.81 | 3.40 | 0.23 | 16.1 | 4.79 |
| Fe i | 4250.12 | 2.47 | 0.38 | 45.3 | 4.63 |
| Fe i | 4250.79 | 1.56 | 0.71 | 86.3 | 4.67 |
| Fe i | 4260.47 | 2.40 | 0.08 | 80.9 | 4.62 |
| Fe i | 4271.15 | 2.45 | 0.34 | 48.3 | 4.61 |
| Fe i | 4271.76 | 1.49 | 0.17 | 130.9 | 4.89 |
| Fe i | 4282.40 | 2.18 | 0.78 | 46.6 | 4.76 |
| Fe i | 4325.76 | 1.61 | 0.01 | 133.0 | 4.87 |
| Fe i | 4352.73 | 2.22 | 1.29 | 15.8 | 4.70 |
| Fe i | 4375.93 | 0.00 | 3.00 | 37.7 | 4.71 |
| Fe i | 4404.75 | 1.56 | 0.15 | 127.4 | 4.84 |
| Fe i | 4415.12 | 1.61 | 0.62 | 90.0 | 4.66 |
| Fe i | 4427.31 | 0.05 | 2.92 | 37.2 | 4.67 |
| Fe i | 4442.34 | 2.20 | 1.23 | 18.4 | 4.69 |
| Fe i | 4447.72 | 2.22 | 1.34 | 12.5 | 4.63 |
| Fe i | 4459.12 | 2.18 | 1.28 | 15.8 | 4.64 |
| Fe i | 4461.65 | 0.09 | 3.19 | 22.0 | 4.68 |
| Fe i | 4466.55 | 2.83 | 0.60 | 19.4 | 4.69 |
| Fe i | 4476.02 | 2.85 | 0.82 | 13.0 | 4.73 |
| Fe i | 4489.74 | 0.12 | 3.90 | 2.4 | 4.39 |
| Fe i | 4494.56 | 2.20 | 1.14 | 20.5 | 4.66 |
| Fe i | 4528.61 | 2.18 | 0.82 | 44.2 | 4.75 |
| Fe i | 4531.15 | 1.48 | 2.10 | 12.6 | 4.67 |
| Fe i | 4602.94 | 1.49 | 2.21 | 8.8 | 4.61 |
| Fe i | 4736.77 | 3.21 | 0.67 | 9.2 | 4.75 |
| Fe i | 4871.32 | 2.87 | 0.34 | 23.0 | 4.54 |
| Fe i | 4872.14 | 2.88 | 0.57 | 16.7 | 4.62 |
| Fe i | 4890.76 | 2.88 | 0.38 | 30.7 | 4.75 |
| Fe i | 4891.49 | 2.85 | 0.11 | 37.2 | 4.57 |
| Fe i | 4903.31 | 2.88 | 0.89 | 8.7 | 4.62 |
| Fe i | 4918.99 | 2.85 | 0.34 | 23.9 | 4.54 |
| Fe i | 4920.50 | 2.83 | 0.07 | 55.9 | 4.64 |
| Fe i | 4938.81 | 2.88 | 1.08 | 4.6 | 4.51 |
| Fe i | 4994.13 | 0.92 | 2.97 | 12.1 | 4.94 |
| Fe i | 5001.87 | 3.88 | 0.01 | 10.0 | 4.76 |
| Fe i | 5006.12 | 2.83 | 0.61 | 16.7 | 4.61 |
| Fe i | 5012.07 | 0.86 | 2.64 | 17.4 | 4.73 |
| Fe i | 5041.07 | 0.96 | 3.09 | 9.1 | 4.96 |
| Fe i | 5049.82 | 2.28 | 1.35 | 13.0 | 4.69 |
| Fe i | 5079.74 | 0.99 | 3.25 | 7.4 | 5.05 |
| Fe i | 5083.34 | 0.96 | 2.84 | 6.2 | 4.54 |
| Fe i | 5110.41 | 0.00 | 3.76 | 13.3 | 4.86 |
| Fe i | 5123.72 | 1.01 | 3.06 | 13.9 | 5.18 |
| Fe i | 5133.69 | 4.17 | 0.36 | 9.8 | 4.66 |
| Fe i | 5151.91 | 1.01 | 3.32 | 3.6 | 4.82 |
| Fe i | 5162.27 | 4.18 | 0.02 | 5.9 | 4.76 |
| Fe i | 5171.60 | 1.49 | 1.72 | 23.0 | 4.56 |
| Fe i | 5191.45 | 3.04 | 0.55 | 34.2 | 5.13 |
| Fe i | 5227.19 | 1.56 | 1.23 | 53.7 | 4.65 |
| Fe i | 5232.94 | 2.94 | 0.06 | 38.5 | 4.61 |
| Fe i | 5266.56 | 3.00 | 0.39 | 18.7 | 4.59 |
| Fe i | 5269.54 | 0.86 | 1.33 | 96.6 | 4.67 |
| Fe i | 5281.79 | 3.04 | 0.83 | 9.1 | 4.73 |
| Fe i | 5302.30 | 3.28 | 0.73 | 10.2 | 4.91 |
| Fe i | 5324.18 | 3.21 | 0.11 | 22.1 | 4.60 |
| Fe i | 5328.04 | 0.92 | 1.47 | 83.2 | 4.65 |
| Fe i | 5328.53 | 1.56 | 1.85 | 25.7 | 4.81 |
| Fe i | 5339.93 | 3.27 | 0.63 | 5.8 | 4.54 |
| Fe i | 5364.87 | 4.45 | 0.23 | 4.6 | 4.70 |
| Fe i | 5367.47 | 4.42 | 0.44 | 6.2 | 4.59 |
| Fe i | 5369.96 | 4.37 | 0.54 | 11.8 | 4.75 |
| Fe i | 5371.49 | 0.96 | 1.64 | 70.4 | 4.69 |
| Fe i | 5383.37 | 4.31 | 0.65 | 16.1 | 4.74 |
| Fe i | 5393.17 | 3.24 | 0.91 | 7.7 | 4.92 |
| Fe i | 5397.13 | 0.92 | 1.98 | 44.9 | 4.64 |
| Fe i | 5405.77 | 0.99 | 1.85 | 48.4 | 4.63 |
| Fe i | 5410.91 | 4.47 | 0.40 | 7.6 | 4.77 |
| Fe i | 5415.20 | 4.39 | 0.64 | 13.1 | 4.71 |
| Fe i | 5424.07 | 4.32 | 0.52 | 14.6 | 4.82 |
| Fe i | 5429.70 | 0.96 | 1.88 | 50.9 | 4.67 |
| Fe i | 5434.52 | 1.01 | 2.13 | 30.0 | 4.63 |
| Fe i | 5446.92 | 0.99 | 1.91 | 46.2 | 4.66 |
| Fe i | 5497.52 | 1.01 | 2.83 | 14.5 | 4.95 |
| Fe i | 5506.78 | 0.99 | 2.79 | 12.9 | 4.83 |
| Fe i | 5572.84 | 3.40 | 0.28 | 12.8 | 4.67 |
| Fe i | 5586.76 | 3.37 | 0.11 | 14.8 | 4.54 |
| Fe i | 5615.64 | 3.33 | 0.04 | 21.4 | 4.54 |
| Fe i | 5624.54 | 3.42 | 0.76 | 3.4 | 4.56 |
| Fe i | 5709.38 | 3.37 | 1.01 | 5.2 | 4.95 |
| Fe i | 6065.48 | 2.61 | 1.41 | 5.9 | 4.66 |
| Fe i | 6136.61 | 2.45 | 1.41 | 6.8 | 4.57 |
| Fe i | 6191.56 | 2.43 | 1.42 | 7.7 | 4.61 |
| Fe i | 6230.72 | 2.56 | 1.28 | 6.7 | 4.53 |
| Fe i | 6252.56 | 2.40 | 1.69 | 6.3 | 4.76 |
| Fe i | 6393.60 | 2.43 | 1.58 | 4.7 | 4.54 |
| Fe i | 6400.00 | 3.60 | 0.27 | 8.7 | 4.65 |
| Fe i | 6592.91 | 2.73 | 1.47 | 7.9 | 4.95 |
| Fe i | 6677.99 | 2.69 | 1.42 | 6.0 | 4.73 |
| Fe i | 7495.07 | 4.22 | 0.10 | 4.7 | 4.76 |
| Fe i | 8387.77 | 2.17 | 1.51 | 18.6 | 4.76 |
| Fe i | 8688.62 | 2.17 | 1.20 | 50.9 | 5.01 |
| Fe ii | 4178.86 | 2.58 | 2.51 | 31.7 | 4.72 |
| Fe ii | 4233.17 | 2.58 | 1.97 | 70.7 | 4.75 |
| Fe ii | 4416.82 | 2.78 | 2.65 | 24.0 | 4.88 |
| Fe ii | 4489.19 | 2.83 | 2.96 | 10.2 | 4.80 |
| Fe ii | 4491.41 | 2.86 | 2.71 | 13.8 | 4.73 |
| Fe ii | 4508.28 | 2.86 | 2.44 | 25.4 | 4.77 |
| Fe ii | 4515.34 | 2.84 | 2.60 | 20.9 | 4.81 |
| Fe ii | 4520.22 | 2.81 | 2.65 | 18.6 | 4.77 |
| Fe ii | 4555.89 | 2.83 | 2.40 | Fe i | 4.71 |
| Fe ii | 4576.34 | 2.84 | 2.95 | 8.4 | 4.71 |
| Fe ii | 4582.84 | 2.84 | 3.18 | 4.6 | 4.67 |
| Fe ii | 4583.84 | 2.81 | 1.93 | 60.6 | 4.77 |
| Fe ii | 4620.52 | 2.83 | 3.21 | 3.5 | 4.57 |
| Fe ii | 4923.93 | 2.89 | 1.26 | 91.7 | 4.60 |
| Fe ii | 5018.45 | 2.89 | 1.10 | 102.9 | 4.61 |
| Fe ii | 5169.03 | 2.89 | 1.00 | 122.8 | 4.85 |
| Fe ii | 5197.58 | 3.23 | 2.22 | 16.4 | 4.65 |
| Fe ii | 5234.63 | 3.22 | 2.18 | 24.5 | 4.81 |
| Fe ii | 5276.00 | 3.20 | 2.01 | 26.7 | 4.67 |
| Fe ii | 5316.62 | 3.15 | 1.87 | 45.1 | 4.79 |
| Fe ii | 5534.83 | 3.25 | 2.75 | 4.1 | 4.54 |
| Co i | 3873.12 | 0.43 | 0.66 | syn | 2.32 |
| Co i | 3995.31 | 0.92 | 0.22 | syn | 2.29 |
| Co i | 4020.83 | 3.66 | 0.96 | syn | 2.43 |
| Co i | 4121.31 | 0.92 | 0.32 | syn | 2.23 |
| Ni i | 3423.71 | 0.21 | 0.71 | 73.6 | 3.23 |
| Ni i | 3433.56 | 0.03 | 0.67 | 97.5 | 3.55 |
| Ni i | 3452.89 | 0.11 | 0.90 | 88.0 | 3.63 |
| Ni i | 3472.54 | 0.11 | 0.79 | 76.5 | 3.26 |
| Ni i | 3483.78 | 0.28 | 1.11 | 48.7 | 3.23 |
| Ni i | 3492.96 | 0.11 | 0.27 | 94.7 | 3.15 |
| Ni i | 3500.85 | 0.17 | 1.27 | 53.9 | 3.36 |
| Ni i | 3519.76 | 0.28 | 1.44 | 51.0 | 3.59 |
| Ni i | 3566.37 | 0.42 | 0.25 | 84.3 | 3.18 |
| Ni i | 3597.70 | 0.21 | 1.10 | 59.6 | 3.33 |
| Ni i | 3783.53 | 0.42 | 1.40 | 57.6 | 3.55 |
| Ni i | 3807.14 | 0.42 | 1.23 | 63.6 | 3.46 |
| Ni i | 3858.30 | 0.42 | 0.96 | 81.8 | 3.46 |
| Ni i | 5476.90 | 1.82 | 0.78 | 21.8 | 3.58 |
| Zn i | 4810.53 | 4.08 | 0.15 | 2.7 | 1.80 |
| Sr ii | 4161.79 | 0.60 | 2.94 | syn | 1.24 |
| Y ii | 3611.04 | 0.13 | 0.11 | syn | 0.53 |
| Y ii | 3710.29 | 0.18 | 0.46 | syn | 0.66 |
| Y ii | 4398.01 | 0.13 | 1.00 | syn | 0.45 |
| Y ii | 4682.73 | 0.41 | 1.51 | syn | 0.42 |
| Y ii | 4854.87 | 0.99 | 0.38 | syn | 0.45 |
| Y ii | 4883.68 | 1.08 | 0.07 | syn | 0.53 |
| Y ii | 4900.11 | 1.03 | 0.09 | syn | 0.35 |
| Y ii | 5087.42 | 1.08 | 0.17 | syn | 0.42 |
| Y ii | 5199.11 | 0.99 | 1.36 | syn | 0.26 |
| Y ii | 5205.73 | 1.03 | 1.34 | syn | 0.39 |
| Zr ii | 3479.02 | 0.53 | 0.69 | syn | 0.88 |
| Zr ii | 3499.57 | 0.41 | 0.81 | syn | 1.02 |
| Zr ii | 4050.33 | 0.71 | 1.00 | syn | 1.14 |
| Zr ii | 4149.20 | 0.80 | 0.03 | syn | 1.21 |
| Zr ii | 4161.21 | 0.71 | 0.72 | syn | 1.32 |
| Zr ii | 4208.99 | 0.71 | 0.46 | syn | 1.09 |
| Zr ii | 4317.32 | 0.71 | 1.38 | syn | 1.18 |
| Zr ii | 4613.95 | 0.97 | 1.52 | syn | 1.22 |
| Ru i | 3728.03 | 0.00 | 0.27 | syn | 0.89 |
| Ba ii | 4130.65 | 2.72 | 0.68 | syn | 0.63 |
| Ba ii | 5853.69 | 0.60 | 0.91 | syn | 0.84 |
| La ii | 3794.77 | 0.24 | 0.21 | syn | 0.00 |
| La ii | 3849.01 | 0.00 | 0.45 | syn | 0.13 |
| La ii | 3929.21 | 0.17 | 0.32 | syn | 0.02 |
| La ii | 3949.10 | 0.00 | 0.49 | syn | 0.04 |
| La ii | 3988.51 | 0.40 | 0.21 | syn | 0.10 |
| La ii | 4086.71 | 0.00 | 0.07 | syn | 0.19 |
| La ii | 4123.22 | 0.32 | 0.13 | syn | 0.09 |
| La ii | 4141.72 | 0.40 | 0.66 | syn | 0.06 |
| La ii | 4322.51 | 0.17 | 0.93 | syn | 0.17 |
| La ii | 4333.75 | 0.17 | 0.06 | syn | 0.10 |
| La ii | 4429.91 | 0.23 | 0.35 | syn | 0.09 |
| La ii | 4526.12 | 0.77 | 0.59 | syn | 0.05 |
| La ii | 4574.88 | 0.17 | 1.08 | syn | 0.08 |
| La ii | 4662.51 | 0.00 | 1.24 | syn | 0.22 |
| La ii | 4748.73 | 0.93 | 0.54 | syn | 0.12 |
| La ii | 4921.78 | 0.24 | 0.45 | syn | 0.15 |
| La ii | 5114.56 | 0.23 | 1.03 | syn | 0.25 |
| La ii | 5122.99 | 0.32 | 0.85 | syn | 0.19 |
| Ce ii | 3942.15 | 0.00 | 0.22 | 31.4 | 0.58 |
| Ce ii | 3942.74 | 0.86 | 0.69 | 26.4 | 0.42 |
| Ce ii | 4083.22 | 0.70 | 0.27 | 17.2 | 0.45 |
| Ce ii | 4120.83 | 0.32 | 0.37 | 10.3 | 0.46 |
| Ce ii | 4127.36 | 0.68 | 0.31 | 16.4 | 0.36 |
| Ce ii | 4137.65 | 0.52 | 0.40 | 32.4 | 0.47 |
| Ce ii | 4142.40 | 0.70 | 0.22 | 14.1 | 0.39 |
| Ce ii | 4145.00 | 0.70 | 0.10 | 12.1 | 0.43 |
| Ce ii | 4222.60 | 0.12 | 0.15 | 23.3 | 0.43 |
| Ce ii | 4364.65 | 0.49 | 0.17 | 7.7 | 0.27 |
| Ce ii | 4382.16 | 0.68 | 0.13 | 11.5 | 0.34 |
| Ce ii | 4399.20 | 0.33 | 0.44 | 6.0 | 0.25 |
| Ce ii | 4449.33 | 0.61 | 0.04 | 13.2 | 0.41 |
| Ce ii | 4486.91 | 0.29 | 0.18 | 14.0 | 0.35 |
| Ce ii | 4523.07 | 0.52 | 0.08 | 22.6 | 0.71 |
| Ce ii | 4560.28 | 0.91 | 0.18 | 12.4 | 0.54 |
| Ce ii | 4560.96 | 0.68 | 0.26 | 6.1 | 0.42 |
| Ce ii | 4562.36 | 0.48 | 0.21 | 23.4 | 0.39 |
| Ce ii | 4593.93 | 0.70 | 0.07 | 13.3 | 0.47 |
| Ce ii | 4628.16 | 0.52 | 0.14 | 19.7 | 0.41 |
| Pr ii | 4062.81 | 0.42 | 0.33 | syn | 0.06 |
| Pr ii | 4143.13 | 0.37 | 0.60 | syn | 0.16 |
| Pr ii | 4164.16 | 0.20 | 0.17 | syn | 0.25 |
| Pr ii | 4179.39 | 0.20 | 0.48 | syn | 0.21 |
| Pr ii | 4189.48 | 0.37 | 0.38 | syn | 0.18 |
| Pr ii | 4222.95 | 0.06 | 0.27 | syn | 0.17 |
| Pr ii | 4408.82 | 0.00 | 0.18 | syn | 0.22 |
| Pr ii | 4449.83 | 0.20 | 0.26 | syn | 0.02 |
| Nd ii | 3784.24 | 0.38 | 0.15 | 28.8 | 0.38 |
| Nd ii | 3927.10 | 0.18 | 0.59 | 10.9 | 0.41 |
| Nd ii | 3990.10 | 0.47 | 0.13 | 31.0 | 0.51 |
| Nd ii | 4007.43 | 0.47 | 0.40 | 9.8 | 0.45 |
| Nd ii | 4012.70 | 0.00 | 0.60 | 18.5 | 0.49 |
| Nd ii | 4021.33 | 0.32 | 0.10 | 20.5 | 0.36 |
| Nd ii | 4023.00 | 0.56 | 0.04 | 27.2 | 0.61 |
| Nd ii | 4043.59 | 0.32 | 0.71 | 6.2 | 0.39 |
| Nd ii | 4051.14 | 0.38 | 0.30 | 14.6 | 0.44 |
| Nd ii | 4059.95 | 0.20 | 0.52 | 10.3 | 0.32 |
| Nd ii | 4061.08 | 0.47 | 0.55 | 54.7 | 0.46 |
| Nd ii | 4069.26 | 0.06 | 0.57 | 15.5 | 0.42 |
| Nd ii | 4109.45 | 0.32 | 0.35 | 50.6 | 0.44 |
| Nd ii | 4133.35 | 0.32 | 0.49 | 10.5 | 0.41 |
| Nd ii | 4135.32 | 0.63 | 0.07 | 21.0 | 0.64 |
| Nd ii | 4211.29 | 0.20 | 0.86 | 6.1 | 0.40 |
| Nd ii | 4232.37 | 0.06 | 0.47 | 20.7 | 0.46 |
| Nd ii | 4284.51 | 0.63 | 0.17 | 11.7 | 0.43 |
| Nd ii | 4351.28 | 0.18 | 0.61 | 15.0 | 0.54 |
| Nd ii | 4358.16 | 0.32 | 0.16 | 21.0 | 0.39 |
| Nd ii | 4368.63 | 0.06 | 0.81 | 9.2 | 0.39 |
| Nd ii | 4385.66 | 0.20 | 0.30 | 22.5 | 0.45 |
| Nd ii | 4400.82 | 0.06 | 0.60 | 10.1 | 0.21 |
| Nd ii | 4446.38 | 0.20 | 0.35 | 18.1 | 0.38 |
| Nd ii | 4462.98 | 0.56 | 0.04 | 22.0 | 0.45 |
| Nd ii | 4465.06 | 0.00 | 1.36 | 4.2 | 0.51 |
| Nd ii | 4501.81 | 0.20 | 0.69 | 9.8 | 0.42 |
| Nd ii | 4542.60 | 0.74 | 0.28 | 7.0 | 0.39 |
| Nd ii | 4563.22 | 0.18 | 0.88 | 10.3 | 0.61 |
| Nd ii | 4567.61 | 0.20 | 1.31 | 3.7 | 0.59 |
| Nd ii | 4645.76 | 0.56 | 0.76 | 3.7 | 0.39 |
| Nd ii | 4706.54 | 0.00 | 0.71 | 14.0 | 0.39 |
| Nd ii | 4709.72 | 0.18 | 0.97 | 7.6 | 0.54 |
| Nd ii | 4715.59 | 0.20 | 0.90 | 5.3 | 0.33 |
| Nd ii | 4820.34 | 0.20 | 0.92 | 8.3 | 0.55 |
| Nd ii | 4825.48 | 0.18 | 0.42 | 16.6 | 0.35 |
| Nd ii | 4914.38 | 0.38 | 0.70 | 6.4 | 0.38 |
| Nd ii | 4959.12 | 0.06 | 0.80 | 10.3 | 0.38 |
| Nd ii | 5092.79 | 0.38 | 0.61 | 14.1 | 0.64 |
| Nd ii | 5130.59 | 1.30 | 0.45 | 14.5 | 0.52 |
| Nd ii | 5234.19 | 0.55 | 0.51 | 10.6 | 0.57 |
| Nd ii | 5249.58 | 0.97 | 0.20 | 12.6 | 0.37 |
| Nd ii | 5255.51 | 0.20 | 0.67 | 9.8 | 0.34 |
| Nd ii | 5273.43 | 0.68 | 0.18 | 12.8 | 0.46 |
| Nd ii | 5293.16 | 0.82 | 0.10 | 17.2 | 0.47 |
| Nd ii | 5319.81 | 0.55 | 0.14 | 22.7 | 0.57 |
| Sm ii | 3568.89 | 0.00 | syn | 0.11 | |
| Sm ii | 4065.01 | 0.04 | 2.34 | syn | 0.07 |
| Sm ii | 4511.83 | 0.18 | syn | 0.18 | |
| Sm ii | 4519.63 | 0.54 | 0.35 | syn | 0.10 |
| Sm ii | 4537.94 | 0.49 | 0.48 | syn | 0.10 |
| Sm ii | 4554.44 | 0.10 | 1.25 | syn | 0.14 |
| Sm ii | 4591.81 | 0.18 | 1.12 | syn | 0.13 |
| Sm ii | 4595.28 | 0.49 | 0.50 | syn | 0.12 |
| Sm ii | 4595.28 | 0.49 | 0.50 | syn | 0.12 |
| Sm ii | 4605.17 | 0.04 | 1.39 | syn | 0.02 |
| Sm ii | 4686.19 | 0.04 | 1.15 | syn | 0.15 |
| Sm ii | 4719.84 | 0.04 | 1.24 | syn | 0.05 |
| Sm ii | 4745.68 | 0.10 | 0.93 | syn | 0.14 |
| Eu ii | 3724.93 | 0.00 | 0.09 | syn | 0.11 |
| Eu ii | 3819.67 | 0.00 | 0.51 | syn | 0.04 |
| Eu ii | 3907.11 | 0.21 | 0.17 | syn | 0.12 |
| Eu ii | 4129.72 | 0.00 | 0.22 | syn | 0.11 |
| Eu ii | 4205.04 | 0.00 | 0.21 | syn | 0.16 |
| Eu ii | 6645.06 | 1.38 | 0.12 | syn | 0.04 |
| Eu ii | 7217.56 | 1.23 | 0.35 | syn | 0.22 |
| Gd ii | 3768.40 | 0.08 | 0.21 | 51.3 | 0.22 |
| Gd ii | 3894.69 | 0.00 | 0.58 | 29.6 | 0.56 |
| Gd ii | 4037.32 | 0.66 | 0.11 | 14.8 | 0.36 |
| Gd ii | 4049.42 | 0.66 | 0.08 | 14.6 | 0.32 |
| Gd ii | 4049.85 | 0.99 | 0.49 | 30.5 | 0.47 |
| Gd ii | 4191.07 | 0.43 | 0.48 | 14.4 | 0.47 |
| Gd ii | 4251.73 | 0.38 | 0.22 | 24.1 | 0.42 |
| Gd ii | 4316.05 | 0.66 | 0.45 | 12.3 | 0.58 |
| Gd ii | 4438.25 | 0.66 | 0.82 | 6.3 | 0.63 |
| Tb ii | 3568.45 | 0.00 | 0.36 | syn | 0.42 |
| Tb ii | 3658.89 | 0.13 | 0.01 | syn | 0.20 |
| Tb ii | 3899.19 | 0.37 | 0.33 | syn | 0.47 |
| Dy ii | 3996.69 | 0.59 | 0.26 | syn | 0.43 |
| Dy ii | 4050.57 | 0.59 | 0.47 | syn | 0.45 |
| Dy ii | 4073.12 | 0.54 | 0.32 | syn | 0.43 |
| Dy ii | 4077.97 | 0.10 | 0.04 | syn | 0.45 |
| Dy ii | 4103.31 | 0.10 | 0.38 | syn | 0.48 |
| Ho ii | 3398.94 | 0.00 | 0.41 | syn | 0.19 |
| Ho ii | 3416.44 | 0.08 | 0.26 | syn | 0.46 |
| Ho ii | 3453.11 | 0.08 | 0.01 | syn | 0.24 |
| Ho ii | 3456.01 | 0.00 | 0.76 | syn | 0.21 |
| Ho ii | 3474.27 | 0.08 | 0.28 | syn | 0.23 |
| Ho ii | 3484.83 | 0.08 | 0.28 | syn | 0.35 |
| Ho ii | 3810.71 | 0.00 | 0.19 | syn | 0.33 |
| Ho ii | 3890.97 | 0.08 | 0.46 | syn | 0.41 |
| Ho ii | 4045.45 | 0.00 | 0.05 | syn | 0.27 |
| Er ii | 3499.11 | 0.06 | 0.29 | 57.1 | 0.14 |
| Er ii | 3559.89 | 0.00 | 0.69 | 17.4 | 0.26 |
| Er ii | 3616.57 | 0.00 | 0.31 | 26.3 | 0.10 |
| Er ii | 3633.54 | 0.00 | 0.53 | 28.3 | 0.36 |
| Er ii | 3896.23 | 0.06 | 0.12 | 49.6 | 0.18 |
| Tm ii | 3462.20 | 0.00 | 0.03 | syn | 0.71 |
| Tm ii | 3761.91 | 0.00 | 0.43 | syn | 0.83 |
| Tm ii | 3795.17 | 0.03 | 1.58 | syn | 0.45 |
| Tm ii | 3848.02 | 0.00 | 0.14 | syn | 0.65 |
| Tm ii | 3996.51 | 0.00 | 1.20 | syn | 0.48 |
| Yb ii | 3694.19 | 0.00 | 0.30 | syn | 0.02 |
| Hf ii | 4093.15 | 0.45 | 1.15 | syn | 0.03 |
| Os i | 4420.46 | 0.00 | 1.43 | syn | 0.90 |
| Ir i | 3513.65 | 0.00 | 1.26 | syn | 1.53 |
| Th ii | 4019.12 | 0.00 | 0.23 | syn | 0.60 |
| U ii | 3859.57 | 0.04 | 0.07 | syn | 0.59 |
Note. — “syn” denotes spectrum synthesis was used to measure the abundance.