Dimensional Reduction of Helium-4 Inside Argon Plated MCM-41 Nanopores
Abstract
The angstrom-scale coherence length describing the superfluid wavefunction of 4He at low temperatures has prevented its preparation in a truly one-dimensional geometry. Mesoporous ordered silica-based structures, such as the molecular sieve MCM-41, offer a promising avenue towards physical confinement, but the minimal pore diameters that can be chemically synthesized have proven to be too large to reach the quasi-one-dimensional limit. We present an active nano-engineering approach to this problem by pre-plating MCM-41 with a single, well controlled layer of Ar gas before filling the pores with helium. The structure inside the pore is investigated via experimental adsorption isotherms and neutron scattering measurements that are in agreement with large scale quantum Monte Carlo simulations. The results demonstrate angstrom and kelvin scale tunability of the effective confinement potential experienced by 4He atoms inside the MCM-41, with the Ar layer reducing the diameter of the confining media into a regime where a number of solid layers surround a one-dimensional quantum liquid.
I Introduction
The spatial dimension of a quantum many-body system can be systematically controlled by applying confinement on a scale smaller than the length characterizing coherence of the wavefunction. In this manner, one-dimensional (1D) phenomena have been explored in carbon nanotubes Bockrath et al. 1999; Yao et al. 1999; Ishii et al. 2003, and low-density electronic quantum wires Auslaender et al. 2005; Jompol et al. 2009; Laroche et al. 2014; Blumenstein et al. 2011, where electron-beam lithography can achieve transverse confinement in the range required to be smaller than the inverse Fermi wavevector. In ultra-cold atomic systems, laser trapping can produce confinement on the scale of the thermal de Broglie wavelength Monien et al. 1998; Greiner et al. 2001; Paredes et al. 2004; Kinoshita et al. 2005; Haller et al. 2010; Boéris et al. 2016; Yang et al. 2017. At higher densities, coherent quantum phenomena in the elemental superfluid 4He is characterized by a length scale below the superfluid transition temperature and engineering 1D confinement at this sub-nanometer scale has turned out to be a challenging task.
Current approaches to the physical confinement of superfluid helium fall into two categories: nanofabrication and chemical synthesis. In the first, electron beams have been employed to carve single short () cylindrical pores with radii Savard et al. 2009; Savard et al. 2011; Duc et al. 2015 while heavy-ion bombardment of polymer foils can create longer () and wider () channels Velasco et al. 2012; Velasco et al. 2014; Botimer and Taborek 2016. In both cases, the measured hydrodynamics of the confined superfluid indicates deviations from bulk three dimensional pressure driven flow, providing evidence for a crossover towards the 1D limit. The second approach invokes chemistry to synthesize silicates such as MCM-41 (Mobil Composition of Matter No. 41) Kresge et al. 1992 and FSM-16 (Folded Sheet Material) Inagaki et al. 1996 that consist of regular networks of hexagonal or cylindrical pores. When filled with helium, they are amenable to bulk probes at low temperature and have provided a large body of evidence on the effects of enhanced thermal and quantum fluctuations on the superfluid state Wada et al. 2001; Wada et al. 2005; Ikegami et al. 2005; Toda et al. 2007; Taniguchi et al. 2011; Taniguchi et al. 2013; Yager et al. 2013; Demura et al. 2015; Demura et al. 2017; Taniguchi et al. 2018; Prisk et al. 2013; Bryan et al. 2017; Bryan and Sokol 2018; Bossy et al. 2019; Taniguchi et al. 2020; Huan et al. 2020. However, the radii of the pores in these materials is ultimately set by the specific reaction route and is not continuously tunable, with the smallest possible diameter being on the order of . Quantum Monte Carlo simulations of confined 4He have indicated that sub- radii might be required to observe truly 1D behavior Del Maestro et al. 2011; Del Maestro 2012; Kulchytskyy et al. 2013; Vranješ Markić and Glyde 2015; Vranješ Markić et al. 2018; Vranješ Markić et al. 2020 and thus a systematic approach to reducing the size of nanopores is desirable to test these predictions.
In this paper, we introduce a proposed solution which employs pre-plating MCM-41 nanopores with a single adsorbed layer of argon gas Muroyama et al. 2008; Kilburn and Sokol 2008, thereby allowing tunability of both the effective pore radius seen by helium atoms and the strength of the confinement potential. We combine experimental results employing N2 and 4He adsorption isotherms with large scale quantum Monte Carlo simulations to explore the atomic-scale structure within the pores and identify a promising region where the density of a central core of helium atoms may be manipulated upon filling.
A single nanopore of Ar pre-plated MCM-41 is modelled by constructing an effective confinement potential consisting of a superposition of Lennard-Jones terms for He interacting with atoms in the porous material and a single cylindrical shell of argon. The resulting potential is tunable, both in terms of the location and depth of its wall-proximate minima. Its specific form can be matched to the microscopic geometry by extracting the width and density of the argon layer via a Brunauer-Emmett-Teller (BET) analysis Sing et al. 1985 of experimental adsorption isotherms. Once fixed, this potential is employed in a grand canonical quantum simulation of helium inside the nanopore where the density can be tuned by modifying the chemical potential (corresponding to the pressure of an external reservoir). As the pressure is increased, a series of concentric cylindrical layers form with the outer-most shells near the Ar exhibiting solid-like behavior. As the pressure approaches that of saturated vapor, the pores become fully filled and exhibit a central column of helium which may realize the desired 1D behavior. The existence of a central column is not a generic effect, but is instead a result of the ratio of the pore radius and the location of the mimima of the He - He interaction potential being close to an integer value. Careful analysis of simulation data allows for the determination of the relation between the linear density (number of atoms) in the pore center and the external pressure showing a narrow window, at , where a compressible 1D liquid can be expected inside the pre-plated nanopores.
The remainder of this paper is organized as follows. We first describe the experimental synthesis of MCM-41 and our pre-plating procedure followed by a characterization of the nanoporous materials via adsorption isotherms, elastic neutron scattering, and inelastic neutron scattering. The results allow us to extract material parameters that are essential in the construction of the model pre-plated MCM-41 confinement potential that is employed in a quantum Monte Carlo methodology based on path integrals. We next present the results of numerical simulations detailing the structure inside the pore as the external pressure is increased. We conclude with an analysis of the resulting layer formation and discuss implications for the discovery of a tunable 1D liquid in this geometry.
II Experimental Results
II.1 Sample Characterization
MCM-41 is a mesoporous material with a hierarchical structure produced using a surfactant templating technique. The surfactants used form rod-like micelles that order in a hexagonal array. The pores of this material, after removal of the surfactant template, are monodisperse, unidirectional, and have a regular 2D hexagonal structure. The typical aspect ratio of the pores is .
Our sample was obtained from Sigma-AldrichSigma-Aldrich 2008 and was characterized using X-ray powder diffraction and N2 gas adsorption isotherm measurements. The X-ray diffraction data indicated that the sample consisted of a single phase with pores arranged on a hexagonal lattice with a lattice constant of . A Brunauer-Emmett-Teller (BET) analysis Brunauer et al. 1938 of the N2 isotherm gave a surface area of . The pore diameter size distribution was calculated using the Kruk-Jaroniec-Sayari method Jaroniec et al. 1999 and was found to be Gaussian with a mean value of and a full-width at half-maximum of .
Adsorption isotherms were also carried out with research grade Ar gas to determine the monolayer coverage for the pores at . The results are shown in Figure 1. A BET analysis of the isotherm yielded a monolayer coverage of . This monolayer coverage, when combined with the measured surface area, yields an aerial coverage of and, using the van der Waals radius for Ar, a monolayer density of .
II.2 4He Isotherms
We also carried out 4He isotherms on MCM-41 preplated with a single monolayer of Ar. The Ar pre-plating was carried out at and then the sample was slowly cooled to over the course of several hours. 4He isotherms were then carried out at using standard volumetric techniques. The results are shown in Figure 1. The 4He initially adsorbed is strongly bound to the surface resulting in zero pressure rise until has been adsorbed. There is a small region between and where the pressure increases. Once a filling of 13 mmol/g has been reached no additional helium is adsorbed into the pores until the pressure is close to the bulk vapor pressure. Once P/P0 is greater than , 4He capillary condenses between the MCM-41 grains.
II.3 Neutron Scattering
Neutron scattering studies of 4He in Ar preplated MCM-41 were performed to identify the phase (mobile versus immobile) of the adsorbed helium. These measurements were carried out using the Disc Chopper Spectrometer (DCS) at the NIST Center for Neutron Research Copley and Cook 2003. This instrument is a direct geometry time-of-flight chopper spectrometer which views a cold moderator. An incident wavelength of was used for these measurements. A top-loading liquid helium cryostat with aluminum tails, commonly referred to as an “orange” cryostat, was used to obtain the low temperatures examined in this study. The sample cell was a cylindrical aluminum can of outer diameter , a height of , and a wall thickness of . The cell contained of MCM-41 in the form of cylindrical pellets thick separated by cadmium spacers to reduce multiple scattering. Gas was loaded to the sample in situ from an external gas handling system. Measurements were carried out at a temperature of . Standard data reduction routines Azuah et al. 2009 were used to convert the observed scattering to the dynamic structure factor .

The sample was preplated with a monolayer of Ar prior to the adsorbing 4He. The scattering from the cell, MCM-41, and Ar monolayer were treated as background and subtracted from the results shown in Figure 2. The three panels show scattering at three different fillings corresponding to (top) monolayer, (middle) bilayer, and (bottom) full pore. For the purposes of this discussion, we are only interested in the information the scattering provides on the mobility of the adsobed helium. A more complete analysis of the scattering will be presented elsewhere. For the monolayer and bilayer, only elastic scattering () is observed. The strong scattering at represents the first peak in the static structure factor for the adsorbed helium. The full pore measurement, in contrast, exhibits inelastic scattering consistent with mobile 4He atoms.
The lack of inelastic scattering for the monolayer and bilayer indicate that when 4He is initially adsorbed on the Ar plated MCM-41 pores it is strongly bound and immobile. This is consistent with the predictions of the simulations (discussed below) which predict high density solid like layer formation for the first few layers of 4He adsorbed in the pores. The appearance of both elastic scattering and inelastic scattering for the nearly full pores is consistent with the simulation results that predict mobile (low density) helium at the center of the pores surrounded by multiple solid layers.
III Model and Simulation Details
The data obtained from the above experimental characterization of the Ar pre-plated MCM-41 nanopores can now be used to construct a theoretical model of the confinement geometry. We begin by simplifying the analysis to a single pore, as their center-to-center separation of means that atoms in different pores are essentially non-interacting. The one-pore system can then be described by the -body Hamiltonian:
| (1) |
where is the mass of a 4He atom located at position confined inside a pre-plated nanopore by a single particle potential energy and interacting with other He atoms through . Both potential energy terms arise from induced dipole-dipole interactions, with the helium-helium interaction potential being known to high precision Aziz et al. 1979; Przybytek et al. 2010; Cencek et al. 2012. is more difficult to obtain and its estimation now proceeds by generalizing previous results for the confinement of helium inside a cylinder carved out of an infinite homogeneous medium Tjatjopoulos et al. 1988; Stan et al. 1999; Zhang et al. 2004; Rossi et al. 2006.
III.1 Pre-plated confinement potential
We begin by considering the potential environment for a 4He atom inside a single pore. Figure 3 shows a bird’s-eye view of the structure of MCM-41 (-axis points out of the page) obtained via density functional theory Ugliengo et al. 2008.

The atomic coordinates have been shifted such that the origin is defined to be at the center of a pore (as indicated by the star). The black circle describes a perfect cylinder with radius constructed to fit within the quasi-hexagonal pores. This value is in agreement with the average pore radii of MCM-41 extracted from a BET analysis of experimental data. The resulting confinement potential for a helium atom at position is then formed from the usual sum over Lennard-Jones pair-wise contributions:
| (2) |
where and are estimated with Lorenz-Bertholot mixing rules Boda and Henderson 2008 for two atomic species and :
| (3) | ||||
The brute-force sum over can be extended to a large number of unit cells to obtain convergence to some fixed numerical precision with details, including all Lennard-Jones parameters, described in Appendix A. The result for a single slice at is shown in Figure 4 where the potential has only been plotted in the range .

In the deep pockets near the pore walls indicated in the figure, the depth of the well can drop to nearly for some values of . We expect that upon pre-plating the MCM-41 with a light rare gas such as argon, these recesses will be completely filled via adsorption effects. Thus the resulting potential seen by helium will be considerably smoother. Motivated by this, we model the confinement potential felt by a helium atom at radius from the center of a pore using a radially symmetric effective potential inside a long uniform cylinder of radius carved inside a continuous media Zhang et al. 2004. The resulting potential is now a scalar function of :
| (4) |
with
and
where is the density of the media, is the strength of the interaction, is the hard core distance, is the pore radius, and and are the complete elliptic integrals of the first and second kind.
The values of , , and in Eq. (4) can be extracted through a non-linear least squares fitting procedure of to as described in Appendix A. The resulting quantities are reported in Table 1 for helium inside MCM-41.
| 15.51 | 3.44 | 1.59 |
With an effective potential described by Eq. (4) for helium inside MCM-41 we can now model the rare gas pre-plating by superimposing a continuous cylindrical shell with of width that yields additional confinement
| (5) |
where is the outer radius computed from and is the inner radius using the van der Waals diameter of Ar. The mixed 4He-Ar Lennard-Jones parameters can be computed from the values in Table 2.
| Atom | ||
|---|---|---|
| He | 2.640 | 10.9 |
| Ar | 3.405 | 119.8 |
The full interaction potential for helium inside the Ar pre-plated MCM-41 system is shown in Figure 5(a) for three different densities of the argon layer corresponding to determined from the experimental BET analysis of an Ar/MCM-41 isotherm in Section II.2, for Ar liquid at boiling point, and for solid Ar at its triple point Witzenburg 1967. The bare interaction potential for helium with MCM-41, , is shown for comparison.

We observe that the density of the plated layer affects both the depth of the well and the location of the minimum, with this relationship quantified in Figure 5(b). Modifications of the density of the pre-plating layer provide substantial tuneability of the scale of the confinement potential seen by helium atoms while only producing a sub- modification of its effective radius. This indicates that substantially different levels of confinement can be produced by modifying the species of rare gas when pre-plating. With an estimate of the environment inside a single Ar preplated MCM-41 nanopore experienced by a single 4He atom, we now briefly describe the technical details of a quantum simulation of confined liquid helium at low temperature.
III.2 Quantum Monte Carlo
A system of helium atoms described by Eq. (1) inside the pore can be simulated using a Monte Carlo technique that exploits the path integral representation to map the quantum system in spatial dimensions to an effective classical one in that can be efficiently sampled using the Metropolis-Hastings algorithm Ceperley 1995. A grand canonical worm algorithm suitable for bosons in the spatial continuum introduced by Boninsegni, Prokof’ev and Svistunov Boninsegni et al. 2006a; Boninsegni et al. 2006b provides access to finite temperature observables: where is the Boltzmann constant, for systems composed of a few thousand 4He atoms.
All results presented herein utilized our open source path integral quantum Monte Carlo code in the grand canonical ensemble (access details in Ref. [Del Maestro 2020]) and all code, scripts, and data used in analysis and plotting are available online rep 2020.
We considered pores of lengths in order to understand any finite size effects (Appendix B.1), and focused on chemical potentials in the range at two experimentally studied temperatures: and . The imaginary time step was fixed at after comparing systematic Trotter and statistical errors for this value (see Appendix B.2).
In order to make connections between simulations and experiment we can convert the chemical potential (simulation tuning parameter) to pressure (experimental control knob). This was achieved by employing the virial equation of state up to second order using the known temperature dependence of the second coefficient for bulk 4He at saturated vapor pressure Donnelly and Barenghi 1998 which yields
| (6) |
where is the thermal de Broglie wavelength. Eq. (6) is shown in Figure 6 in units of the saturated vapor pressure of bulk helium, , and is used throughout this work to convert between chemical potential and pressure.
The pure exponential dependence holds over nearly the entire range of chemical potentials with deviations appearing when . A more accurate ab initio estimation of the pressure inside the pore can be obtained via quantum Monte Carlo Ceperley 1995. However, the effective phase separation inside the pore (see Section IV) makes statistical convergence of results difficult to obtain and we thus use the bulk relationship here. This simplification could introduce uncertainties when comparing with experimental results manifested as a pressure offset that can be overcome by fixing either the onset (initial) or saturation (maximal) filling of the pores.
IV Simulation Results
All results presented in this section for 4He inside Ar plated MCM-41 have a fixed pore length of , pore radius , and employ described in Section III.1 in the grand canonical ensemble yielding helium atoms for the largest chemical potentials studied.
A separate simulation was performed for each chemical potential in the range at and at in steps of . The number density where is the volume of the pore, was computed with the results shown in Figure 7.

The adsorption isotherms demonstrate that the pore remains empty until a temperature-dependent critical chemical potential is reached and atoms start to enter the pore. The density increases with increasing with step-like features indicative of layer formation consistent with previous simulation studiesBoninsegni et al. 2001; Rossi et al. 2005; Del Maestro et al. 2011; Del Maestro 2012; Kulchytskyy et al. 2013; Pollet and Kuklov 2014; Vranješ Markić and Glyde 2015. We note that even as the density inside the pore, , remains smaller than that of bulk helium at saturated vapor pressure for and for Donnelly and Barenghi 1998. The origin of this behavior can be investigated through a closer examination of the structure inside the pore as measured by a radial density:
| (7) |
where are the locations of the 4He atoms and indicates a Monte Carlo average where it is noted that is an instantaneous (configuration-dependent) quantity in the grand canonical simulation.
The resulting radial density is plotted as a function of radial position (distance from the center of the pore) in Figure 8 for , where the chemical potential has been converted to pressure via Eq. (6).

The onset of well-defined peaks in the radial density correspond to the steps in Figure 7. At low pressure, a quasi-solid layer of helium forms near the hard wall created by the pre-plated argon shell. As the pressure is increased, a sequence of concentric quasi-2D shells form with near vacuum between them. The magnitude of the number density of the shells places them all within the quasi-solid regime for 4He.
When is increased beyond (), 4He atoms begin to fill an inner core. The insets of Fig. 8 show the density at the location of the first minimum normalized by the radial density at the center of the pore. While there is an intermediate range of pressures where atoms can move freely between the center of the pore and first shell, the density at the minima begins to drop precipitously at higher pressures. For the density between the inner core and first shell is vanishingly small and particle exchanges are strongly suppressed indicating that the core region is acting as a quasi-1D system.
We note that the existence of this central core is not a generic effect and represents the fact that in the geometry considered here, the ratio of the effective pore-radius (set by the MCM-41 and Ar pre-plating geometry) to the distance between shells (set by the helium interaction potential) is approaching an integer. In nanopores where the effective radii is different, the density of the central core can be vanishingly small Del Maestro et al. 2011; Del Maestro 2012.
We now focus on the details of the central core and shells which can be characterized by one- and two-dimensional densities defined by:
| (8) | ||||
| (9) |
where to avoid ambiguity, we have determined the locations of the minima () and maxima () at fixed with values given in Table 3.
| [] | [] | ||
|---|---|---|---|
| 0 | - | 0.0 | - |
| 1 | 1.7 | 3.2 | 0.0065 |
| 2 | 4.6 | 6.2 | 0.012 |
| 3 | 7.5 | 9.0 | 0.0049 |
Temperature dependence of the minima/maxima locations only appear in the second digit not included in this table. The width of the central core is only slightly larger than the van der Waals diameter of a helium atom () with over 95% of atoms falling within this diameter when at both temperatures studied. Moreover, the final column of the table reports the radial density at the location of the first minima and shows it smaller than that in the center of the pore. These combined results represents strong evidence for the quasi-1D nature of the central core.
Evaluating Eqs. (8)–(9) inside the pore we observe a strong pressure and temperature dependence of both the 1D linear and 2D coverage densities of the inner core and surrounding shells as seen in Figure 9.

At , the inner core begins to fill at lower pressures () and we first observe an increase in linear density which is due to the leakage of particles from the first shell as seen in the lower panel of Figure 8. As the pressure is further increased, the density between the inner core and first shell begins to reduce and the quasi-1D nature of the central core becomes more apparent. It is in this regime that we find a decade of pressures () where the inner core has a density equivalent to liquid 4He as indicated by the shaded bar in Figure 9. Further increasing the pressure appears to quasi-solidify the core which is consistent with the expectation that atoms in 1D at high densities will seek to fix the distance between them to minimize their interaction potential . Results are similar at with the steps being smoothed out and the onset of the inner core being pushed to higher pressures due to the pressure dependence in Eq. (6). In the lower three panels, the areal coverage or 2D density of the surrounding cylinders is shown. Here the onset is considerably sharper in pressure, with there being more tunability of the shell densities at higher temperature.
V Discussion
The combination of experimental isotherms, neutron scattering, and X-ray scattering with large scale quantum Monte Carlo simulations provides unprecedented information on the structure of 4He inside small constrictions. A BET analysis of experimental adsorption isotherms was used to determine the average pore radii of the grown MCM-41 () and the density of a single-layer of adsorbed Ar gas (). These values were employed to build an effective model of the pre-plated adsorption potential which describes an infinite cylindrical cavity carved inside a continuous Lennard-Jones medium. While it is clear from the crystal structure and resulting full confinement potential shown in Figures 3 and 4 that the atomic structure of bare MCM-41 produces a rough potential landscape, it is assumed that the pre-plating Ar gas will be first adsorbed into the deep potential pockets and resulting in a considerably smoothed environment. This is justified by the agreement between experimental and theoretical adsorption isotherms seen in Figure 7. One of the main sources of uncertainty in this work is the conversion between the chemical potential (tuned in simulations) and the measurement of the partial pressure (controlled in the experiments). It is expected that improvements could be made by implementing a direct Monte Carlo estimator for the pressure inside the nanopores combined with more sensitive determination of the pressure in the adsorption cell.
As discussed in the introduction and validated in §II and §IV, in this low-pressure regime, 4He atoms are strongly attracted to the pre-plated walls of the MCM-41 constriction and a quasi-2d solid layer adsorbs on the surface, consistent with the scattering measurements at and in Figure 2. The Ar layer has two main effects: (1) its weaker interaction with helium as compared to the MCM-41 reduces the potential well depth (this can be controlled via the density of the Ar layer); (2) the hard-cores of the Ar atoms decrease the effective radius of the constriction from to . We note that this is the exact reduction predicted from numerical simulations to ensure a cross-over from a quasi-3D to quasi-1D superfluid Del Maestro et al. 2011; Kulchytskyy et al. 2013; Vranješ Markić et al. 2020. Different confinement radii and potential environments could be obtained by changing the type of pre-plating rare gas, and these techniques could be utilized with other porous materials providing the opportunity to engineer a targeted confinement potential.
As the partial pressure of helium is further increased, a series of concentric shells form separated by , the distance at which two helium atoms in free space would like to be situated to minimize their interaction energy. Shells near the Ar layer contain immobile helium, while those nearer the center of the pore may exhibit liquid-like behavior, consistent with the scattering results presented here. The existence of finite density at the center of the pore is not guaranteed for a generic nanoporous system, even at large pressures Del Maestro 2012; Vranješ Markić et al. 2020, and requires that the pre-plated pore radii is nearly commensurate with . Again, numerical simulations have demonstrated that this central core can exhibit superfluid behavior Kulchytskyy et al. 2013; Vranješ Markić et al. 2018; Vranješ Markić et al. 2020 at temperatures lower than those considered here.
In conclusion, we have shown that theoretical simulations of 4He inside Ar pre-plated MCM-41 nanopores are in agreement with experimental adsorption and scattering results, and demonstrate the ability to stabilize a quasi-one-dimensional quantum liquid at low temperature with a tunable density at the center of the pores. It is expected that such a 1D liquid should lack long-range order, instead displaying algebraically decaying density and phase correlations, even at zero temperature. This behavior could be confirmed in future work by further analyzing the results of experimental neutron scattering measurements along with quantum Monte Carlo calculations of the dynamical structure factor within the context of Tomonaga-Luttinger liquid theory.
VI Acknowledgments
We benefited from discussion with K. Shirahama and C. Herdman and acknowledge the support of the National Institute of Standards and Technology, U.S. Department of Commerce, in providing the neutron research facilities used in this work. This research was supported in part by the National Science Foundation (NSF) under award Nos. DMR-1809027 and DMR-1808440. Computations were performed on the Vermont Advanced Computing Core supported in part by NSF award No. OAC-1827314 and IU Big Red Karst. This work used the Extreme Science and Engineering Discovery Environment (XSEDE)Towns et al. 2014, which is supported by NSF grant number ACI-1548562. XSEDE resources used include Bridges at Pittsburgh Supercomputing, Comet at San Diego Supercomputer Center, and Open Science Grid (OSG)Pordes et al. 2007; Sfiligoi et al. 2009 through allocations TG-DMR190045 and TG-DMR190101. OSG is supported by the NSF under award No. 1148698, and the U.S. Department of Energy’s Office of Science. Certain commercial equipment, instruments, or materials (or suppliers, or software, ) are identified in this paper to foster understanding. Such identification does not imply recommendation or endorsement by the National Institute of Standards and Technology, nor does it imply that the materials or equipment identified are necessarily the best available for the purpose.
Appendix A Determination of Parameters for Effective MCM-41 Potential
Eq. (2) in Section III.1 describes the full many-body potential experienced by a single 4He atom confined inside the MCM-41 matrix as a superposition of standard 6–12 Lennard-Jones interactions. Here we have used the optimized atomic coordinates available in Ref. [Ugliengo et al. 2008] and the potential was computed on a pore-centered grid in the -plane at 101 different values from to . At each of the grid points, we considered a semi-infinite crystal by summing over repeated unit cells until convergence was achieved at double floating point precision.
We performed an extensive search for the optimal Lennard-Jones parameters and to use in and found that a large range has been previously reported with minimal consensus in the literature. This included parameters based on Drieding force field calculations applied to silica, both with and without the effects of interacting hydrogen atoms Mayo et al. 1990; Zhuo et al. 2008; Jing et al. 2013; Chang et al. 2015; Kumar and Kumar 2018; Ho et al. 2011, and including a large variation of the interaction strength () of both oxygen and silicon in the MCM-41 Williams et al. 2016; Bródka and Zerda 1996; Ferreiro-Rangel et al. 2014; Schumacher et al. 2006; Talu and Myers 2001; Zhang et al. 2016. We have chosen to employ an alternative set of parameters that derived from consistent valence force field calculations Coasne and Fourkas 2011; Hill and Sauer 1994 that have been designed specifically for silicates and have been able to reproduce experimentally observed crystal structures. The appropriately mixed parameters used in the simulations are reported in Table 4.
| Atom Pair | ||
|---|---|---|
| Si–He | 3.60 | 14.84 |
| O–He | 2.93 | 35.44 |
| H–He | 2.70 | 12.13 |
With the full potential calculated, we next obtained the effective potential in Eq. (4) to be employed in grand canonical quantum Monte Carlo simulations via a non-linear least squares fitting procedure at each value of . This is made difficult by the infinitely repulsive pore walls and the proximate deep attractive minima. To overcome these extremal values two alternative methods were employed to obtain a well-behaved dataset over which to fit: a potential cutoff selected spatial grid-points inside the MCM-41 pore where , and a spatial cutoff where all points within a fixed radius set by the closest point to the center with were chosen. The resulting spatial regions over which fits were performed at are compared in Figure 10.

The potential cutoff method more accurately captures the pore roughness as seen in the figure, while the radial cutoff method provides an improved description of the region of the pore () where the helium atoms will reside after the pre-plating has occurred.
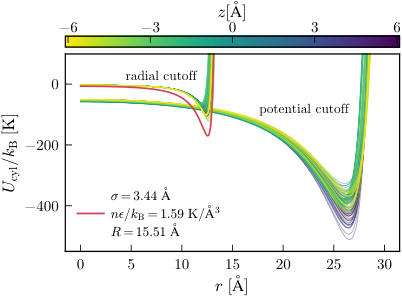
The fitting procedure from to then proceeds by determining the optimal set of parameters , and in Eq. (4) at each of the 101 -slices between . The resulting smooth symmetric confinement potentials for both methods are shown in Figure 11. Upon comparison, it is clear that the raw potential cutoff does not provide a reasonable effective potential as it predicts a confinement radius that is inconsistent with experimental adsorption isotherms. This is due to the fact that it is over-fitting to the large potential well depths within the rough areas of the pore and neglecting the smoother lower potential region closer to the center where the 4He will be confined. As mentioned above, upon pre-plating we expect these volumes to be filled by Ar and result in a considerably smoother potential with a smaller effective radius. This is better-captured by the radial cutoff method which also produces an effective confinement radius that is in excellent agreement with the experimentally determined pore diameter. We thus focus on the results of the radial cutoff approach and determine the final set of parameters by performing a weighted average over the -slices and choosing a value of that incorporates the expected added density of argon due to its filling the extremal regions causing a deeper potential well. The resulting effective potential is shown as a red solid line in Figure 10 along with the parameters, which are also reported in Table 1. We note that there is considerable ambiguity in this procedure and appeal to the reasonable agreement found between theoretical and experimental results reported in §IV. A more microscopic characterization of the helium–MCM-41 interaction combing classical grand canonical Monte Carlo with molecular dynamics simulations is ongoing, but is beyond the scope of this study.
Appendix B Simulation Scaling
B.1 Finite Size Effects
To understand the effects of finite pore length, we performed grand canonical quantum path integral Monte Carlo simulations for helium confined within argon pre-plated MCM-41 with . Maximal effects were observed when the pore was completely filled with at .

Figure 12 shows that there is little structural change, as captured by the radial density with only minimal shifts of the peak densities and minima between layers. As we are most interested in the 4He confined at the very center of the pore, we can quantify these effects by studying the length dependence of as well as the integrated linear density defined in Eq. (8) as seen in Figure 13 for the same set of simulation parameters. On this reduced scale, the finite size effects are more striking and exhibit non-monotonic oscillatory behavior.

This can be understood as the confluence of different but related finite size effects. For , the aspect ratio of the pore is and its length can accommodate approximately helium atoms at its center. Such a small system can not be expected to capture the physics in the thermodynamic limit. As is increased, there are oscillations caused by the interplay between the length and the optimal inter-particle separation set by the He-He interaction as only an integer number of atoms can fit in the center of the pore. This effect becomes less important for longer pores leading to a decay in the observed density oscillations. Finally, the total density of the 4He atoms inside the pore comes with its own finite size errors due to the scaling of the chemical potential (see Ref. [Herdman et al. 2014]) which has not been considered here. Correcting for this would require the comparison of simulations performed at different length-dependent chemical potentials.
B.2 Trotter Error
Path integral quantum Monte Carlo is stochastically exact at finite temperature, up to a systematic finite-time step (Trotter) error that can be controlled through an appropriate implementation of a composite factorization scheme for the density matrix Jang et al. 2001. Here we use a approach for the He-He interaction, but are limited to a primitive approximation for the confinement potential. The resulting effect on simulation results can be seen in Figure 14, which shows the energy per particle of 4He inside Ar pre-plated MCM-41 as a function of imaginary time step at . The simulation data is well fit by a quadratic polynomial in as shown by the solid line. The extrapolation of is within 1% of the value at (vertical dotted line) that we have utilized for all reported results to balance accuracy with simulation efficiency.
References
- Bockrath et al. (1999) M. Bockrath, D. Cobden, J. Lu, A. Rinzler, R. Smalley, L. Balents, and P. McEuen, “Luttinger-liquid behaviour in carbon nanotubes,” Nature 397, 598 (1999).
- Yao et al. (1999) Z. Yao, H. W. C. Postma, L. Balents, and C. Dekker, “Carbon nanotube intramolecular junctions,” Nature 402, 273 (1999).
- Ishii et al. (2003) H. Ishii, H. Kataura, H. Shiozawa, H. Yoshioka, H. Otsubo, Y. Takayama, T. Miyahara, S. Suzuki, Y. Achiba, M. Nakatake, T. Narimura, M. Higashiguchi, K. Shimada, H. Namatame, and M. Taniguchi, “Direct observation of Tomonaga–Luttinger-liquid state in carbon nanotubes at low temperatures,” Nature 426, 540 (2003).
- Auslaender et al. (2005) O. M. Auslaender, H. Steinberg, A. Yacoby, Y. Tserkovnyak, B. Halperin, K. W. Baldwin, L. N. Pfeiffer, and K. W. West, “Spin-Charge Separation and Localization in One Dimension,” Science 308, 88 (2005).
- Jompol et al. (2009) Y. Jompol, C. J. B. Ford, J. P. Griffiths, I. Farrer, G. A. C. Jones, D. Anderson, D. A. Ritchie, T. W. Silk, and A. J. Schofield, “Probing Spin-Charge Separation in a Tomonaga-Luttinger Liquid.” Science 325, 597 (2009).
- Laroche et al. (2014) D. Laroche, G. Gervais, M. P. Lilly, and J. L. Reno, “1D-1D Coulomb Drag Signature of a Luttinger Liquid.” Science 343, 631 (2014).
- Blumenstein et al. (2011) C. Blumenstein, J. Schäfer, S. Mietke, S. Meyer, A. Dollinger, M. Lochner, X. Y. Cui, L. Patthey, R. Matzdorf, and R. Claessen, “Atomically controlled quantum chains hosting a Tomonaga–Luttinger liquid,” Nature Phys. 7, 776 (2011).
- Monien et al. (1998) H. Monien, M. Linn, and N. Elstner, “Trapped one-dimensional Bose gas as a Luttinger liquid,” Phys. Rev. A 58, R3395 (1998).
- Greiner et al. (2001) M. Greiner, I. Bloch, O. Mandel, T. W. Hänsch, and T. Esslinger, “Exploring Phase Coherence in a 2D Lattice of Bose-Einstein Condensates,” Phys. Rev. Lett. 87, 160405 (2001).
- Paredes et al. (2004) B. Paredes, A. Widera, V. Murg, O. Mandel, S. Fölling, I. Cirac, G. V. Shlyapnikov, T. W. Hänsch, and I. Bloch, “Tonks–Girardeau gas of ultracold atoms in an optical lattice,” Nature 429, 277 (2004).
- Kinoshita et al. (2005) T. Kinoshita, T. Wenger, and D. S. Weiss, “Local Pair Correlations in One-Dimensional Bose Gases,” Phys. Rev. Lett. 95, 190406 (2005).
- Haller et al. (2010) E. Haller, R. Hart, M. J. Mark, J. G. Danzl, L. Reichsöllner, M. Gustavsson, M. Dalmonte, G. Pupillo, and H.-C. Nägerl, “Pinning quantum phase transition for a Luttinger liquid of strongly interacting bosons,” Nature 466, 597 (2010).
- Boéris et al. (2016) G. Boéris, L. Gori, M. D. Hoogerland, A. Kumar, E. Lucioni, L. Tanzi, M. Inguscio, T. Giamarchi, C. D’Errico, G. Carleo, G. Modugno, and L. Sanchez-Palencia, “Mott transition for strongly interacting one-dimensional bosons in a shallow periodic potential,” Phys. Rev. A 93, 011601(R) (2016).
- Yang et al. (2017) B. Yang, Y.-Y. Chen, Y.-G. Zheng, H. Sun, H.-N. Dai, X.-W. Guan, Z.-S. Yuan, and J.-W. Pan, “Quantum criticality and the Tomonaga-Luttinger liquid in one-dimensional Bose gases,” Phys. Rev. Lett. 119, 165701 (2017).
- Savard et al. (2009) M. Savard, C. Tremblay-Darveau, and G. Gervais, “Flow Conductance of a Single Nanohole,” Phys. Rev. Lett. 103, 104502 (2009).
- Savard et al. (2011) M. Savard, G. Dauphinais, and G. Gervais, “Hydrodynamics of Superfluid Helium in a Single Nanohole,” Phys. Rev. Lett. 107, 254501 (2011).
- Duc et al. (2015) P.-F. Duc, M. Savard, M. Petrescu, B. Rosenow, A. D. Maestro, and G. Gervais, “Critical flow and dissipation in a quasi–one-dimensional superfluid,” Sci. Adv. 1, e1400222 (2015).
- Velasco et al. (2012) A. E. Velasco, S. G. Friedman, M. Pevarnik, Z. S. Siwy, and P. Taborek, “Pressure-driven flow through a single nanopore,” Phys. Rev. E 86, 025302(R) (2012).
- Velasco et al. (2014) A. E. Velasco, C. Yang, Z. S. Siwy, M. E. Toimil-Molares, and P. Taborek, “Flow and evaporation in single micrometer and nanometer scale pipes,” Appl. Phys. Lett. 105, 033101 (2014).
- Botimer and Taborek (2016) J. Botimer and P. Taborek, “Pressure driven flow of superfluid 4He through a nanopipe,” Phys. Rev. Fluids 1, 054102 (2016).
- Kresge et al. (1992) C. T. Kresge, M. E. Leonowicz, W. J. Roth, J. C. Vartuli, and J. S. Beck, “Ordered mesoporous molecular sieves synthesized by a liquid-crystal template mechanism,” Nature 359, 710 (1992).
- Inagaki et al. (1996) S. Inagaki, A. Koiwai, N. Suzuki, Y. Fukushima, and K. Kuroda, “Syntheses of Highly Ordered Mesoporous Materials, FSM-16, Derived from Kanemite.” Bull. Chem. Soc. Jpn. 69, 1449 (1996).
- Wada et al. (2001) N. Wada, J. Taniguchi, H. Ikegami, S. Inagaki, and Y. Fukushima, “Helium-4 Bose Fluids Formed in One-Dimensional 18 Å Diameter Pores,” Phys. Rev. Lett. 86, 4322 (2001).
- Wada et al. (2005) N. Wada, J. Taniguchi, T. Matsushita, R. Toda, Y. Matsushita, H. Ikegami, M. Hieda, A. Yamaguchi, and H. Ishimoto, “Zero- and one-dimensional 4He Bose fluids realized in nanometer pores,” J. Phys. Chem. Solids 66, 1512 (2005).
- Ikegami et al. (2005) H. Ikegami, Y. Yamato, T. Okuno, J. Taniguchi, and N. Wada, “Observation of 4He Superfluidity in 1.8 nm-Pores,” J. Low Temp. Phys. 138, 171 (2005).
- Toda et al. (2007) R. Toda, M. Hieda, T. Matsushita, N. Wada, J. Taniguchi, H. Ikegami, S. Inagaki, and Y. Fukushima, “Superfluidity of 4He in One and Three Dimensions Realized in Nanopores,” Phys. Rev. Lett. 99, 255301 (2007).
- Taniguchi et al. (2011) J. Taniguchi, R. Fujii, and M. Suzuki, “Superfluidity and BEC of liquid 4He confined in a nanometer-size channel,” Phys. Rev. B 84, 134511 (2011).
- Taniguchi et al. (2013) J. Taniguchi, K. Demura, and M. Suzuki, “Dynamical superfluid response of 4He confined in a nanometer-size channel,” Phys. Rev. B 88, 014502 (2013).
- Yager et al. (2013) B. Yager, J. Nyéki, A. Casey, B. P. Cowan, C. P. Lusher, and J. Saunders, “NMR Signature of One-Dimensional Behavior of 3He in Nanopores,” Phys. Rev. Lett. 111, 215303 (2013).
- Demura et al. (2015) K. Demura, J. Taniguchi, and M. Suzuki, “Dynamical Superfluid Response of 3He–4He Solutions Confined in a Nanometer-Size Channel,” J. Phys. Soc. Jpn. 84, 094604 (2015).
- Demura et al. (2017) K. Demura, J. Taniguchi, and M. Suzuki, “Twofold Torsional Oscillator Experiments from Film to Pressurized Liquid 4He in a Nanometer-Size Channel,” J. Phy. Soc. Jap. 86, 114601 (2017).
- Taniguchi et al. (2018) K. Taniguchi, J. Taniguchi, and M. Suzuki, “Torsional Oscillator Measurements of Liquid 4He Confined in 2.5-nm Channel of FSM,” J. Phys.: Conf. Ser. 969, 012005 (2018).
- Prisk et al. (2013) T. R. Prisk, N. C. Das, S. O. Diallo, G. Ehlers, A. A. Podlesnyak, N. Wada, S. Inagaki, and P. E. Sokol, “Phases of superfluid helium in smooth cylindrical pores,” Phys. Rev. B 88, 014521 (2013).
- Bryan et al. (2017) M. S. Bryan, T. R. Prisk, T. E. Sherline, S. O. Diallo, and P. E. Sokol, “Bulklike excitations in nanoconfined liquid helium,” Phys. Rev. B 95, 144509 (2017).
- Bryan and Sokol (2018) M. S. Bryan and P. E. Sokol, “Maxon and roton measurements in nanoconfined ,” Phys. Rev. B 97, 184511 (2018).
- Bossy et al. (2019) J. Bossy, J. Ollivier, and H. R. Glyde, “Phonons, rotons, and localized Bose-Einstein condensation in liquid 4He confined in nanoporous FSM-16,” Phys. Rev. B 99, 165425 (2019).
- Taniguchi et al. (2020) J. Taniguchi, K. Taniguchi, K. Kanno, and M. Suzuki, “Possible Thermodynamical Phase Slips in Superfluid 4He Confined in a 2.5-nm Channel of FSM,” J. Low Temp. Phys. , 1007 (2020).
- Huan et al. (2020) C. Huan, J. Adams, M. Lewkowitz, N. Masuhara, D. Candela, and N. S. Sullivan, “NMR Studies of the Dynamics of 1D 3He in 4He Plated MCM-41,” J. Low Temp. Phys. , 1007 (2020).
- Del Maestro et al. (2011) A. Del Maestro, M. Boninsegni, and I. Affleck, “4He Luttinger Liquid in Nanopores,” Phys. Rev. Lett. 106, 105303 (2011).
- Del Maestro (2012) A. Del Maestro, “A Luttinger Liquid Core Inside Helium-4 Filled Nanopores,” Int. J. Mod. Phys. B 26, 1244002 (2012).
- Kulchytskyy et al. (2013) B. Kulchytskyy, G. Gervais, and A. Del Maestro, “Local superfluidity at the nanoscale,” Phys. Rev. B 88, 064512 (2013).
- Vranješ Markić and Glyde (2015) L. Vranješ Markić and H. R. Glyde, “Superfluidity, BEC, and dimensions of liquid in nanopores,” Phys. Rev. B 92, 064510 (2015).
- Vranješ Markić et al. (2018) L. Vranješ Markić, H. Vrcan, Z. Zuhrianda, and H. R. Glyde, “Superfluidity, Bose-Einstein condensation, and structure in one-dimensional Luttinger liquids,” Phys. Rev. B 97, 014513 (2018).
- Vranješ Markić et al. (2020) L. Vranješ Markić, K. Dželalija, and H. R. Glyde, “Crossover from one to two dimensions in liquid 4He in a nanopore,” Phys. Rev. B 101, 104505 (2020).
- Muroyama et al. (2008) N. Muroyama, A. Yoshimura, Y. Kubota, K. Miyasaka, T. Ohsuna, R. Ryoo, P. I. Ravikovitch, A. V. Neimark, M. Takata, and O. Terasaki, “Argon Adsorption on MCM-41 Mesoporous Crystal Studied by In Situ Synchrotron Powder X-ray Diffraction,” J. Phys. Chem. C 112, 10803 (2008).
- Kilburn and Sokol (2008) D. Kilburn and P. E. Sokol, “Monolayer sorption of neon in mesoporous silica glass as monitored by wide-angle x-ray scattering,” Phys. Rev. E 77, 021603 (2008).
- Sing et al. (1985) K. S. W. Sing, D. H. Everett, R. A. W. Haul, L. Moscou, R. A. Pierotti, J. Rouquérol, and T. Siemieniewska, “Reporting physisorption data for gas/solid systems with special reference to the determination of surface area and porosity (Recommendations 1984),” Pure Appl. Chem. 57, 603 (1985).
- Sigma-Aldrich (2008) Sigma-Aldrich, “Synthesis of Mesoporous Materials,” Mater. Matters 3.1, 17 (2008).
- Brunauer et al. (1938) S. Brunauer, P. H. Emmett, and E. Teller, “Adsorption of Gases in Multimolecular Layers,” J. Am. Chem. Soc. 60, 309 (1938).
- Jaroniec et al. (1999) M. Jaroniec, M. Kruk, and J. P. Olivier, “Standard Nitrogen Adsorption Data for Characterization of Nanoporous Silicas,” Langmuir 15, 5410 (1999).
- Copley and Cook (2003) J. Copley and J. Cook, “The Disk Chopper Spectrometer at NIST: a new instrument for quasielastic neutron scattering studies,” Chem. Phys. 292, 477 (2003).
- Azuah et al. (2009) R. T. Azuah, L. R. Kneller, Y. Qiu, P. L. W. Tregenna-Piggott, C. M. Brown, J. R. D. Copley, and R. M. Dimeo, “DAVE: A comprehensive Software Suite for the Reduction, Visualization, and Analysis of Low Energy Neutron Spectroscopic Data,” J. Res. Natl. Inst. Stand. Technol. 114, 341 (2009).
- Aziz et al. (1979) R. A. Aziz, V. P. S. Nain, J. S. Carley, W. L. Taylor, and G. T. McConville, “An accurate intermolecular potential for helium,” J. Chem. Phys. 70, 4330 (1979).
- Przybytek et al. (2010) M. Przybytek, W. Cencek, J. Komasa, G. Łach, B. Jeziorski, and K. Szalewicz, “Relativistic and Quantum Electrodynamics Effects in the Helium Pair Potential,” Phys. Rev. Lett. 104, 183003 (2010).
- Cencek et al. (2012) W. Cencek, M. Przybytek, J. Komasa, J. B. Mehl, B. Jeziorski, and K. Szalewicz, “Effects of adiabatic, relativistic, and quantum electrodynamics interactions on the pair potential and thermophysical properties of helium,” J. Chem. Phys. 136, 224303 (2012).
- Tjatjopoulos et al. (1988) G. J. Tjatjopoulos, D. L. Feke, and J. A. Mann, “Molecule-micropore interaction potentials,” J. Phys. Chem. 92, 4006 (1988).
- Stan et al. (1999) G. Stan, S. M. Gatica, M. Boninsegni, S. Curtarolo, and M. W. Cole, “Atoms in nanotubes: Small dimensions and variable dimensionality,” Am. J. Phys. 67, 1170 (1999).
- Zhang et al. (2004) X. Zhang, W. Wang, and G. Jiang, “A potential model for interaction between the Lennard–Jones cylindrical wall and fluid molecules,” Fluid Phase Equilib. 218, 239 (2004).
- Rossi et al. (2006) M. Rossi, D. E. Galli, and L. Reatto, “Pressurized 4He in Cylindrical and in Hexagonal Pores,” J. Low Temp. Phys. 146, 95 (2006).
- Ugliengo et al. (2008) P. Ugliengo, M. Sodupe, F. Musso, I. J. Bush, R. Orlando, and R. Dovesi, “Realistic Models of Hydroxylated Amorphous Silica Surfaces and MCM-41 Mesoporous Material Simulated by Large-scale Periodic B3LYP Calculations,” Adv. Mater. 20, 4579 (2008).
- Boda and Henderson (2008) D. Boda and D. Henderson, “The effects of deviations from Lorentz-Berthelot rules on the properties of a simple mixture,” Mol. Phys. 106, 2367 (2008).
- Hirschfelder et al. (1964) J. O. Hirschfelder, C. F. Curtiss, R. B. Bird, and M. G. Mayer, Molecular theory of gases and liquids, Vol. 165 (Wiley New York, 1964).
- Witzenburg (1967) W. V. Witzenburg, “Density of solid argon at the triple point and concentration of vacancies,” Phys. Lett. A 25, 293 (1967).
- Ceperley (1995) D. M. Ceperley, “Path integrals in the theory of condensed helium,” Rev. Mod. Phys. 67, 279 (1995).
- Boninsegni et al. (2006a) M. Boninsegni, N. Prokof’ev, and B. Svistunov, “Worm Algorithm for Continuous-Space Path Integral Monte Carlo Simulations,” Phys. Rev. Lett. 96, 070601 (2006a).
- Boninsegni et al. (2006b) M. Boninsegni, N. V. Prokofev, and B. V. Svistunov, “Worm algorithm and diagrammatic Monte Carlo: A new approach to continuous-space path integral Monte Carlo simulations,” Phys. Rev. E 74, 036701 (2006b).
- Del Maestro (2020) A. Del Maestro, “Available online,” Del Maestro Group Code Repository (2020), https://code.delmaestro.org.
- rep (2020) (2020), All code, scripts and data used in this work are included in a GitHub repository: https://github.com/DelMaestroGroup/PlatedHe4Nanopores. Permanent link: http://doi.org/10.5281/zenodo.3885456.
- Donnelly and Barenghi (1998) R. J. Donnelly and C. F. Barenghi, “The Observed Properties of Liquid Helium at the Saturated Vapor Pressure,” J. Phys. Chem. Ref. Data 27, 1217 (1998).
- Boninsegni et al. (2001) M. Boninsegni, S.-Y. Lee, and V. H. Crespi, “Helium in One-Dimensional Nanopores: Free Dispersion, Localization, and Commensurate/Incommensurate Transitions with Nonrigid Orbitals,” Phys. Rev. Lett. 86, 3360 (2001).
- Rossi et al. (2005) M. Rossi, D. E. Galli, and L. Reatto, “Layer by layer solidification of in narrow porous media,” Phys. Rev. B 72, 064516 (2005).
- Pollet and Kuklov (2014) L. Pollet and A. B. Kuklov, “Topological Quantum Phases of 4He Confined to Nanoporous Materials,” Phys. Rev. Lett. 113, 045301 (2014).
- Towns et al. (2014) J. Towns, T. Cockerill, M. Dahan, I. Foster, K. Gaither, A. Grimshaw, V. Hazlewood, S. Lathrop, D. Lifka, G. D. Peterson, R. Roskies, J. Scott, and N. Wilkins-Diehr, “XSEDE: Accelerating Scientific Discovery,” Comput. Sci. Eng. 16, 62 (2014).
- Pordes et al. (2007) R. Pordes, D. Petravick, B. Kramer, D. Olson, M. Livny, A. Roy, P. Avery, K. Blackburn, T. Wenaus, F. Würthwein, I. Foster, R. Gardner, M. Wilde, A. Blatecky, J. McGee, and R. Quick, “The open science grid,” J. Phys.: Conf. Ser. 78, 012057 (2007).
- Sfiligoi et al. (2009) I. Sfiligoi, D. C. Bradley, B. Holzman, P. Mhashilkar, S. Padhi, and F. Wurthwein, “The Pilot Way to Grid Resources Using glideinWMS,” in 2009 WRI World Congress on Computer Science and Information Engineering, Vol. 2 (2009) p. 428.
- Mayo et al. (1990) S. L. Mayo, B. D. Olafson, and W. A. Goddard, “DREIDING: a generic force field for molecular simulations,” The Journal of Physical Chemistry 94, 8897 (1990).
- Zhuo et al. (2008) S. Zhuo, Y. Huang, J. Hu, H. Liu, Y. Hu, and J. Jiang, “Computer Simulation for Adsorption of CO2, N2 and Flue Gas in a Mimetic MCM-41,” J. of Phys. Chem. C 112, 11295 (2008).
- Jing et al. (2013) Y. Jing, L. Wei, Y. Wang, and Y. Yu, “Molecular simulation of MCM-41: Structural properties and adsorption of CO2, N2 and flue gas,” Chem. Eng. J. 220, 264 (2013).
- Chang et al. (2015) S.-C. Chang, S.-Y. Chien, C.-L. Chen, and C.-K. Chen, “Analyzing adsorption characteristics of CO2, N2 and H2O in MCM-41 silica by molecular simulation,” Appl. Surf. Sci. 331, 225 (2015).
- Kumar and Kumar (2018) K. Kumar and A. Kumar, “Adsorptive separation of carbon dioxide from flue gas using mesoporous MCM-41: A molecular simulation study,” Korean J. Chem. Eng. 35, 535 (2018).
- Ho et al. (2011) L. N. Ho, J. Perez Pellitero, F. Porcheron, and R. J.-M. Pellenq, “Enhanced CO2 Solubility in Hybrid MCM-41: Molecular Simulations and Experiments,” Langmuir 27, 8187 (2011).
- Williams et al. (2016) C. D. Williams, K. P. Travis, N. A. Burton, and J. H. Harding, “A new method for the generation of realistic atomistic models of siliceous MCM-41,” Microporous Mesoporous Mater. 228, 215 (2016).
- Bródka and Zerda (1996) A. Bródka and T. W. Zerda, “Properties of liquid acetone in silica pores: Molecular dynamics simulation,” J. Chem. Phys. 104, 6319 (1996).
- Ferreiro-Rangel et al. (2014) C. A. Ferreiro-Rangel, N. A. Seaton, and T. Düren, “Grand-Canonical Monte Carlo Adsorption Studies on SBA-2 Periodic Mesoporous Silicas,” J. Phys. Chem. C 118, 25441 (2014).
- Schumacher et al. (2006) C. Schumacher, J. Gonzalez, P. A. Wright, and N. A. Seaton, “Generation of Atomistic Models of Periodic Mesoporous Silica by Kinetic Monte Carlo Simulation of the Synthesis of the Material,” J. Phys. Chem. B 110, 319 (2006).
- Talu and Myers (2001) O. Talu and A. L. Myers, “Reference potentials for adsorption of helium, argon, methane, and krypton in high-silica zeolites,” Colloids Surf., A 187, 83 (2001).
- Zhang et al. (2016) S. Zhang, M. Perez-Page, K. Guan, E. Yu, J. Tringe, R. H. R. Castro, R. Faller, and P. Stroeve, “Response to Extreme Temperatures of Mesoporous Silica MCM-41: Porous Structure Transformation Simulation and Modification of Gas Adsorption Properties,” Langmuir 32, 11422 (2016).
- Coasne and Fourkas (2011) B. Coasne and J. T. Fourkas, “Structure and Dynamics of Benzene Confined in Silica Nanopores,” J. Phys. Chem. C 115, 15471 (2011).
- Hill and Sauer (1994) J. R. Hill and J. Sauer, “Molecular mechanics potential for silica and zeolite catalysts based on ab initio calculations. 1. Dense and microporous silica,” J. Phys. Chem. 98, 1238 (1994).
- Herdman et al. (2014) C. M. Herdman, A. Rommal, and A. Del Maestro, “Quantum Monte Carlo measurement of the chemical potential of 4He,” Phys. Rev. B 89, 224502 (2014).
- Jang et al. (2001) S. Jang, S. Jang, and G. A. Voth, “Applications of higher order composite factorization schemes in imaginary time path integral simulations,” J. Chem. Phys. 115, 7832 (2001).
apsrev41Control