VINTERGATAN I: The origins of chemically, kinematically and structurally distinct discs in a simulated Milky Way-mass galaxy
Abstract
Spectroscopic surveys of the Milky Way’s stars have revealed spatial, chemical and kinematical structures that encode its history. In this work, we study their origins using a cosmological zoom simulation, VINTERGATAN, of a Milky Way-mass disc galaxy. We find that in connection to the last major merger at , cosmological accretion leads to the rapid formation of an outer, metal-poor, low- gas disc around the inner, metal-rich galaxy containing the old high- stars. This event leads to a bimodality in over a range of . A detailed analysis of how the galaxy evolves since is presented. We demonstrate the way in which inside-out growth shapes the radial surface density and metallicity profile and how radial migration preferentially relocates stars from the inner to the outer disc. Secular disc heating is found to give rise to increasing velocity dispersions and scaleheights with stellar age, which together with disc flaring explains several trends observed in the Milky Way, including shallower radial -profiles above the midplane. We show how the galaxy formation scenario imprints non-trivial mappings between structural associations (i.e. thick and thin discs), velocity dispersions, -enhancements, and ages of stars, e.g. the most metal-poor stars in the low- sequence are found to have a scaleheight comparable to old high- stars. Finally, we illustrate how at low spatial resolution, comparable to the thickness of the galaxy, the proposed pathway to distinct sequences in - cannot be captured.
Keywords:
galaxies: formation – galaxies: evolution – galaxies: structure – Galaxy: abundances – Galaxy: formation – methods: numerical1 Introduction
Understanding how galaxies form and evolve is a central theme in modern astrophysics. The Milky Way, being the one galaxy that we can study in exquisite detail, provides a fundamental testbed for theories of galaxy formation and evolution (Freeman & Bland-Hawthorn 2002). Central to the discussion of the Milky Way’s origins is the concept of distinct thin and thick stellar disc components (Rix & Bovy 2013, for a review, see). A structural dichotomy was first discovered by Gilmore & Reid 1983 who used star counts towards the South Galactic Pole to demonstrate that the vertical stellar distribution could not be fit with a single exponential profile. Rather, two exponentials with different scaleheights were required. Such geometrically separated discs have subsequently been observed in other galaxies in the local Universe (Dalcanton & Bernstein 2002, e.g.). Spectroscopic studies of Solar neighborhood stars have established that the Milky Way disc also features chemically distinct components (Fuhrmann 1998; Feltzing et al. 2003; Bensby et al. 2003; Adibekyan et al. 2013; Bensby et al. 2014), specifically between the abundance ratio of -elements relative to iron () over a wide range of metallicities (). Today this chemical bimodality is observed throughout the Galactic disc (Hayden et al. 2015).
The stellar population with high could have formed rapidly in the early stages of the Milky Way’s past when it was compact and gas rich. The proto-galactic gas was then enriched primarily with -elements synthesised and promptly released by core collapse supernovae (SNe). The population of stars in the low- sequence is on the other hand younger, and could form from gas in a more extended disc enriched by type Ia SNe (SNIa) that occur over long timescales (Matteucci & Greggio 1986, billions of years since the Galaxy started to form,). This general picture is supported by observations where the high- disc population is found to be thicker (Reddy et al. 2003), more radially compact (Bensby et al. 2011) and older (Bensby et al. 2014; Feuillet et al. 2019, ,) than the low- component (which features stars with ages ). In addition, old -enhanced stars in the Solar neighbourhood are observed to be kinematically hotter (Holmberg et al. 2009, e.g.), with a higher mean velocity dispersion () than the -poor stars (Lee et al. 2011; Hayden et al. 2019, ,).
However, the notion of distinct discs in the Milky Way is still debated. By studying stars with similar elemental abundances, so-called mono abundance populations, Bovy et al. 2012c argued that there is no clear separation between structurally thin and thick discs, but rather a smooth transition (see also Bovy et al. 2016). In essence, there is not always a well defined mapping between the structural associations (thick or thin disc), -enhancements, or ages of stars (Mackereth et al. 2017; Minchev et al. 2017, see also).
These complex structural and chemo-dynamical trends may uniquely encode how the Galaxy formed and evolved (Freeman & Bland-Hawthorn 2002; Bland-Hawthorn et al. 2019), which is why it is important to develop a theoretical framework for their origins. Several mechanisms for creating structurally thick and kinematically hot discs exist in the literature, including vertical disc heating by satellite encounters (Quinn et al. 1993; Kazantzidis et al. 2009), accretion of satellite stars (Abadi et al. 2003; Read et al. 2008), star formation in turbulent gas rich discs (Bournaud & Elmegreen 2009), heating by giant molecular clouds (Aumer et al. 2016, e.g.), and secular formation by radial migration of kinematically hot stars from the inner to the outer disc (Sellwood & Binney 2002; Loebman et al. 2011).
A number of theories for how chemically distinct discs form have been put forward over the past decades. We highlight two models from the literature that are both able to reproduce abundance gradients in the Milky Way disc as well as broadly explain observed abundance trends in the Solar neighbourhood. The first was pioneered by Chiappini et al. 1997 (for variations and refinements, see e.g. Haywood et al. 2013, Spitoni et al. 2019) and is often referred to as the ‘two-infall model’. In this model an initial phase of star formation, rapid enough to be unpolluted by SNIa, results in the formation of the high- sequence. Star formation is then assumed to proceed inefficiently with the remaining gas becoming enriched by SNIa, reducing its . A second period of low metallicity gas infall subsequently lowers the metallicity of the interstellar medium. This leads to the buildup of a low- population of stars that overlaps with the high- sequence in terms of . The second model is by Schönrich & Binney 2009 and postulates that the two chemically distinct components represent the equilibrium star formation conditions in different parts of the disc. Radial migration of stars via cold torquing, also known as ‘churning’, by a bar and spiral waves (Sellwood & Binney 2002; Roškar et al. 2008; Minchev et al. 2013) then allows for the populations to spatially overlap in the Solar neighbourhood.
Galaxy chemical evolution models, such as the one by Chiappini et al. 1997, are useful tools to in a computationally efficient way probe the roles of various physical processes. While informative, they are phenomenological by construction with many degrees of freedom and unknown parameters such as gas infall rates and star formation depletion timescales, which limit their predictive power (Andrews et al. 2017, for a recent overview, see). As a complement to such models, cosmological hydrodynamical simulations of galaxy formation come with less simplifying assumptions, although with a higher computational cost and the added complexity of directly modelling processes such as star formation and stellar feedback robustly (Naab & Ostriker 2017, for a review, see). Furthermore, low numerical resolution has made cosmological simulations unsuited for studying the internal structure of galaxies, leading to predominantly thick, kinematically hot discs (House et al. 2011). This hurdle has only recently been overcome, with several authors reporting on thin, kinematically cold disc components (Bird et al. 2013; Martig et al. 2014; Agertz & Kravtsov 2015; Grand et al. 2017; Hopkins et al. 2018; Buck et al. 2020; Bird et al. 2020, e.g.).
Generic predictions of cosmological simulations of Milky Way-mass spiral galaxies are an inside-out formation scenario of stellar discs (Abadi et al. 2003; Agertz et al. 2011; Brook et al. 2012; Stinson et al. 2013; Garrison-Kimmel et al. 2018) due to the steady buildup of angular momentum from large scale tidal torques (Peebles 1969; Fall & Efstathiou 1980; Pichon et al. 2011) coupled to a non-destructive contribution of accreting gas to the disc’s angular momentum reservoir (Sales et al. 2012; Kretschmer et al. 2020). Furthermore, cosmological simulations tend to reproduce the observed ‘upside-down’ disc formation scenario, with old stars residing in thicker discs compared to young stars (Bird et al. 2013). This is due to disc thickening from early epochs of (gas rich) mergers (Brook et al. 2004, e.g.), in addition to the secular heating processes discussed above.
Despite this progress, the situation is less clear for chemically distinct discs, with the mere existence of a chemical bimodality being difficult to reproduce in a cosmological context. Mackereth et al. 2018 used the large volume EAGLE simulation and concluded that the scarcity of simulated galaxies exhibiting distinct sequences indicates that the Milky Way cannot be representative of the broader population of disc galaxies. Zoom simulations of Milky Way-like galaxies, that can reach higher numerical resolution, have also been unable to recreate this Milky Way feature (Ma et al. 2017, e.g.), raising the question as to whether it is a rare feature of disc galaxies.
In contrast, a number of authors have recently reported on higher fractions of bimodalities in simulations of disc galaxies. A range of explanations for their origins have been put forward, including gas-rich mergers (Brook et al. 2012; Grand et al. 2018; Buck 2020) and rapid star formation in high redshift clumps (Clarke et al. 2019), with varying conclusions regarding the importance of secular processes such as radial migration (Minchev et al. 2013). Clearly, a consensus regarding the formation channels of chemically distinct galactic disc components, and their connection to structural and kinematical thin and thick discs has not yet been reached. New generations of cosmological simulations are required to interpret observations and advance our theoretical understanding.
In this first paper in a series, we make use of a new high resolution cosmological simulation to identify the physical mechanisms that lead to the formation of chemical, kinematical and spatial thick and thin discs in a Milky Way-mass galaxy11
1
Movies are available at
http://www.astro.lu.se/~florent/vintergatan.php. In a companion paper, Renaud
et al. 2020a (hereafter 141), we extend on the work presented here and identify the contributions of the in situ and accreted material as well as role of galaxy interactions and mergers. In Renaud et al. 2020b (hereafter 142), we explore the role played by the assembly of an extended, outer gaseous disc at in forming the most metal-poor stars in the simulated galaxy.
This paper is organized as follows. In Section 2 we present the numerical method, including our choice of galaxy formation physics and simulation setup. In Section 3.1, we outline general properties of our simulated galaxy, followed by an overview and formation scenario of its chemical structure in Sections 3.2 and 3.3. In Sections 3.4 and 3.5, we present a detailed analysis of how the internal structure evolves over the past 8 billion years. We connect the chemical, kinematical and spatial structures using mono-abundance populations in Section 3.6. Finally we discuss and conclude our results in Sections 4 and 5, respectively.
2 Method
2.1 Simulation setup
We base our analysis on a cosmological hydrodynamic+-body zoom-in simulation of a Milky Way-mass galaxy carried out with the adaptive mesh refinement code RAMSES (Teyssier 2002).
We first performed a dark matter-only simulation with particles in a periodic box with size assuming a flat -cold dark matter cosmology with , , , and . The initial conditions were generated with the MUSIC code (Hahn & Abel 2011). We note that these are the same initial conditions as the ‘m12i’ halo from Hopkins et al. 2014 and Wetzel et al. 2016, drawn from the volume used in the AGORA galaxy formation comparison project (Kim et al. 2014; Kim et al. 2016). At , a dark matter halo with (radius of a sphere with a density 200 times the mean cosmic matter density) and virial mass was identified. The halo experiences its last major merger at a lookback time of , in agreement with what we know about the Milky Way’s history (Ruchti et al. 2015). Particles inside at were then traced back to where the numerical resolution in the Lagrangian volume was increased (Hahn & Abel 2011, for details, see), resulting in dark matter particles with masses of and gas mass resolution of .
Mesh refinement is based on a pseudo-Lagrangian approach, where a cell is split if its baryonic mass (gas and stars) exceeds 8 times the initial gas mass resolution. In addition, a cell is allowed to refine if it contains more than 8 dark matter particles. This allows the local force softening to closely match the local mean inter-particle separation, which suppresses discreteness effects (Romeo et al. 2008, e.g.). The maximum refinement level is set to allow for a mean constant physical resolution of in the dense interstellar medium (ISM).
For the hydrodynamics, we use the HLLC Riemann solver (Toro et al. 1994) and the MinMod slope limiter to construct gas variables at cell interfaces from their cell-centred values. To close the relation between gas pressure and internal energy, we use an ideal gas equation of state with an adiabatic index .
With the high resolution region embedded in the full (lower resolution) cosmological box, the simulation was evolved with hydrodynamics and galaxy formation physics (see Section 2.2) to where it was stopped due to the high numerical cost. Motivated by the slow, gradual secular evolution of the galaxy at late times, we use the last simulation snapshot as a proxy for present-day conditions.
2.2 Galaxy formation physics
The adopted star formation and feedback physics is presented in Agertz et al. 2013 and Agertz & Kravtsov 2015; Agertz & Kravtsov 2016. Briefly, star formation is treated as a Poisson process, sampled using star particles, occurring on a cell-by-cell basis according to the star formation law,
| (1) |
Here is the star formation rate density, the gas density, is the local free-fall time, is the star formation threshold, is the maximum allowed temperature of star forming gas, and is the local star formation efficiency per free-fall time of gas in the cell. The efficiency is computed following the relation from Padoan et al. 2012, derived from simulations of star formation in magnetized supersonic turbulence22 2 , where is the dynamical time and is the local velocity dispersion. The latter is computed using neighbouring gas cells over a region of size 3 grid cells per spatial dimension.. This favours star formation in unstable gas, with a majority of stars in the simulation found to form at very high densities, , rather than close to the adopted threshold. The resulting mean efficiency is per cent, with local values varying by over two orders of magnitude, in agreement with observed star formation efficiencies in the Milky Way’s giant molecular cloud population (Lee et al. 2016).
Each formed star particle is treated as a single-age stellar population with a Chabrier 2003 initial mass function. We account for injection of energy, momentum, mass and heavy elements over time from core collapse SN, SNIa and stellar winds and radiation pressure on the surrounding gas. Each mechanism depends on stellar age, mass and gas/stellar metallicity (Raiteri et al. 1996, through the metallicity dependent age-mass relation of), calibrated on the stellar evolution code STARBURST99 (Leitherer et al. 1999). The modelled stellar mass loss leads to star particles losing up to 50 per cent of their mass over a Hubble time (Leitner & Kravtsov 2011, see also).

 |
 |

To account for the effect of SN feedback, we adopt the model suggested by Kim & Ostriker 2015. They demonstrated (Martizzi et al. 2015, see also) that in order to capture the momentum injection from individual SNe, the cooling radius33 3 The cooling radius in gas with density and metallicity scales as for a SN explosion with energy erg (Cioffi et al. 1988; Thornton et al. 1998, e.g.). must be captured by at least three grid cells to avoid numerical overcooling. In this work we adopt six grid cells per cooling radius as a minimum requirement for SNe to be considered as resolved. If this criterion is fulfilled, we initialize the explosion in the ‘energy conserving’ phase by injecting per SN into the nearest grid cell. When insufficient resolution is available, the explosion is instead initialized in its ‘momentum conserving’ phase, with the momentum built up during the Sedov-Taylor phase injected into cells surrounding the star particle. The adopted relation for the momentum is (Blondin et al. 1998; Kim & Ostriker 2015; Hopkins et al. 2018, e.g.), where is the total energy injected by SNe in a cell with gas density and metallicity compared to Solar ().
We track iron (Fe) and oxygen (O) abundances separately, with yields taken from Woosley & Heger 2007. When computing the gas cooling rate, which is a function of total metallicity, we construct a total metal mass following
| (2) |
according to the mixture of alpha (C, N, O, Ne, Mg, Si, S) and iron (Fe, Ni) group elements for the Sun (Asplund et al. 2009). The code accounts for metallicity dependent cooling by using the cooling functions by Sutherland & Dopita 1993 for gas temperatures of K, and rates from Rosen & Bregman 1995 for cooling down to lower temperatures. Heating from the ultraviolet background radiation is modelled following Haardt & Madau 1996, assuming a reionization redshift of (Courty & Alimi 2004, implemented following), with gas self-shielding following Aubert & Teyssier 2010. Finally, we adopt an initial gas metallicity (accounted for purely in oxygen, see discussion in Agertz et al. 2020) in the high-resolution zoom-in region in order to account for enrichment from unresolved population III star formation (Agertz et al. 2009; Wise et al. 2012, see e.g.).
2.3 Abundance ratios
A focus of our study is the relation between different elemental abundance ratios and how, when, and where these are built up. Specifically, we will trace and , where stands for ‘alpha-element(s)’. The -elements relative to iron are understood to track the relative contribution of core collapse SNe and SN Ia (Matteucci 2001). In observational studies of stars in the Milky Way, -elements are generally taken to be one or several of the elements O, Mg, Si, Ca, and Ti and an -elemental abundance is then calculated as a mean of some or all of these elemental abundances (Edvardsson et al. 1993, see, e.g. ). Sometimes, the overall abundance of all -elements is derived directly in the analysis (Hayden et al. 2015, e.g.,).
Ideally, several of these elements should be traced as their formation channels differ (Carlin et al. 2018, see e.g. discussions in). However, it is computationally expensive to include a large number of element in a simulation like VINTERGATAN. We therefore use oxygen as an approximation for all -elements (Segers et al. 2016; Mackereth et al. 2018, see also). We compute chemical abundances for a star particle as
| (3) |
where and are the considered elements, and are their respective atomic masses, and and are their respective metal mass fractions. Abundances relative to Solar ( and ) are taken from Anders & Grevesse 1989, where Solar mass fractions of O and Fe are 0.0097 and 0.00185 respectively.
3 Results
3.1 General properties and comparison to observations
We begin by highlighting a number of moments during the simulated galaxy’s history using the composite multi-wavelength maps presented in Fig. 1. At (lookback time Gyr) mergers are frequent, leading to an irregular morphology. Over the subsequent billions of years, a compact star forming disc starts to emerge. At a lookback time of , a galaxy with a stellar mass interacts with the main progenitor (), and the two galaxies coalesce at ( ago). This is the last major merger (hereafter LMM), and it marks the epoch when a bimodality in - begins to form. As we will demonstrate below, the bimodality arises from cosmological gas accretion at this epoch, and is hence an indirect effect of the LMM. At , only minor mergers take place, and stars form in an extended secularly growing disc through to the current epoch. The final galaxy is a spiral galaxy with (measured within kpc) residing in a dark matter halo with virial mass (Bryan & Norman 1997, following the definition by) . As such, the galaxy formation efficiency is per cent, in agreement with results from abundance matching (Moster et al. 2010; Behroozi et al. 2013; Kravtsov et al. 2014, e.g.).
Next, we compare the simulation to a number of observed disc galaxy characteristics, including properties of the Milky Way. We view this as a necessary ‘validation step’ to warrant a closer examination of the galaxy’s internal structure. The left panel of Fig. 2 shows the stellar surface density profile of the simulated galaxy, together with data from late type galaxies from the THINGS sample (Leroy et al. 2008) in the stellar mass range , as well as the Milky Way. The latter uses a combination of best-fit parameters for the thin and thick stellar discs and bulge from McMillan 2011. The simulation produces a surface density profile in excellent agreement with local late type galaxies, and features the same exponential scalelength44 4 Defined via the exponential surface density profile , with being the central density. () as found by McMillan 2011 for the Milky Way’s thin disc.
We note that unlike the Milky Way, the simulated galaxy does not feature a bar which can hamper an in-depth structural comparison of the central kiloparsecs. The final galaxy’s neutral gas fraction (atomic and molecular hydrogen) is per cent, which is compatible with the Milky Way (Ferrière 2001) as well as spiral galaxies of similar stellar mass (Catinella et al. 2010; Dutton et al. 2011).
The right panel of Fig. 2 shows the rotational velocity () as a function of galactocentric radius () compared to Milky Way data from the extensive literature compilation of by Pato & Iocco 201755 5 The Milky Way data assumes that the distance from the Sun to the Galactic centre is kpc, the Suns rotational velocity and peculiar Solar motions .. The simulation’s rotational velocity profile was computed at the final simulation time, considering the tangential velocity of stars formed in the last . Near identical results are recovered when considering the motion of atomic gas. The rotation curve rises to at kpc and broadly matches the shape and normalisation of the Milky Way’s rotation curve, although large observational uncertainties exist beyond kpc.
Finally, we turn to the star formation history () of the galaxy shown in Fig. 3. The star formation rate () is computed considering only the mass in stars () formed within the last Myr of each simulation snapshot, with . This allows for a direct comparison to the mean observed star formation rate of galaxies with stellar masses up to redshifts from the 3D-HST v2.1 catalogs (Skelton et al. 2014) adapted from van Dokkum et al. 2013, with the dashed line showing the best-fit relation. The simulated features a number of peaks and valleys, indicating epochs of starburst activity triggered by mergers and galaxy interactions, episodically reaching66 6 The precise peak SFRs depend on the adopted (observationally, the considered star formation rate tracer). a at . The overall normalisation and shape of the SFH matches observations, furthering the notion that the simulated galaxy can be viewed as representative of late-type spiral galaxies.
The galaxy’s size, luminosity and rotational velocity make it compatible with observed scaling relations such as the Tully-Fisher and size-luminosity relations (Courteau et al. 2007). Furthermore, its specific angular momentum content is compatible with observed late-type spiral galaxies (Fall & Romanowsky 2013, ,). Finally, Rhodin et al. 2019 demonstrated, using this particular simulation, that its circum-galactic medium (CGM) features strong H absorbers, observed as damped Ly- system in background quasar spectra, at impact parameters and metallicities in agreement with observations.
We emphasize that this simulation does not aim at reproducing the Milky Way star-by-star. Nonetheless, our simulation, which we call VINTERGATAN77 7 Swedish for the Milky Way, translating literally to ‘The Winter Street’., matches a range of observed characteristics of galaxies with luminosities and masses similar to the Milky Way. This motivates an in-depth study of how its internal chemical, kinematical and structural properties came to be, which we turn to in the next sections. In future work we will study how changes to the cosmological merger history (Pontzen et al. 2017; Rey et al. 2019; Rey et al. 2020, see e.g.) affects such observables.
 |


3.2 A chemically bimodal galaxy
At the last instance of the simulation, we select all stars at galactocentric radii and heights from the midplane for analysis. Stellar ages and lookback times are henceforth computed in relation to . The top panel in Fig. 4 shows the - plane, and we begin by noting that this galaxy is dex (i.e. roughly a factor of two) more enhanced in -elements as compared to the Milky Way. This does not only stem from the specific accretion and outflow history of the galaxy, but also from details of the adopted IMF, stellar yields, and rate of SNIa explosions (Marinacci et al. 2014; Naiman et al. 2018; Philcox et al. 2018, see e.g.). We discuss this topic further in Section 4.2, but leave an in-depth investigation of these ingredients for future work.
In qualitative agreement with the Milky Way, the distribution is bimodal in . Two distinct sequences can be seen, separated by 0.1-0.2 dex in around for . At high , the two sequences connect. The chemical plane is structured, which stems from merger events and starbursts triggered by interactions (in 141, we link each notable feature to its physical cause). This burstiness is also visible in the -age relation in the middle panel, where the epoch of the LMM (9 Gyr ago, ) is indicated with a grey band. On average, decreases over time as SNIa enrich the ISM/CGM. After the epoch of the LMM all stars form in the low- sequence, with a narrow range in .
In contrast, stars form with a range of metallicities at all instances in the galaxy’s past, as shown in the -age relation in the bottom panel of Fig. 4. A number of features are worth highlighting in this panel. Before the LMM, the galaxy’s has gradually grown to supersolar values. Subsequently, a low- feature forms, extending to . This feature entails simultaneous low and high- star formation in a narrow range of (see middle panel of Fig. 4). Furthermore, it marks the onset of a chemically bimodal galaxy, as stars formed with the same low a few billion years prior are -enhanced. Following this event, stars form, for a few billion years, in two well separated populations in terms of , with few stars around . We next demonstrate how these chemical properties relate to the way in which the galaxy’s disc assembled.

3.3 How does the bimodality form?
Fig. 5 shows the large-scale (140 kpc across) gaseous environment around VINTERGATAN at and . From top to bottom, the panels show density-weighted averages along the line of sight88 8 Each pixel value is computed as , where is the position along the line of sight, is the gas density and is the quantity of interest. for gas density, gas and gas .
At , the galaxy is compact with a metal-rich ( ) ISM. The CGM is -enhanced (shown in blue in the middle panels) due to core collapse SNe-enriched outflows at early times, with feedback driven bubbles of SNIa-enriched low- gas (shown in red). Vigorous feedback-driven outflows and the destructive nature of mergers have not yet allowed for an extended disc to form (Dekel et al. 2019, for a more recent analysis on disc growth vs. merger rate, see ). Large scale tidal torques continuously increase the angular momentum content in the gas that accretes onto the growing halo (Pichon et al. 2011), a process that favours the formation of extended discs at late cosmic times (Sales et al. 2012; Übler et al. 2014; Agertz & Kravtsov 2016, e.g.).
At , cold (K), metal-poor ( ) large scale gaseous flows, together with gas lost from satellites interacting with the gaseous halo, reach the inner parts of the dark matter halo. Some of this gas dilutes the disc, leading to a lowering of the highest attainable stellar , as seen in the bottom panel in Fig. 4. The infalling gas is rich in angular momentum, leading to the formation of an extended disc over the next few 100 Myr, as seen in the panels in Fig. 5. This event is rapid, as quantified in Fig. 6 which shows how the half-mass radius of the cold ISM increases from kpc at to kpc at : a two-fold increase in size in just Myr. In 142, we present an in-depth analysis of this event, as well as the physical processes that trigger the onset of the low- sequence from its metal-poor end. This mechanism is central in the assembly of the bimodality and the extended disc, which we briefly outline next.
The newly formed structure is an outer, metal-poor ( , see panel in Fig. 5) detached gas disc, with an angular momentum vector that does not coincide with that of the inner disc’s. Furthermore, the disc is low in due to the low- nature of the filamentary gas flows and the gas accreting from the CGM (shown in red in the middle panels). This results in the formation of the most metal-poor stars in the galaxy’s low- sequence. By , the outer disc has become massive enough to contain large star forming clumps, and is surrounded by a low- CGM out to .


We quantify the above chain of events in Fig. 7 which shows the evolution of the ISM in terms of its cold () gas surface density (), and . In the local Universe, star formation on kpc-scales is observed to be inefficient for surface densities less than a few (Bigiel et al. 2008), which we indicate in red in the top panel. The rapid outer disc formation phase at is apparent in , with star formation since then becoming possible at . At , the difference in the inner and outer disc’s metallicity is striking, with the radial -profile (bottom panel) decreasing by 1 dex from supersolar values at to in the outer disc, all at the same uniform (low) (middle panel). It is this property that leads to the co-existence of the high-and low- stellar populations discussed in the previous section (bottom panel of Fig. 4). Furthermore, the fact that the ISM at earlier times featured a higher at equally low (dark blue line in Fig. 7) is what allows for a chemical bimodality to exist in the stars. A time series of how the stellar - plane is built up from this process is presented in Appendix A.
We emphasize that even though the emergence of the low- sequence coincides with the epoch of LMM, it is not the infall and mixing of the entire ISM of another galaxy that allows for the bimodality to form (Buck 2020, but see e.g.). In fact, the ISM of the merging galaxy is too metal-rich ( , see Fig. 5 and 141) to give rise to the chemical bimodality. Rather, the massive merger is here found to mark a time when significant amounts of gas mass and angular momentum growth takes place due to cosmological cold flows and stripped gas from satellite galaxies. In addition, outflows and galaxy interactions compress the CGM (which is low in and ), triggering enhanced gas cooling. This leads to cloud formation via thermal instabilities (Binney et al. 2009; Joung et al. 2012) and accretion (Hobbs et al. 2015) that further promotes the outer disc to grow. The condensation of cold gas from the hot halo is visually apparent in the top right panel of Fig. 5, and has observational implications in terms of detectability and covering fractions of atomic hydrogen around galaxies (Rhodin et al. 2019, e.g.).
3.4 Disc growth and secular evolution in the past 8 billion years
Having established the mode of high redshift disc assembly, the next sections focus on how the galaxy grows and evolves to the current epoch. This allows us to understand whether or not, and how, the seemingly non-trivial formation scenario relates to the Milky Way and local spiral galaxies. To bring context to our results we contrast them to observational and theoretical work throughout.
After the outer disc has formed, the spatial structure of the galaxy is complex. Fig. 8 shows a time sequence of stellar bolometric luminosities, with the galaxy aligned to the disc plane defined by the inner disc (). The outer disc that begins to form ago defines its own disc plane, with stars forming almost orthogonally to the inner disc. Over subsequent billions of years, the inner and increasingly more massive outer disc gravitationally torque, leading them to align more closely over time. This process eventually allows for coherent spiral structure and radial mixing of stars throughout the entire galaxy. Since a lookback time of , no signs of the initial misalignment can be found, apart from a warp at large radii. In 142, we explore observational consequences of the misaligned discs.

3.4.1 Stellar surface density profiles
The top left panel in Fig. 9 shows the evolution of radial stellar surface density profiles since . All profiles are well fitted by single or broken exponential profiles – a generic feature of stellar scattering (Elmegreen & Struck 2013, e.g.). The profile inside 2 kpc does not evolve over the entire time span, in agreement with the observationally inferred evolution of current day Milky Way-mass galaxies presented in van Dokkum et al. 2013. In contrast, at larger radii () the galaxy grows smoothly over time, with an exponential scalelength at , increasing monotonically to at . In the simulation’s Solar vicinity (, Bland-Hawthorn & Gerhard 2016) the surface density is , close to what is observed in the Milky Way (Flynn et al. 2006; Bovy et al. 2012a, , e.g.).
In the Milky Way, the observed disc scalelength depends on properties of the underlying stellar populations, in particular the distribution of ages and elemental abundances (Bovy et al. 2016; Mackereth et al. 2017, e.g.). In the top right panel of Fig. 9 we explore this concept in VINTERGATAN by showing surface densities separately for stars in the low- and high- sequence (split at ), i.e. the ‘chemically defined’ thin and thick discs. The young, low- disc is well approximated by an exponential profile with , whereas the older high- disc is smaller with . By restricting the analysis to , hence avoiding stars where the sequences connect in -, the size difference is even greater, with disc scalelengths of and in the low-and high- sequence, respectively. Such size differences are observed in the Milky Way where the low- thin disc has twice the scalelength of the high- thick disc, with and respectively (Bensby et al. 2011, see also Cheng et al. 2012 and Bensby et al. 2014). Further sub-division into individual mono abundance populations reveals an entire range of scalelengths in the Milky Way (Bovy et al. 2012b, ,), with the largest values recovered for low-, low- stellar populations, akin to the VINTERGATAN simulation (dashed red line in Fig. 9).
The origin of the thick/thin disc size diversity ultimately relates to the formation time of different components. Tidal torques from large scale structures continuously increase the specific angular momentum content of accreting gas over time (Peebles 1969; Fall & Efstathiou 1980; Pichon et al. 2011). A late formation time hence favours disc formation (Mo et al. 1998, e.g.), but this is not a sufficient criterion; accreting gas must also add constructively to the galaxy’s angular momentum reservoir for extended discs to form (Sales et al. 2012; Kretschmer et al. 2020). This line of arguments is broadly why the late-time forming low- population is more extended than the high- one, and why the formation of disc galaxies in general proceeds inside-out.
3.4.2 Radial distribution of metallicities
The bottom left panel in Fig. 9 shows the evolution of the radial -profile since . Each radial bin is the average of stars out to 3 kpc above the midplane. Akin to the surface density profiles, the metallicity in the inner 2 kpc does not evolve over this time, whereas the metallicity gradient in the outer disc smoothly increases from at to at .
In Fig. 9 we compute -profiles separately for low- and high- stars. A steeper gradient is found for the younger low- population for , with , compared to for the high- stars. A similar flattening of the profiles occurs when considering older stars, or stars further away from the disc midplane – a trend observed in the Milky Way (Hayden et al. 2014; Anders et al. 2017). This is due to the fact that both in the Milky Way and VINTERGATAN, high- stars tend to be older and reside in a thick configuration, see Section 3.5 (Minchev et al. 2014; Ma et al. 2017, see also).
However, regardless of abundance cuts, the recovered metallicity gradients are smaller than those found in the Milky Way, where for young stars in the thin disc (Luck et al. 2011; Anders et al. 2017). We can explore the reasons for shallower radial metallicity gradients by studying the metallicity distribution function (MDF), shown in Fig. 10. At all galactocentric radii, the MDFs show a spread in of 1 dex. The inner disc’s MDF peaks at with few stars at sub-solar metallicities. At gradually larger radii, the contribution from low- stars increases, allowing for a peak metallicity at to in the outer disc (). The simulated MDFs are qualitatively similar to those derived for the Milky Way (Hayden et al. 2015, cf. fig. 5 in). However, the outmost radial bins in VINTERGATAN do not reach as low as is observed in the real Milky Way, a sign of a different enrichment history.
Furthermore, the simulation features a greater contribution of stars with supersolar metallicity at all radii. To be specific, the peak at dex found in the inner disc appears as a second, but less prominent, maximum across the entire galaxy, even at . This feature is not observed in the Milky Way’s Solar neighbourhood and beyond, and it contributes significantly to the shallower metallicity gradients discussed above. This high cannot, at least in general, be due to local star formation conditions in the outer, more metal-poor, disc. Rather, is arises due to radial migration of metal-rich stars from the inner regions of the galaxy, which we explore next.

3.4.3 Radial migration and the Solar neighbourhood
While the galactic mass and metal growth since is completely dominated by in situ star formation (see also 141), the radial density and metallicity profiles do not reflect the formation radii of the stars. As discussed in Section 1, migration of stars via churning by a bar or (transient) spiral waves (Sellwood & Binney 2002; Minchev et al. 2013; Mikkola et al. 2020) can mix stars radially.
To understand whether radial migration plays a role in VINTERGATAN, we select at the final simulation time stars around (the ‘Solar neighbourhood’) out to 2 kpc away from the midplane and track them to their formation positions. We limit our analysis to stars formed at , as well as currently being on nearly circular orbits, with , as spiral arm churning preserves orbit circularity. Here is the component of a star particle’s specific angular momentum vector parallel to the galaxy’s net angular momentum and is the specific angular momentum of a circular orbit with the same specific energy as the true orbit, calculated following the approach in El-Badry et al. 2018. Close to , the misaligned nature of the inner and outer discs complicates the notion of a cylindrical formation radius across the galaxy. To mitigate this we instead consider the spherical radius from the center of the galaxy to denote the formation radius.
The left-hand panel of Fig. 11 shows formation radius distributions of the selected stars for different ages. A minority of the oldest star () on nearly circular orbits are born at their current radial location, with the majority having migrated from the inner disc, in agreement with recent theoretical and observational studies of Solar neighbourhood stars (Minchev et al. 2013; Frankel et al. 2018; Minchev et al. 2018; Feltzing et al. 2020, e.g.). This bias of old stars originating from the inner disc is due to the galaxy beyond 4 kpc still assembling ago (Aumer et al. 2017, see also). Subsequent disc growth allows for younger stellar populations to have their formation radius distributions shifted closer to their current radial position. For the youngest stars (), the distribution is nearly symmetric around , indicating that, at least at late times, inward and outward migration are of equal importance. This is expected for spiral arm churning due to angular momentum conservation (Sellwood & Binney 2002).
Migration of older stars from the inner disc entails higher metallicities, as shown in the right-hand panel of Fig. 11; all stars with at the current Solar radius in VINTERGATAN have formed in the inner 5 kpc. This process explains the origin of the high- peaks in the outer disc’s MDFs (Fig. 10). As this feature is not observed in the Milky Way, it indicates that radial migration in VINTERGATAN is more efficient than in the real Milky Way, despite the absence of a bar. The migrated high- stars in the outer disc also contribute to the shallower than observed radial metallicity gradients.
The current average metallicity and stellar density around the Solar circle in VINTERGATAN is hence a mix of stars of all ages, over 1 dex in , and formation radii across the entire galaxy. However, the fact that the young low- population is more extended than the older high- stars, as also observed in the Milky Way, indicates that radial migration cannot wash out all underlying structure provided by inside-out growth of the galaxy (Minchev et al. 2014, as also pointed out by).


 |
3.5 Through thick and thin - vertical structure and kinematics
Having quantified the radial structure and evolution of the disc, we next turn to an analysis of the vertical structure. Fig. 12 shows average stellar ages, and as a function of galactocentric radius and vertical distance from the midplane at the final simulation time. The left panel shows that young stars predominantly reside in a thin flaring disc, with gradually older stellar populations at large distances above the midplane. This is quantified in Fig. 13 which shows the exponential scaleheight99 9 Defined via the vertical density profile of stars with different ages as a function of galactocentric radius. In the inner kiloparsecs, the large stellar and gas surface densities result in small scaleheights, being pc for the youngest age bin. All mono-age populations flare, with monotonically increasing scaleheights for older stars at all radii (Minchev et al. 2015, see also). For example, at , stars in the age range 2-3 Gyr have a scaleheight which increases to for stars with ages of . The notion that young stellar populations reside in a thin as well as a radially more extended disc (as shown in Section 3.3) is commonly referred to as an ‘inside-out, upside-down’ galaxy formation scenario (Bird et al. 2013, e.g.).
Returning to Fig. 12, the -structure in the middle panel mirrors the age structure in the left panel; at all radii a vertical gradient and radial flaring in is present, with low values of found in the thin younger disc and high values in the thick older disc – the canonical picture of a thin vs. thick disc.
The vertical -distribution in the right hand panel reveals why the radial metallicity gradient (see Section 3.4.2) depends on , and by extent also to age and height above the disc’s midplane; while a negative radial metallicity gradient is present in the midplane of the disc, it flattens with increasing height above the midplane. Above the radial gradient even becomes positive in the inner disc (). Again, this a natural outcome of inside-out galaxy growth (the inner galaxy has had more time to enrich) and disc flaring (young low-metallicity stars in the outer disc can be found above the midplane), a property identified in theoretical work by Miranda et al. 2016 and observed in the Milky Way (Anders et al. 2014; Wheeler et al. 2020; Wang et al. 2020, e.g.).
3.5.1 Vertical kinematics and disc heating over cosmic time
The left panel in Fig. 14 shows the age-(vertical) velocity dispersion relation (AVR) for stars at different radii. Across the entire galaxy, young stars are kinematically cold with vertical velocity dispersions in the outer disc (Holmberg et al. 2009; Casagrande et al. 2011; Yu & Liu 2018, compatible with Solar neighbourhood stars in the Milky Way,). The velocity dispersion increases with the age of stellar populations at all radii, meaning the traditional notion of a thick, old, and kinematically hot disc is present. Furthermore, a radial gradient exists at all stellar ages, with stars in the inner disc always having a higher dispersion compared to the stars in the outer disc. We note that this is compatible with disc flaring due the higher surface density in the inner disc1010 10 For a single component isothermal population of stars with an exponential vertical distribution, . At , is 100 times smaller than at , whereas only varies by at most factor of 5 for all stellar ages..
A number of notable features exists in the AVR: at stellar ages , stars predominantly have halo-like kinematics with always in excess of , an outcome of high redshift merger activity (for more details, see 141). For , correlated with the LMM, is constant at any given radius with thick disc kinematics ( for ). This feature is caused by the merger itself (Buck et al. 2020, see also) as well as star formation in the misaligned, gas rich turbulent disc (for a detailed analysis, see 142).
In the last , mergers become more infrequent, leading to gravitational scattering off molecular clouds playing a more significant role for disc heating (Sellwood 2014, for a review, see). As commonly done in the literature, we approximate the AVR by a power-law, , and find that the index depends on the radial position in the galaxy. For , with a gradual increase towards larger galactocentric radii ( and 0.8 at and , respectively). Such radial differences were highlighted by Aumer et al. 2016 (see their fig. 4) who emphasized the role played by the initial conditions, e.g. mass in thick disc component, of the galaxy. However, is unphysical in a system where stars are heated by fluctuations that constitute a stationary random process (Wielen 1977), with to be expected purely from molecular cloud heating based on analytical models (Lacey 1984). Aumer et al. 2016 proposed radial migration as an explanation for their models with ; at any given radial bin, each coeval stellar population of stars that contributes to the AVR are born over a range of galactocentric radii, and have hence undergone different heating histories. As such, the AVR at any location is not produced by a single stationary heating law.
To test this hypothesis we compare, in the right-hand panel of Fig. 14, 1) the AVR for all stars currently residing in the simulation’s Solar neighbourhood (), 2) the initial (formation) velocity dispersions of all stars at this location, and 3) the AVR for stars that formed at this location but never experienced radial migration. We find that non-migrating stars experience a near identical level of heating as the overall population, indicating that in the VINTERGATAN simulation, the AVR does not arise from radial migration. Analogous results were put forward by Minchev et al. 2012 using non-cosmological simulations of barred spiral galaxies.
It is important to emphasize that the Milky Way has experienced significantly less heating than our simulated galaxy, with an observed AVR well fit by (Holmberg et al. 2009, but see Seabroke & Gilmore 2007) and for stars as old as 10 Gyr for (Mackereth et al. 2019). This is a factor of two lower than in VINTERGATAN and hence only compatible with the measured velocity dispersions at formation. The origins of this discrepancy is unclear, but can, at least in principle, indicate that the Milky Way had a calmer formation and merger history (Dorman et al. 2015, for example, velocity dispersions in M31 are significantly higher, with at Gyr,). Being in a cosmological context, minor mergers constitute non-stationary events that heat the disc in a different manner than molecular clouds (Toth & Ostriker 1992; Velazquez & White 1999; Kazantzidis et al. 2009, e.g.). Alternatively, the high velocity dispersions indicate that our simulation, despite high numerical resolution, has experienced non-negligible numerical heating. We return to a discussion of numerical artefacts in Section 4.

3.6 Properties of mono abundance populations
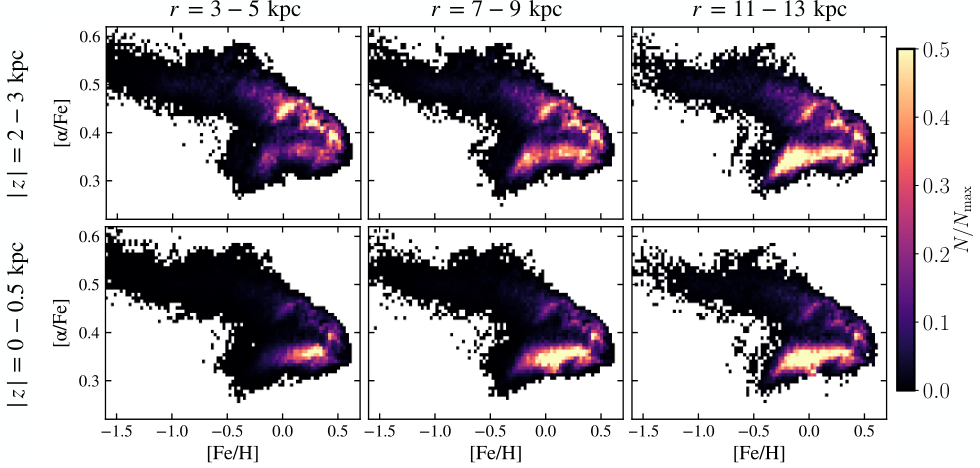
As discussed in Section 1, spatial, kinematical and chemical properties of individual mono abundance populations can map onto each other in complex manners (Rix & Bovy 2013). To shed light on this, we begin by studying the detectability of the - bimodality as a function of radial and vertical location in the disc, shown in Fig. 15. Each panel is normalised using their respective total number of star particles, allowing for a direct comparison with results from APOGEE in Hayden et al. 2015. Regardless of location in the disc, a small number of stars always populate the entire disc’s range in and – an outcome of radial migration and mergers. As shown in Section 3.5, stars in the structural thin disc (within ) are predominantly found to have low . The negative radial gradient manifests itself by the inner disc () having stars narrowly distributed around , whereas populations in the outer disc () extend to .
Above the disc’s midplane (), the high- sequence is present at all radii, with the low- sequence contributing more and more towards the outer disc. At the low- sequence, i.e. the ‘chemical thin disc’, even dominates in terms of number of stars, a signature also observed in the Milky Way, see for example fig. 4 in Hayden et al. 2015. In VINTERGATAN, these trends are a natural consequence of inside-out, up-side down growth (i.e. the age-velocity dispersion and age-scaleheight relations) coupled with disc flaring (Bird et al. 2013; Minchev et al. 2014, see also), which allows for young low- stars to exist several kpc above the disc’s midplane. This property is also observed in the outer disc of the Milky Way (Wang et al. 2020; Huang et al. 2020, e.g. by LAMOST,).
3.6.1 How distinct are disc components?
Fig. 16 illustrates how the notion of thin and thick discs becomes nuanced when considering velocity dispersions (top row), scaleheights (middle row) and average stellar ages (bottom row) for mono abundance populations at different galactocentric radii. In broad strokes, the galaxy features an old, kinematically hot, high-, thick disc, as well as a young, kinematically cold, low- thin disc. However, the transition between these components is not always discontinuous in the - plane. For example, at , low-, low- populations, which are the first stars to form in the outer detached metal-poor disc at , and populations at the same , but with high-, all have scaleheights – a smooth transition between the traditional (chemical) thin and thick disc divide and in qualitative agreement with the Milky Way (Bovy et al. 2012b, e.g.).
A notable feature can be found in the high- part of the high- distribution in the same figure. These stars formed 8-10 Gyr ago, around the time of the LMM, and kinematically they are as cold as the thin disc, with at . They are hence well separated kinematically from stars with halo-like kinematics () at lower in the high- sequence. These stars formed in situ at the time when the galaxy transitioned from its high redshift mode of star formation (frequent mergers, high levels of turbulence, massive star forming clumps, see 141), to a more quiescent mode of star formation persisting to the current epoch.
Finally, average stellar ages are well separated in terms of (see bottom row in Fig. 16), confirming the salient dichotomy of an old -enhanced thick disc and a young -poor thin disc. However, the situation for is more complex. Indeed, in the low- population, at all considered radii, VINTERGATAN features a wide range of for stars born ago. This is a direct outcome of the galaxy formation scenario described in Section 3.3, and interestingly a property also observed in the Milky Way, albeit not at the precise stellar ages recovered in the simulation (Feuillet et al. 2019, see fig. 7 in).
4 Discussion
We propose a formation scenario for chemically, kinematically and structurally diverse disc components that, despite a seemingly tumultuous origin at , leads to a galaxy with current day properties with much in common with those observed in the Milky Way. We next turn to a discussion on how these results compare to other formation channels suggested in the literature, how numerical issues may influence our findings, and whether the proposed chain of events can be supported by observations.
4.1 Comparison to other models
The formation scenario at shares similarities to previous work in the literature. For example, the concept of high redshift gas accretion is central to the classic ‘two-infall’ scenario (Chiappini et al. 1997, e.g.). However, in contrast to such analytical models, it is not the dilution of the preexisting ISM by infalling gas that takes place, but rather the settling of gas into a chemically distinct outer disc. The original two-infall model has problems explaining the high- part of the high- sequence, although recent revisions have improved on the match by postulating a later infall of gas, closer to a lookback time of (Spitoni et al. 2019), the same epoch as identified in VINTERGATAN .
Recent work using cosmological simulations have proposed a number of formation scenarios for the - dichotomy. Using the AURIGA cosmological simulations, Grand et al. 2018 found distinct sequences in 6 out of 30 galaxies forming in Milky Way mass haloes and identified two pathways: 1) an early () and intense high- star formation phase in the inner region () induced by gas-rich mergers, followed by more quiescent low- star formation, and 2) an early phase of high- star formation in an outer disc followed by a shrinking of the gas disc owing to a temporarily lowered gas accretion rate, after which disc growth resumes. Aspects of these scenarios agree broadly with our work, e.g. an early formation epoch of the high- sequence, a late time low- sequence in an extended disc. However, in contrast to our results and the Milky Way, their simulations do not feature any significant overlap between the low-and high- sequences in terms of . Furthermore, their simulated low- sequences do not extend to (see e.g. their fig. 1) at any galactocentric radius, in contrast to what is observed in the Milky Way.
Buck 2020 found bimodal - sequences in 4 out of 6 Milky Way-mass galaxies in the NIHAO_UHD simulations suite (Buck et al. 2020). They argued that it is the dilution of the ISM by a gas-rich merger that allows the disc to lower its while transitioning from high to low- (Brook et al. 2012, see also). As discussed above, in VINTERGATAN it is not the major merger itself that adds the metal-poor gas, nor does the bimodality form due to dilution of the main progenitor’s ISM. Rather, it is cosmological filamentary accretion that gives rise to an outer metal-poor, low- disc. In agreement with our work, Buck 2020 found radial migration to be an important mechanism for shaping the galaxy’s spatial and chemical structure since . As such, radial migration only influences the actual detectability of distinct - sequences at specific radial location across the disc.
Clarke et al. 2019 used a non-cosmological simulation of an isolated galaxy to demonstrate that a chemically bimodal galaxy can arise due to the clumpy nature of star formation, typical in gas-rich high redshift galaxies. In this picture, star formation in massive clumps is rapid and occurs mainly in recently released core collapse SNe ejecta which gives rise to the high- sequence, with more distributed star formation producing the low- sequence. This process is not the main reason for a bimodality in in VINTERGATAN, but it has nonetheless a distinct imprint in the - plane which we explore further in 141.

In contrast to the above studies, Mackereth et al. 2018 found signatures of distinct sequences in only a few per cent out of 133 Milky Way-mass disc galaxies in the EAGLE simulation volume (Schaye et al. 2015). While it is unknown if such scarcity is to be expected in the real Universe, the mixed results and varying detection frequencies in the literature highlights a central issue; without a clear understanding of the formation channels for chemically distinct discs, we do not yet know the physics and numerical resolution required to capture them.
4.2 Numerical issues and model uncertainties
To test the sensitivity of our results to numerical resolution, we resimulated VINTERGATAN with resolution (dark matter particle masses , spatial resolution ) and subgrid galaxy formation physics similar to the large volume cosmological simulation EAGLE1111 11 We adopted the same pressure floor parametrization and restricted stellar feedback to only SNe. The energy released per SN explosion was set to depend on gas metallicity in an identical way to EAGLE. (Schaye et al. 2015). We emphasize that this only serves as an illustration, as the subgrid physics in large volume simulations have been designed and carefully tuned to reproduce specific observables (e.g. galaxy luminosity functions) for a given hydrodynamic scheme and adopted numerical resolution.
While global properties of the galaxy, e.g. stellar disc mass and size, match the high resolution simulation, the disc-wide - distribution now only features a single sequence, as shown in Fig. 17. The gas density distribution and porosity of the ISM and CGM are highly resolution-sensitive, meaning that the way in which gas accretes onto the galaxy, how feedback ejecta propagates, and how gas mixes change with resolution (Ohlin et al. 2019, e.g.). In the low resolution version of VINTERGATAN, cold gas accreting along filaments at is found to rapidly dissolve in the poorly resolved CGM (in contrast to the high resolution case). This in turn alters the way in which gas reaches the galaxy, and prevents a chemically distinct outer disc from forming. The fraction of chemically bimodal galaxies in large volume simulations (Mackereth et al. 2018, e.g.) would likely increase at higher numerical resolution.
Contributing to the diversity of results from galaxy formation simulations is the impact of the adopted subgrid physics and stellar yields. It is today recognised that efficient stellar feedback prescriptions must be included in cosmological simulations (Naab & Ostriker 2017, for a review, see). This allows for simulated galaxy stellar masses to be compatible with the low galaxy formation efficiency predicted by e.g. abundance matching (Moster et al. 2010, e.g.). However, Gibson et al. 2013 demonstrated how some strong feedback models (Stinson et al. 2013, specifically the prescription adopted in the MaGICC suite,), can erase all signatures of a chemical bimodality. The manner in which alternative approaches to stellar feedback, e.g. cosmic rays (Booth et al. 2013) and runaway stars (Andersson et al. 2020), that are less disruptive to the cold ISM, affect the chemical structure of galaxies is an interesting topic for future work.
Furthermore, the - distribution is sensitive to core collapse SNe and SNIa rates (Marinacci et al. 2014; Mackereth et al. 2018). These in turn depend on the underlying IMF (Gutcke & Springel 2019) and stellar binary fraction that cannot be captured in cosmological simulations. Uncertainties associated with parameter choices will propagate into chemical properties of stellar populations (Philcox et al. 2018, for a detailed discussion, see). VINTERGATAN itself is a good example of this, as it features stars with systematically higher than the Milky Way’s by a factor of . This issue has been identified in other recent simulation efforts (Naiman et al. 2018, e.g. IllustrisTNG,) and shown to, at least in part, be mitigated by higher, empirically motivated SNIa rates (Maoz et al. 2014). Tests of VINTERGATAN with higher SNIa rates, run at low resolution, confirm this picture, which we will return to in future work.
The structure and kinematics of galactic discs are also impacted by numerical resolution, a topic that has been studied for many decades. For example, two-body relaxation in galaxy simulations are known to artificially heat stars (Sellwood 2013, e.g.), with -body experiments indicating that over particles are required in the disc alone to mitigate such effects (Solway et al. 2012, e.g.). Coupled to this is the role of force resolution in suppressing gravitational instabilities (Romeo 1994; Romeo 1997, for analytical work, see), which in turn changes spiral wave propagation, the strength of radial migration and stellar scattering. VINTERGATAN features star particles in the disc, but even so we cannot rule out numerical heating and note that the simulation’s stellar velocity dispersions are larger than the Milky Way’s by at least a factor of two (see Section 3.5.1). In fact, as the simulation’s merger history is comparable to what we know about the Milky Way’s history (Ruchti et al. 2015, i.e. no major merger in the past ,), a numerical origin is likely. The only other galaxy for which an observational estimate of the the stellar velocity dispersion as a function of age exists is M31. This galaxy features a kinematically hotter stellar disc and higher inferred heating rate, with a velocity dispersion of for old stars (Dorman et al. 2015), likely due to a recent significant merger (D’Souza & Bell 2018, ago,).
Currently, cosmological simulations tend to not reproduce the low vertical velocity dispersion observed in the Milky Way’s Solar neighbourhood (e.g. House et al. 2011, Sanderson et al. 2020, but see Bird et al. 2020), where over the past (Holmberg et al. 2009). It is safe to claim that the required force and mass resolution for cosmological simulations to robustly capture the interaction between stars, the cold ISM, and stellar feedback processes is not understood, and could be more demanding than what is known from pure -body simulations.
4.3 Observational support for the outer disc formation scenario
The origins of a chemically bimodal galaxy from a rapidly forming, misaligned outer gas disc (surrounding the older inner disc) ago is a central prediction from our simulation. We predict that the outer disc only forms low- stars, with the high- sequence originating either in the inner disc or from accreted satellites (see 141). Moreover, we predict that ago, low-, low- stars in the outer disc formed simultaneously with high- stars in the inner disc. We next discuss these trends in the context of the Milky Way, and whether there are any observational imprints in support of this scenario.
Bensby et al. 2014 conducted a high-resolution spectroscopic study of 714 F and G dwarf and subgiant stars in the Solar neighbourhood. They identified distinct sequences in -, separated around ago (see their fig. 21). An inner-outer disc dichotomy was also identified, with the -enhanced population found to have orbital parameters compatible with being born in the inner Galactic disc, and the low- stars mainly coming from the outer disc, akin to what is found in the VINTERGATAN simulation.
Haywood et al. 2013 outlined observational support of a two-phase formation history including the existence of a separate outer disc at . Based on an analysis of 1111 FGK stars in the Solar neighbourhood, they argued that metal-poor thin disc stars in the Solar vicinity have properties best explained by them originating in an outer disc. These stars can be as old as the youngest thick disc stars ( in their study), indicating that such an outer (thin) disc may have started to form while the thick disc was still forming stars in the inner parts of the Galaxy. This coeval formation scenario is in line with what we find in VINTERGATAN .
Follow-up work by Haywood et al. 2019 refined this scenario and presented arguments for a partitioning of the Milky Way disc ago into an inner and outer region characterized by different chemical evolution. Details of their model differ from ours e.g. they propose the outer Lindblad resonance as a divider of inner and outer regions whereas such a separation arises due to misaligned gas accretion in VINTERGATAN. However, it is encouraging that their schematic predictions for the -, age-metallicity and age- relations are closely aligned with ours (see their fig. 6), specifically the rapid development of a low- stellar population in an extended disc ago.
More support for the rapid formation of an outer disc was presented by Ciucă et al. 2020 who derived stellar ages from APOGEE using a machine learning approach. They highlighted, in agreement with VINTERGATAN, the simultaneous formation of low-and high- stars in the low- sequence approximately at the same time as the galaxy transitions from the high to low- sequence. The same feature was also found in earlier work by Feuillet et al. 2019, with the signature being especially prominent in the outer disc of the Milky Way (see their fig. 3). It is plausible that this signature originates from the very same mechanism identified in this work, which we explore in 142.
Finally, we re-emphasize that the formation scenario is a non-trivial prediction of our simulation; while broadly arising from gas infall in the early Universe, details of ages and metallicities for mono abundance populations across the galaxy depend on the merger history, angular momentum and mixing of infalling gas, previous enrichment history, interaction-triggered star formation etc. In addition, vertical heating and radial migration in the past 8 Gyr ‘filters’ the formation signal, allowing a mix of stellar populations with different formation histories to be observed in the Solar vicinity. As such, improved stellar ages, for a larger population of stars, will be important for the ability of future joint observational and theoretical work to constrain the formation history of the Milky Way galaxy. Surveys like those carried out with 4MOST will be instrumental in providing relevant data (Bensby et al. 2019; Chiappini et al. 2019, e.g.).
5 Conclusions
In this work, we have used a new high-resolution cosmological zoom simulation of a Milky Way-mass galaxy, VINTERGATAN, to understand the origins of chemical, kinematical and structural thick and thin stellar discs. We have demonstrated that VINTERGATAN conforms to a number of observed characteristics of the Milky Way (and disc galaxies of similar mass), including its size, gas fraction, stellar surface density profile, rotation curve and star formation history. This agreement motivates our detailed study of the formation and evolution of its internal structure, with a particular focus on the origins of distinct sequences in -, a dichotomy that is well established in the Milky Way. Our main conclusions can be summarized as follows:
- •
At a lookback time Gyr, mergers are frequent and the galaxy is compact, gas rich and turbulent. All stars formed up to this point belong to the high- sequence due to efficiently mixed and recycled core collapse supernova ejecta in the main progenitor and its merging constituents. Supernova type Ia enrichment leads to a gradual lowering of at increasingly high metallicities, with reached in the innermost part of the galaxy. The contributions from in situ and accreted material, and the roles played by mergers, are presented in 141.
- •
In connection with the last major merger ( ago), cosmological inflow of low metallicity gas along filaments and gas from stripped dwarf galaxies lead to a rapid () buildup of an extended () metal-poor outer gas disc around the inner compact () metal-rich galaxy. This event leads to low- stars forming simultaneously over a wide range of metallicities ( ), as observed in the Milky Way. These values overlap with those of the older high- sequence, leading to the formation of a chemically bimodal galaxy. In 142, we perform an in-depth analysis of how the outer gas disc forms, and the physical processes that trigger it to form stars.
- •
The outer star forming disc, formed ago, is initially misaligned with the inner one, allowing it to evolve independently over the of years it takes for gravitational torques to align them. Despite the non-trivial origins, the galaxy transitions into a Milky Way-like disc galaxy featuring, in broad strokes, an old, kinematically hot, high-, thick disc, as well as a young, kinematically cold, low- thin disc.
- •
The galaxy grows inside-out and evolves secularly in the last , with its stellar surface density profile well fitted by single or broken exponentials at all times. Close to the exponential scalelength matches the Milky Way’s (), with a size dichotomy for the ‘chemically defined’ thin and thick discs; the low- disc forms late () from high angular momentum material and has twice the scalelength () compared to the older high- disc (), in line with the Milky Way.
- •
Radial migration shapes the Solar neighbourhood (galactocentric radius ) metallicity distribution function. Coupled with inside-out galaxy growth, radial migration preferentially redistributes metal-rich ( ) stars from the inner galaxy to the outer. VINTERGATAN features a higher than observed fraction of high- stars in the Solar vicinity, possibly indicating a lesser role of radial migration in the Milky Way.
- •
The final galaxy’s disc scaleheight increases monotonically with the age of the stellar population. This ‘upside-down’ formation scenario (young stars residing in a thin disc), together with the fact that all mono-age stellar populations flare, explains a number of structural features also observed in the Milky Way. Two specific examples are the existence of 1) shallower, or even inverted, -profiles above the midplane, and 2) young low- stars residing in a structurally thick disc beyond the Solar radius.
- •
Stars are born kinematically cold, with vertical velocity dispersions . Velocity dispersions increase with age and decreasing galactocentric radius due to secular heating process such as gravitational scattering off clouds in the disc. Radial migration is not found to affect the age-velocity dispersion relation in the Solar neighbourhood, with stars not experiencing any migration being heated just as much as the general population. However, simulations with higher resolution are necessary to confirm this result.
- •
While a thin–thick disc dichotomy broadly is in place, velocity dispersions, scaleheights and average stellar ages of mono-abundance populations can relate to each other in complex manners depending on location in the - plane. For example, the most metal-poor stars ( ) in the low- sequence and old stars in the high- sequence both feature scaleheights .
The proposed formation scenario of chemically, kinematically and structurally distinct disc components hence leads to a galaxy with current day properties with much in common with the Milky Way. Central to this scenario is 1) the formation of an outer disc from cosmological accretion around the epoch of the last major merger (Kretschmer et al. 2020, see also) which allows for a chemical bimodality, and 2) secular evolution that shapes the internal structure and leads to many of the commonly observed thin vs. thick disc characteristics. How common such a chain of events are for Milky Way-mass disc galaxies will be explored in future work.
The forensic evidence necessary to unravel the formation scenario of the Milky Way will only improve in the near future, with a wealth of new data becoming available from upcoming large ground-based spectroscopic surveys, such as WEAVE (Dalton et al. 2012) and 4MOST (de Jong et al. 2019), together with forthcoming data releases from the astrometric satellite Gaia (Gaia Collaboration et al. 2016).
acknowledgments
OA thanks Romain Teyssier, Andrea Macciò and Tobias Buck for discussions. OA, FR, EA and MR acknowledge support from the Knut and Alice Wallenberg Foundation and the Royal Physiographic Society of Lund. OA, FR and EA acknowledge support from the Royal Physiographic Society of Lund. OA is supported by the grant 2014-5791 from the Swedish Research Council. TB is supported by the grant 2018-04857 from the Swedish Research Council. SF and DF are supported by the grant 2016-03412 from the Swedish Research Council. This work used the COSMA Data Centric system at Durham University, operated by the Institute for Computational Cosmology on behalf of the STFC DiRAC HPC Facility (www.dirac.ac.uk). This equipment was funded by a BIS National E-infrastructure capital grant ST/K00042X/1, DiRAC Operations grant ST/K003267/1 and Durham University. DiRAC is part of the National E-Infrastructure.
Data availability
The data underlying this article will be shared on reasonable request to the corresponding author.
References
- Abadi et al. (2003) Abadi M. G., Navarro J. F., Steinmetz M., Eke V. R., 2003, ApJ, 597, 21
- Adibekyan et al. (2013) Adibekyan V. Z., et al., 2013, A&A, 554, A44
- Agertz & Kravtsov (2015) Agertz O., Kravtsov A. V., 2015, ApJ, 804, 18
- Agertz & Kravtsov (2016) Agertz O., Kravtsov A. V., 2016, ApJ, 824, 79
- Agertz et al. (2009) Agertz O., Teyssier R., Moore B., 2009, MNRAS, 397, L64
- Agertz et al. (2011) Agertz O., Teyssier R., Moore B., 2011, MNRAS, 410, 1391
- Agertz et al. (2013) Agertz O., Kravtsov A. V., Leitner S. N., Gnedin N. Y., 2013, ApJ, 770, 25
- Agertz et al. (2020) Agertz O., et al., 2020, arXiv e-prints, p. arXiv:2006.06008
- Anders & Grevesse (1989) Anders E., Grevesse N., 1989, Geochimica Cosmochimica Acta, 53, 197
- Anders et al. (2014) Anders F., et al., 2014, A&A, 564, A115
- Anders et al. (2017) Anders F., et al., 2017, A&A, 600, A70
- Andersson et al. (2020) Andersson E. P., Agertz O., Renaud F., 2020, arXiv e-prints, p. arXiv:2003.12297
- Andrews et al. (2017) Andrews B. H., Weinberg D. H., Schönrich R., Johnson J. A., 2017, ApJ, 835, 224
- Asplund et al. (2009) Asplund M., Grevesse N., Sauval A. J., Scott P., 2009, ARA&A, 47, 481
- Aubert & Teyssier (2010) Aubert D., Teyssier R., 2010, ApJ, 724, 244
- Aumer et al. (2016) Aumer M., Binney J., Schönrich R., 2016, MNRAS, 462, 1697
- Aumer et al. (2017) Aumer M., Binney J., Schönrich R., 2017, MNRAS, 470, 3685
- Behroozi et al. (2013) Behroozi P. S., Wechsler R. H., Conroy C., 2013, ApJ, 770, 57
- Bensby et al. (2003) Bensby T., Feltzing S., Lundström I., 2003, A&A, 410, 527
- Bensby et al. (2011) Bensby T., Alves-Brito A., Oey M. S., Yong D., Meléndez J., 2011, ApJ, 735, L46
- Bensby et al. (2014) Bensby T., Feltzing S., Oey M. S., 2014, A&A, 562, A71
- Bensby et al. (2019) Bensby T., et al., 2019, The Messenger, 175, 35
- Bigiel et al. (2008) Bigiel F., Leroy A., Walter F., Brinks E., de Blok W. J. G., Madore B., Thornley M. D., 2008, AJ, 136, 2846
- Binney et al. (2009) Binney J., Nipoti C., Fraternali F., 2009, MNRAS, 397, 1804
- Bird et al. (2013) Bird J. C., Kazantzidis S., Weinberg D. H., Guedes J., Callegari S., Mayer L., Madau P., 2013, ApJ, 773, 43
- Bird et al. (2020) Bird J. C., Loebman S. R., Weinberg D. H., Brooks A., Quinn T. R., Christensen C. R., 2020, arXiv e-prints, p. arXiv:2005.12948
- Bland-Hawthorn & Gerhard (2016) Bland-Hawthorn J., Gerhard O., 2016, ARA&A, 54, 529
- Bland-Hawthorn et al. (2019) Bland-Hawthorn J., et al., 2019, MNRAS, 486, 1167
- Blondin et al. (1998) Blondin J. M., Wright E. B., Borkowski K. J., Reynolds S. P., 1998, ApJ, 500, 342
- Booth et al. (2013) Booth C. M., Agertz O., Kravtsov A. V., Gnedin N. Y., 2013, ApJ, 777, L16
- Bournaud & Elmegreen (2009) Bournaud F., Elmegreen B. G., 2009, ApJ, 694, L158
- Bovy et al. (2012a) Bovy J., Rix H.-W., Hogg D. W., 2012a, ApJ, 751, 131
- Bovy et al. (2012b) Bovy J., Rix H.-W., Liu C., Hogg D. W., Beers T. C., Lee Y. S., 2012b, ApJ, 753, 148
- Bovy et al. (2012c) Bovy J., Rix H.-W., Hogg D. W., Beers T. C., Lee Y. S., Zhang L., 2012c, ApJ, 755, 115
- Bovy et al. (2016) Bovy J., Rix H.-W., Schlafly E. F., Nidever D. L., Holtzman J. A., Shetrone M., Beers T. C., 2016, ApJ, 823, 30
- Brook et al. (2004) Brook C. B., Kawata D., Gibson B. K., Freeman K. C., 2004, ApJ, 612, 894
- Brook et al. (2012) Brook C. B., et al., 2012, MNRAS, 426, 690
- Bryan & Norman (1997) Bryan G. L., Norman M. L., 1997, in Clarke D. A., West M. J., eds, ASP Conf. Ser. 123: Computational Astrophysics; 12th Kingston Meeting on Theoretical Astrophysics. pp 363–+
- Buck (2020) Buck T., 2020, MNRAS, 491, 5435
- Buck et al. (2020) Buck T., Obreja A., Macciò A. V., Minchev I., Dutton A. A., Ostriker J. P., 2020, MNRAS, 491, 3461
- Carlin et al. (2018) Carlin J. L., Sheffield A. A., Cunha K., Smith V. V., 2018, ApJ, 859, L10
- Casagrande et al. (2011) Casagrande L., Schönrich R., Asplund M., Cassisi S., Ramírez I., Meléndez J., Bensby T., Feltzing S., 2011, A&A, 530, A138
- Catinella et al. (2010) Catinella B., et al., 2010, MNRAS, 403, 683
- Chabrier (2003) Chabrier G., 2003, PASP, 115, 763
- Cheng et al. (2012) Cheng J. Y., et al., 2012, ApJ, 752, 51
- Chiappini et al. (1997) Chiappini C., Matteucci F., Gratton R., 1997, ApJ, 477, 765
- Chiappini et al. (2019) Chiappini C., et al., 2019, The Messenger, 175, 30
- Cioffi et al. (1988) Cioffi D. F., McKee C. F., Bertschinger E., 1988, ApJ, 334, 252
- Ciucă et al. (2020) Ciucă I., Kawata D., Miglio A., Davies G. R., Grand R. J. J., 2020, arXiv e-prints, p. arXiv:2003.03316
- Clarke et al. (2019) Clarke A. J., et al., 2019, MNRAS, 484, 3476
- Courteau et al. (2007) Courteau S., Dutton A. A., van den Bosch F. C., MacArthur L. A., Dekel A., McIntosh D. H., Dale D. A., 2007, ApJ, 671, 203
- Courty & Alimi (2004) Courty S., Alimi J. M., 2004, A&A, 416, 875
- D’Souza & Bell (2018) D’Souza R., Bell E. F., 2018, Nature Astronomy, 2, 737
- Dalcanton & Bernstein (2002) Dalcanton J. J., Bernstein R. A., 2002, AJ, 124, 1328
- Dalton et al. (2012) Dalton G., et al., 2012, in Ground-based and Airborne Instrumentation for Astronomy IV. p. 84460P, doi:10.1117/12.925950
- Dekel et al. (2019) Dekel A., Ginzburg O., Jiang F., Freundlich J., Lapiner S., Ceverino D., Primack J., 2019, arXiv e-prints, p. arXiv:1912.08213
- Dorman et al. (2015) Dorman C. E., et al., 2015, ApJ, 803, 24
- Dutton et al. (2011) Dutton A. A., et al., 2011, MNRAS, 416, 322
- Edvardsson et al. (1993) Edvardsson B., Andersen J., Gustafsson B., Lambert D. L., Nissen P. E., Tomkin J., 1993, A&A, 500, 391
- El-Badry et al. (2018) El-Badry K., et al., 2018, MNRAS, 473, 1930
- Elmegreen & Struck (2013) Elmegreen B. G., Struck C., 2013, ApJ
- Fall & Efstathiou (1980) Fall S. M., Efstathiou G., 1980, MNRAS, 193, 189
- Fall & Romanowsky (2013) Fall S. M., Romanowsky A. J., 2013, ApJ, 769, L26
- Feltzing et al. (2003) Feltzing S., Bensby T., Lundström I., 2003, A&A, 397, L1
- Feltzing et al. (2020) Feltzing S., Bowers J. B., Agertz O., 2020, MNRAS, 493, 1419
- Ferrière (2001) Ferrière K. M., 2001, Reviews of Modern Physics, 73, 1031
- Feuillet et al. (2019) Feuillet D. K., Frankel N., Lind K., Frinchaboy P. M., García-Hernández D. A., Lane R. R., Nitschelm C., Roman-Lopes A. r., 2019, MNRAS, 489, 1742
- Flynn et al. (2006) Flynn C., Holmberg J., Portinari L., Fuchs B., Jahreiß H., 2006, MNRAS, 372, 1149
- Frankel et al. (2018) Frankel N., Rix H.-W., Ting Y.-S., Ness M., Hogg D. W., 2018, ApJ, 865, 96
- Freeman & Bland-Hawthorn (2002) Freeman K., Bland-Hawthorn J., 2002, Annual Review of Astronomy and Astrophysics, 40, 487
- Fuhrmann (1998) Fuhrmann K., 1998, A&A, 338, 161
- Gaia Collaboration et al. (2016) Gaia Collaboration et al., 2016, A&A, 595, A1
- Garrison-Kimmel et al. (2018) Garrison-Kimmel S., et al., 2018, MNRAS, 481, 4133
- Gibson et al. (2013) Gibson B. K., Pilkington K., Brook C. B., Stinson G. S., Bailin J., 2013, A&A, 554, A47
- Gilmore & Reid (1983) Gilmore G., Reid N., 1983, MNRAS, 202, 1025
- Grand et al. (2017) Grand R. J. J., et al., 2017, MNRAS, 467, 179
- Grand et al. (2018) Grand R. J. J., et al., 2018, MNRAS, 474, 3629
- Gutcke & Springel (2019) Gutcke T. A., Springel V., 2019, MNRAS, 482, 118
- Haardt & Madau (1996) Haardt F., Madau P., 1996, ApJ, 461, 20
- Hahn & Abel (2011) Hahn O., Abel T., 2011, MNRAS, 415, 2101
- Hayden et al. (2014) Hayden M. R., et al., 2014, AJ, 147, 116
- Hayden et al. (2015) Hayden M. R., et al., 2015, ApJ, 808, 132
- Hayden et al. (2019) Hayden M. R., et al., 2019, arXiv e-prints, p. arXiv:1901.07565
- Haywood et al. (2013) Haywood M., Di Matteo P., Lehnert M. D., Katz D., Gómez A., 2013, A&A, 560, A109
- Haywood et al. (2019) Haywood M., Snaith O., Lehnert M. D., Di Matteo P., Khoperskov S., 2019, A&A, 625, A105
- Hobbs et al. (2015) Hobbs A., Read J., Nicola A., 2015, MNRAS, 452, 3593
- Holmberg et al. (2009) Holmberg J., Nordström B., Andersen J., 2009, A&A, 501, 941
- Hopkins et al. (2014) Hopkins P. F., Kereš D., Oñorbe J., Faucher-Giguère C.-A., Quataert E., Murray N., Bullock J. S., 2014, MNRAS, 445, 581
- Hopkins et al. (2018) Hopkins P. F., et al., 2018, MNRAS, 480, 800
- House et al. (2011) House E. L., et al., 2011, MNRAS, 415, 2652
- Huang et al. (2020) Huang Y., et al., 2020, arXiv e-prints, p. arXiv:2006.02686
- Joung et al. (2012) Joung M. R., Bryan G. L., Putman M. E., 2012, ApJ, 745, 148
- Kazantzidis et al. (2009) Kazantzidis S., Zentner A. R., Kravtsov A. V., Bullock J. S., Debattista V. P., 2009, ApJ, 700, 1896
- Kim & Ostriker (2015) Kim C.-G., Ostriker E. C., 2015, ApJ, 802, 99
- Kim et al. (2014) Kim J.-h., Abel T., Agertz O. e. a., 2014, ApJS, 210, 14
- Kim et al. (2016) Kim J.-h., et al., 2016, ApJ, 833, 202
- Kravtsov et al. (2014) Kravtsov A., Vikhlinin A., Meshscheryakov A., 2014, ApJ submitted (arxiv/1401.7329),
- Kretschmer et al. (2020) Kretschmer M., Agertz O., Teyssier R., 2020, arXiv e-prints, p. arXiv:2003.03368
- Lacey (1984) Lacey C. G., 1984, MNRAS, 208, 687
- Lee et al. (2011) Lee Y. S., et al., 2011, ApJ, 738, 187
- Lee et al. (2016) Lee E. J., Miville-Deschênes M.-A., Murray N. W., 2016, ApJ, 833, 229
- Leitherer et al. (1999) Leitherer C., et al., 1999, ApJS, 123, 3
- Leitner & Kravtsov (2011) Leitner S. N., Kravtsov A. V., 2011, ApJ, 734, 48
- Leroy et al. (2008) Leroy A. K., Walter F., Brinks E., Bigiel F., de Blok W. J. G., Madore B., Thornley M. D., 2008, AJ, 136, 2782
- Loebman et al. (2011) Loebman S. R., Roškar R., Debattista V. P., Ivezić Ž., Quinn T. R., Wadsley J., 2011, ApJ, 737, 8
- Luck et al. (2011) Luck R. E., Andrievsky S. M., Kovtyukh V. V., Gieren W., Graczyk D., 2011, AJ, 142, 51
- Ma et al. (2017) Ma X., Hopkins P. F., Wetzel A. R., Kirby E. N., Anglés-Alcázar D., Faucher-Giguère C.-A., Kereš D., Quataert E., 2017, MNRAS, 467, 2430
- Mackereth et al. (2017) Mackereth J. T., et al., 2017, MNRAS, 471, 3057
- Mackereth et al. (2018) Mackereth J. T., Crain R. A., Schiavon R. P., Schaye J., Theuns T., Schaller M., 2018, MNRAS, 477, 5072
- Mackereth et al. (2019) Mackereth J. T., et al., 2019, MNRAS, 489, 176
- Maoz et al. (2014) Maoz D., Mannucci F., Nelemans G., 2014, ARA&A, 52, 107
- Marinacci et al. (2014) Marinacci F., Pakmor R., Springel V., Simpson C. M., 2014, MNRAS, 442, 3745
- Martig et al. (2014) Martig M., Minchev I., Flynn C., 2014, MNRAS, 443, 2452
- Martizzi et al. (2015) Martizzi D., Faucher-Giguère C.-A., Quataert E., 2015, MNRAS, 450, 504
- Matteucci (2001) Matteucci F., 2001, The chemical evolution of the Galaxy. Vol. 253, doi:10.1007/978-94-010-0967-6,
- Matteucci & Greggio (1986) Matteucci F., Greggio L., 1986, A&A, 154, 279
- McMillan (2011) McMillan P. J., 2011, MNRAS, 414, 2446
- Mikkola et al. (2020) Mikkola D., McMillan P. J., Hobbs D., 2020, arXiv e-prints, p. arXiv:2004.13646
- Minchev et al. (2012) Minchev I., Famaey B., Quillen A. C., Dehnen W., Martig M., Siebert A., 2012, A&A, 548, A127
- Minchev et al. (2013) Minchev I., Chiappini C., Martig M., 2013, A&A, 558, A9
- Minchev et al. (2014) Minchev I., Chiappini C., Martig M., 2014, A&A, 572, A92
- Minchev et al. (2015) Minchev I., Martig M., Streich D., Scannapieco C., de Jong R. S., Steinmetz M., 2015, ApJ, 804, L9
- Minchev et al. (2017) Minchev I., Steinmetz M., Chiappini C., Martig M., Anders F., Matijevic G., de Jong R. S., 2017, ApJ, 834, 27
- Minchev et al. (2018) Minchev I., et al., 2018, MNRAS, 481, 1645
- Miranda et al. (2016) Miranda M. S., et al., 2016, A&A, 587, A10
- Mo et al. (1998) Mo H. J., Mao S., White S. D. M., 1998, MNRAS, 295, 319
- Moster et al. (2010) Moster B. P., Somerville R. S., Maulbetsch C., van den Bosch F. C., Macciò A. V., Naab T., Oser L., 2010, ApJ, 710, 903
- Naab & Ostriker (2017) Naab T., Ostriker J. P., 2017, ARA&A, 55, 59
- Naiman et al. (2018) Naiman J. P., et al., 2018, MNRAS, 477, 1206
- Ohlin et al. (2019) Ohlin L., Renaud F., Agertz O., 2019, MNRAS, 485, 3887
- Padoan et al. (2012) Padoan P., Haugbølle T., Nordlund Å., 2012, ApJ, 759, L27
- Pato & Iocco (2017) Pato M., Iocco F., 2017, SoftwareX, 6, 54
- Peebles (1969) Peebles P. J. E., 1969, ApJ, 155, 393
- Philcox et al. (2018) Philcox O., Rybizki J., Gutcke T. A., 2018, ApJ, 861, 40
- Pichon et al. (2011) Pichon C., Pogosyan D., Kimm T., Slyz A., Devriendt J., Dubois Y., 2011, MNRAS, 418, 2493
- Pontzen et al. (2017) Pontzen A., Tremmel M., Roth N., Peiris H. V., Saintonge A., Volonteri M., Quinn T., Governato F., 2017, MNRAS, 465, 547
- Quinn et al. (1993) Quinn P. J., Hernquist L., Fullagar D. P., 1993, ApJ, 403, 74
- Raiteri et al. (1996) Raiteri C. M., Villata M., Navarro J. F., 1996, A&A, 315, 105
- Read et al. (2008) Read J. I., Lake G., Agertz O., Debattista V. P., 2008, MNRAS, 389, 1041
- Reddy et al. (2003) Reddy B. E., Tomkin J., Lambert D. L., Allende Prieto C., 2003, MNRAS, 340, 304
- Renaud et al. (2020a) Renaud F., Agertz O., Read J. I., Ryde N., Andersson E. P., Bensby T., Rey M. P., Feuillet D. K., 2020a, arXiv e-prints, p. arXiv:2006.06011
- Renaud et al. (2020b) Renaud F., Agertz O., Andersson E. P., Read J. I., Ryde N., Bensby T., Rey M. P., Feuillet D. K., 2020b, arXiv e-prints, p. arXiv:2006.06012
- Rey et al. (2019) Rey M. P., Pontzen A., Agertz O., Orkney M. D. A., Read J. I., Saintonge A., Pedersen C., 2019, ApJ, 886, L3
- Rey et al. (2020) Rey M. P., Pontzen A., Agertz O., Orkney M. D. A., Read J. I., Rosdahl J., 2020, arXiv e-prints, p. arXiv:2004.09530
- Rhodin et al. (2019) Rhodin N. H. P., Agertz O., Christensen L., Renaud F., Fynbo J. P. U., 2019, MNRAS, 488, 3634
- Rix & Bovy (2013) Rix H.-W., Bovy J., 2013, A&ARv, 21, 61
- Romeo (1994) Romeo A. B., 1994, A&A, 286, 799
- Romeo (1997) Romeo A. B., 1997, A&A, 324, 523
- Romeo et al. (2008) Romeo A. B., Agertz O., Moore B., Stadel J., 2008, ApJ, 686, 1
- Rosen & Bregman (1995) Rosen A., Bregman J. N., 1995, ApJ, 440, 634
- Roškar et al. (2008) Roškar R., Debattista V. P., Stinson G. S., Quinn T. R., Kaufmann T., Wadsley J., 2008, ApJ, 675, L65
- Ruchti et al. (2015) Ruchti G. R., et al., 2015, MNRAS, 450, 2874
- Sales et al. (2012) Sales L. V., Navarro J. F., Theuns T., Schaye J., White S. D. M., Frenk C. S., Crain R. A., Dalla Vecchia C., 2012, MNRAS, 423, 1544
- Sanderson et al. (2020) Sanderson R. E., et al., 2020, ApJS, 246, 6
- Schaye et al. (2015) Schaye J., et al., 2015, MNRAS, 446, 521
- Schönrich & Binney (2009) Schönrich R., Binney J., 2009, MNRAS, 399, 1145
- Seabroke & Gilmore (2007) Seabroke G. M., Gilmore G., 2007, MNRAS, 380, 1348
- Segers et al. (2016) Segers M. C., Schaye J., Bower R. G., Crain R. A., Schaller M., Theuns T., 2016, MNRAS, 461, L102
- Sellwood (2013) Sellwood J. A., 2013, ApJ, 769, L24
- Sellwood (2014) Sellwood J. A., 2014, Reviews of Modern Physics, 86, 1
- Sellwood & Binney (2002) Sellwood J. A., Binney J. J., 2002, MNRAS, 336, 785
- Skelton et al. (2014) Skelton R. E., et al., 2014, ApJS, 214, 24
- Solway et al. (2012) Solway M., Sellwood J. A., Schönrich R., 2012, MNRAS, 422, 1363
- Spitoni et al. (2019) Spitoni E., Verma K., Silva Aguirre V., Calura F., 2019, arXiv e-prints, p. arXiv:1912.04312
- Stinson et al. (2013) Stinson G. S., Brook C., Macciò A. V., Wadsley J., Quinn T. R., Couchman H. M. P., 2013, MNRAS, 428, 129
- Sutherland & Dopita (1993) Sutherland R. S., Dopita M. A., 1993, ApJS, 88, 253
- Teyssier (2002) Teyssier R., 2002, A&A, 385, 337
- Thornton et al. (1998) Thornton K., Gaudlitz M., Janka H.-T., Steinmetz M., 1998, ApJ, 500, 95
- Toro et al. (1994) Toro E. F., Spruce M., Speares W., 1994, Shock Waves, 4, 25
- Toth & Ostriker (1992) Toth G., Ostriker J. P., 1992, ApJ, 389, 5
- Übler et al. (2014) Übler H., Naab T., Oser L., Aumer M., Sales L. V., White S. D. M., 2014, MNRAS, 443, 2092
- Velazquez & White (1999) Velazquez H., White S. D. M., 1999, MNRAS, 304, 254
- Wang et al. (2020) Wang H. F., et al., 2020, MNRAS, 491, 2104
- Wetzel et al. (2016) Wetzel A. R., Hopkins P. F., Kim J.-h., Faucher-Giguere C.-A., Keres D., Quataert E., 2016, preprint, (arXiv:1602.05957)
- Wheeler et al. (2020) Wheeler A., et al., 2020, arXiv e-prints, p. arXiv:2001.08227
- Wielen (1977) Wielen R., 1977, A&A, 60, 263
- Wise et al. (2012) Wise J. H., Abel T., Turk M. J., Norman M. L., Smith B. D., 2012, MNRAS, 427, 311
- Woosley & Heger (2007) Woosley S. E., Heger A., 2007, Phys. Rep., 442, 269
- Yu & Liu (2018) Yu J., Liu C., 2018, MNRAS, 475, 1093
- de Jong et al. (2019) de Jong R. S., et al., 2019, The Messenger, 175, 3
- van Dokkum et al. (2013) van Dokkum P. G., et al., 2013, ApJ, 771, L35
Appendix A Evolution of the - plane

Fig. 18 shows the evolution of the - plane for stars residing at galactocentric radii and from the midplane at the indicated simulation times. The majority of stars in the high- sequence develops during the first of cosmic evolution (top row). At (top right panel), a dichotomy in has formed for , triggered by low metallicity gas accretion onto the then compact () metal-rich disc.
The formation of the outer, misaligned, metal-poor gas disc (see Section 3.3 and 142) is evident in the middle row of panels (), where stars can be seen to form in the low- sequence at low metallicities ( ). At , a gap exists between this metal-poor population and the rest of the low- sequence; a consequence of the ISM in the inner and outer discs’ being well separated spatially. Subsequent gas accretion and ISM mixing between the aligning inner and outer discs allow for a coherent low- sequence to develop at .
We note that this is a disc-wide analysis, meant to demonstrate how distinct sequences in - form. The current day detectability of stellar populations of different chemical abundances depends on location in the galaxy and how efficiently stars radially migrate, as demonstrated in the main text.