Pre-saturation phase in the frustrated ferro-antiferromagnet Pb2VO(PO4)2
Abstract
Magnetization, magnetic torque, neutron diffraction and NMR experiments are used to map out the phase diagram of the prototypical quasi-two-dimensional ferro-antiferromagnet Pb2VO(PO4)2 in magnetic fields up to 27 T. When the field is applied perpendicular to the axis of magnetic anisotropy, a new magnetic state emerges through a discontinuous transition and persists in a narrow field range just below saturation. The measured NMR spectra suggest a complex and possibly incommensurate magnetic order in that regime.
I Introduction
In Heisenberg antiferromagnets (AFMs) the standard paradigm for polarization by an external magnetic field is that of single-magnon Bose-Einstein condensation (BEC). Batyev and Braginski 1984 It can be argued that this essentially semi-classical picture breaks down in quantum spin systems with sufficiently strong competition between AFM and ferromagnetic (FM) interactions.Ueda and Momoi 2013 Just below the saturation field, conventional AF long-range order is replaced by some entirely different state with non-trivial symmetries and possibly a phase separation. Depending on the details of the spin Hamiltonian, a host of novel pre-saturation quantum phases may occur, including chiral order, spin density waves (SDW) and a variety of multipolar (spin-nematic) phases.Shannon et al. 2006; Hikihara et al. 2008; Sudan et al. 2009; Sato et al. 2013; Starykh and Balents 2014 Some of these novel phases have indeed been found in real ferro-antiferromagnetic materials.Svistov et al. 2011; Orlova et al. 2017; Willenberg et al. 2016; Pregelj et al. 2015; Bhartiya et al. 2019; Kohama et al. 2019
Non-trivial pre-saturation phases are mainly expected to occur when, due to frustration, the system is close to a FM-AFM transition in zero field.Ueda and Momoi 2013; Starykh and Balents 2014 The focus of the present study is the layered vanadyl phosphate Pb2VO(PO4)2. It was initially thought to be a good realization of the square lattice model with nearest neighbor (nn) FM and next nearest neighbor (nnn) AFM interactions.Kaul et al. 2004; Kaul 2005; Skoulatos et al. 2007; Skoulatos et al. 2009; Förster et al. 2013; Nath et al. 2009 In a recent inelastic scattering studyBettler et al. 2019 we have shown that while it indeed is very two-dimensional and has both FM and AFM exchange constants, the material is a poor approximation of a square lattice. The degree of frustration is smaller than initially thought, placing it far from a FM-AFM instability. Moreover, it appears rather “classical” in that the ordered moment in the colinear AF ground state is rather large for a quasi-two-dimensional compound. It is therefore rather surprising that Pb2VO(PO4)2 shows a highly non-trivial and probably incommensurate pre-saturation phase, the observation of which we report in the present paper, along with the mapping out of the entire phase diagram.

The crystal structure of Pb2VO(PO4)2 is shown in Fig. 1. The unit cell is monoclinic (P21/a) with lattice parameters , , and .Shpanchenko et al. 2006 The magnetism originates from the V4+ ions, which host a spin and form two-dimensional layers in the plane. The four equivalent V4+ sites in each unit cell are magnetically coupled by at least 5 inequivalent V-O-P-O-V superexchange pathways, as shown. The zero-field spin wave spectrum is adequately described by a Heisenberg hamiltonian with meV, meV, meV and meV.Bettler et al. 2019 In addition, there is a weak anisotropy with as the magnetic easy axis. In zero field, long range order sets in at K and corresponds to a collinear columnar-AF state (CAF), as indicated by arrows in Fig. 1 (a). For a magnetic field along the crystallographic direction, a conventional spin-flop transition occurs at T.Kaul 2005 The magnetic saturation field is about 21 T,Tsirlin et al. 2009 which makes measurements experimentally challenging. For the discussion below it is important to note the two inequivalent phosphorus sites, suitable for 31P NMR.Nath et al. 2009 The P1 site lies in the V4+ planes and is strongly coupled to their magnetism. In contrast, the coupling is much weaker for the interlayer P2 site.

.
II Experimental
The main aim of this study was to investigate the phase diagram of Pb2VO(PO4)2 in magnetic fields all the way to saturation. We used single crystal samples from the same batch as those used in Ref. Bettler et al. 2019. Several complementary measurement techniques were employed. At low fields, the phase boundary was determined by magnetization measurements using a Quantum Design vibrating sample magnetometer (VSM) PPMS option. The external field was applied parallel to the direction of a 43.6 mg sample. The data were collected while sweeping the temperature at constant fields. Fields up to 14 T and temperatures down to 2.5 K were explored.
Close to the saturation field, the phase boundaries were determined by means of capacitive torque magnetometry on a 0.4 mg sample. Two field geometries were explored, with the field applied very close to the and axes. The experiment was carried out at LNCMI-CNRS in Grenoble in a resistive magnet and with a dilution refrigerator equipped with an in-situ rotator.
Some of the most insightful data were obtained in NMR experiments. These were carried out using a 21.4 mg sample in two different setups. For high temperatures ( K) we employed a superconducting magnet with a regular 4He cryostat. Low temperature and high field data were collected using a resistive magnet and a dilution refrigerator. All measurements were carried out at LNCMI-CNRS in Grenoble. The field was in all cases applied along the crystalographic direction and the NMR coil was parallel to . The spectra were obtained by the Fourier transforms of the 31P ( MHz/T) spin echo signals. Nuclear spin-lattice relaxation times () were measured by saturation-recovery experiments.

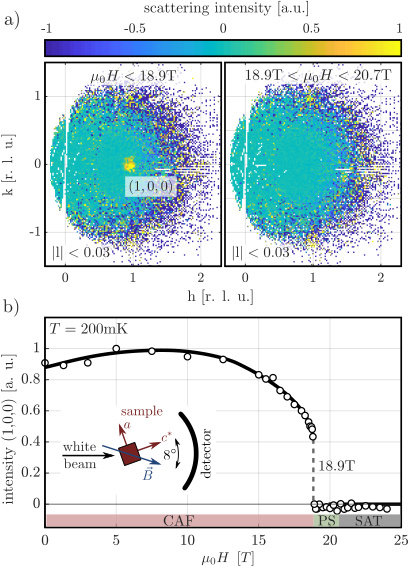
Additional ultra high field neutron diffraction experiments were carried out with a 23 mg sample on the EXED time-of-flight instrument at HZB, in a hybrid magnet providing dc fields up to 26 T.Prokhnenko et al. 2017 The experiment was performed at the base temperature of a dilution refrigerator ( mK). The severely restrictive magnet geometry did not allow for an in-situ sample rotation. In order to have the magnetic Bragg reflection in the narrow reciprocal space field of view of the instrument, we chose to apply the magnetic field at a fixed angle of 8∘ with respect to the direction. The scattering geometry is shown in the inset of Fig. 4 (a). The scattering intensity at each field value was measured with a counting time of roughly 60 min and was normalized to the spectral intensity of the incident white beam. To isolate out the magnetic contribution to scattering, the background was measured at K and zero magnetic field and subtracted from each data set.
III Experimental Results
III.0.1 Magnetization
Magnetization measured in Pb2VO(PO4)2 for is plotted as a function of temperature in Fig. 2 (a). Fig. 2 (b) shows typical temperature derivatives computed for and T. The phase transition is marked by inflection points in the curves. At low field, the ordering temperature increases with field. In that regime the transition appears as a sharp dip in [Fig. 2 (b)]. Above about 7 T the trend is reversed, and the transition corresponds to a maximum of the derivative. The thus obtained phase boundary is plotted in open squares and triangles in Fig. 6. These results complement previous low-field studies in the geometry.Kaul 2005
III.0.2 Magnetic torque

The phase boundary at high field was deduced from magnetic torque data. The entire data set collected for two orientations is shown in Fig. 3. Each line is vertically shifted for visibility and color-coded according to the temperature. The saturation field correspond to an inflection point in the measured torque curve (to an extremum in the derivative) and is about 20.7 T and 20.5 T for and respectively. The peak in the field derivative, marked with a cross, appears more pronounced in the geometry. One of the main observations in this study is the additional sharp peak-like feature at T for (asterisk). We ascribe it to the emergence of an additional narrow pre-saturation phase (PS). For the -geometry, the temperature dependence of both features is plotted in the phase diagram (Fig. 6). A false-color plot of the torque signal derivative is shown in the background.
III.0.3 Neutron diffraction
The Bragg peak is the only magnetic reflection of the CAF phase accessible in the very restrictive high-field setup. The scattered magnetic intensity measured at mK integrated over the range , and is plotted against field applied at 8∘ from in Fig. 4 (b). The magnetic reflection disappears at = 18.9 T in, what clearly appears to be, a discontinuous transition. Between and no other magnetic Bragg peaks could be located in the available data. This is borne out in Fig. 4 (a), where we compare the average of all magnetic scattering data collected for (0, 1.3, 3, 5, 7.5, 10, 12.5, 15, 15.5, 16, 16.5, 17, 17.5, 18, 18.25, 18.5, 18.6, 18.7, 18.75 and 18.8 T) and those for ( 18.9, 19, 19.1, 19.25, 19.5, 19.75, 20, 20.25 and 20.5 T). Clearly no new strong peaks are present in the narrow slice that these data sets correspond to. Even tough the background data set, measured at 5 K in zero field, was subtracted from all data sets, the nuclear positions (2,0,0),(+1,1,0) and (-1,1,0) seem to show some scattering intensity. This is however an artefact of the bad counting statistic at large momentum transfer and the strong scattering at these positions. The incident beam has only a weak intensity for neutrons with high enough momentum to reach these positions resulting in large noise which gets further amplified by the normalization to the white beam. This noise is cropped of by the color scale which is chosen to make the magnetic (1,0,0) peak visible.
III.0.4 NMR
Fig. 5 (a) shows the Fourier transform of the 31P NMR signal as a function of frequency shift (relative to the Larmor frequency, ) for various temperatures at a constant field of T. Each spectrum is normalized to its amplitude and vertically shifted according to its temperature. At high temperature two peaks are visible, corresponding to the two inequivalent phosphorous sites P1 and P2. The variation of their line-positions reflects the temperature dependence of the spin polarization. For the lower frequency line this variation is much stronger, so that this line is assigned to the P1 site that is closer and thus more strongly coupled to V4+ spins (Fig. 1 (b) and Ref. Nath et al. 2009). Both lines split at = 3.06 K reflecting the staggered moment, that is the order parameter (OP), in the CAF phase. The insert in Fig. 5 (a) shows that both split and unsplit NMR lines coexistent at the transition temperature, meaning that a phase mixture exists in a very narrow temperature range. Furthermore, the line-splitting (OP) does not grow from zero but appears discontinuously at the transition, confirming that the transition is a discontinuous one. Nevertheless, in Fig. 5 (c) we see that the NMR data, reflecting the low-energy spin dynamics/fluctuations, clearly display a sharp peak originating from the 3D critical fluctuations. This is characteristic of a second-order phase transition, as would be expected for a purely spin system. The transition is thus nearly second order (weakly first order), as predicted for a spin system that presents some magneto-elastic coupling. Dell’Amore et al. 2009; Wulf et al. 2015

To characterize the PS phase, Fig. 5 (b) shows the field dependence of the NMR spectra for the P1 site taken at mK in the field range 18.5 - 21.5 T. Each spectrum is normalized to its amplitude and offset vertically according to the field value. The two NMR lines that characterize the OP of the CAF order merge at T into a single broad structured peak. The latter persists, and gradually shrinks all the way to saturation at T. The spectrum measured close to is indicative of a phase separation, in line with our expectations for a discontinuous transition.
Additional information on the ordered phases is provided by the temperature dependence of NMR data, taken at T, 18.7/18.9 T and 20.0 T [Fig. 5 (c)]. The transition into the CAF phase presents a distinct cusp, reflecting critical spin fluctuations. In the ordered phases, the relaxation time follows a power law in a considerable temperature range. Deep in the CAF phase, the fitted exponent (14.8 T) = 7.1(3) is very large, which is typical of high-order relaxation processes Beeman and Pincus 1968 observed in BEC-type systems Mayaffre et al. 2000; Jeong et al. 2017. Close to , the exponent is about two times smaller (18.7 T) = 3.4(2), and very close to what is observed inside the PS phase (20.0 T) = 3.8(2). This indicates that the spin dynamics of the CAF phase close to and of the PS phase are most probably similar, although the two phases present quite different static order.
IV Discussion
The measurements described above allow us to reconstruct the magnetic phase diagram for Pb2VO(PO4)2. For the case of a magnetic field applied along the easy axis of magnetic anisotropy () it is as reported in Ref. Kaul 2005: A CAF phase with all spins along in low fieldBettler et al. 2019 followed by a CAF spin-flop phase all the way to the saturation. For this geometry, the only new result of the present study is a direct measurement of the saturation field T, as deduced from our torque data.
Our main new finding is that, for a magnetic field applied perpendicular to the anisotropy axis, there is a new pre-saturation phase evident in the torque, neutron diffraction as well as NMR data. The corresponding phase diagram for is shown in Fig. 6. From the neutron experiment, but also from the apparent presence of a mixed phase regime in NMR spectra, we conclude that the transition to the new phase is a discontinuous one. The critical field T observed in the torque and NMR experiments are consistent. The discrepancy to T obtained in the diffraction experiment is, most likely, due to the slightly different field orientation. As mentioned above, a discontinuous transition to non-trivial order can indeed be expected.Ueda and Momoi 2013 In the neutron data, we detect no sign of magnetic Bragg reflections between and , but that may easily be due to the extremely restricted experimentally accessible region of reciprocal space. It is unlikely that the new phase is a spin-nematic, since NMR clearly shows a splitting or broadening of the resonance line. In one way or another, dipolar order must be present. Furthermore, the structured shape of the NMR line hints at a complex and possibly incommensurate structure. As mentioned in the introduction, helimagnetic or SDW phases are the most likely candidates.
V Conclusion
The appearance of a non-trivial incommensurate pre-saturation phase in a frustrated quantum ferro-antiferromagnet is in itself not surprising. However, that this phenomenon occurs in a system with a rather weak degree of frustration such as Pb2VO(PO4)2 is quite remarkable.
VI ACKNOWLEDGMENTS
We acknowledge the support of the LNCMI-CNRS, member of the European Magnetic Field Laboratory (EMFL), and the Helmholtz Zentrum Berlin (HZB).
The authors thank the magnet and sample environment team of HZB for the secure and smooth operation of the high field instrument EXED, these are S.Kempfer, P. Heller, P. Smeibidl and S. Gerischer R. Wahle respectively.
Work at ETH was supported by the Swiss National Science Foundation, Division 2.
References
- Batyev and Braginski (1984) E. G. Batyev and L. S. Braginski, Sov. Phys. JETP 60, 781 (1984).
- Ueda and Momoi (2013) H. T. Ueda and T. Momoi, Phys. Rev. B 87, 144417 (2013).
- Shannon et al. (2006) N. Shannon, T. Momoi, and P. Sindzingre, Phys. Rev. Lett. 96, 027213 (2006).
- Hikihara et al. (2008) T. Hikihara, L. Kecke, T. Momoi, and A. Furusaki, Phys. Rev. B 78, 144404 (2008).
- Sudan et al. (2009) J. Sudan, A. Lüscher, and A. M. Läuchli, Phys. Rev. B 80, 140402(R) (2009).
- Sato et al. (2013) M. Sato, T. Hikihara, and T. Momoi, Phys. Rev. Lett. 110, 077206 (2013).
- Starykh and Balents (2014) O. A. Starykh and L. Balents, Phys. Rev. B 89, 104407 (2014).
- Svistov et al. (2011) L. E. Svistov, T. Fujita, H. Yamaguchi, S. Kimura, K. Omura, A. Prokofiev, A. I. Smirnov, Z. Honda, and M. Hagiwara, JETP Lett. 93, 21 (2011).
- Orlova et al. (2017) A. Orlova, E. L. Green, J. M. Law, D. I. Gorbunov, G. Chanda, S. Krämer, M. Horvatić, R. K. Kremer, J. Wosnitza, and G. L. J. A. Rikken, Phys. Rev. Lett. 118, 247201 (2017).
- Willenberg et al. (2016) B. Willenberg, M. Schäpers, A. U. B. Wolter, S.-L. Drechsler, M. Reehuis, J.-U. Hoffmann, B. Büchner, A. J. Studer, K. C. Rule, B. Ouladdiaf, S. Süllow, and S. Nishimoto, Phys. Rev. Lett. 116, 047202 (2016).
- Pregelj et al. (2015) M. Pregelj, A. Zorko, O. Zaharko, H. Nojiri, H. Berger, L. C. Chapon, and D. Arčon, Nat. Comm. 6, 7255 (2015).
- Bhartiya et al. (2019) V. K. Bhartiya, K. Y. Povarov, D. Blosser, S. Bettler, Z. Yan, S. Gvasaliya, S. Raymond, E. Ressouche, K. Beauvois, J. Xu, F. Yokaichiya, and A. Zheludev, Phys. Rev. Research 1, 033078 (2019).
- Kohama et al. (2019) Y. Kohama, H. Ishikawa, A. Matsuo, K. Kindo, N. Shannon, and Z. Hiroi, Proceedings of the National Academy of Sciences 116, 10686 (2019), https://www.pnas.org/content/116/22/10686.full.pdf .
- Kaul et al. (2004) E. Kaul, H. Rosner, N. Shannon, R. Shpanchenko, and C. Geibel, Journal of Magnetism and Magnetic Materials 272-276, 922 (2004), proceedings of the International Conference on Magnetism (ICM 2003).
- Kaul (2005) E. E. Kaul, Experimental Investigation of New Low-Dimensional Spin Systems in Vanadium Oxides, Ph.D. thesis, Technische Universität Dresden (2005).
- Skoulatos et al. (2007) M. Skoulatos, J. Goff, N. Shannon, E. Kaul, C. Geibel, A. Murani, M. Enderle, and A. Wildes, Journal of Magnetism and Magnetic Materials 310, 1257 (2007), proceedings of the 17th International Conference on Magnetism.
- Skoulatos et al. (2009) M. Skoulatos, J. P. Goff, C. Geibel, E. E. Kaul, R. Nath, N. Shannon, B. Schmidt, A. P. Murani, P. P. Deen, M. Enderle, and A. R. Wildes, EPL (Europhysics Letters) 88, 57005 (2009).
- Förster et al. (2013) T. Förster, F. A. Garcia, T. Gruner, E. E. Kaul, B. Schmidt, C. Geibel, and J. Sichelschmidt, Phys. Rev. B 87, 180401 (2013).
- Nath et al. (2009) R. Nath, Y. Furukawa, F. Borsa, E. E. Kaul, M. Baenitz, C. Geibel, and D. C. Johnston, Phys. Rev. B 80, 214430 (2009).
- Bettler et al. (2019) S. Bettler, F. Landolt, O. M. Aksoy, Z. Yan, S. Gvasaliya, Y. Qiu, E. Ressouche, K. Beauvois, S. Raymond, A. N. Ponomaryov, S. A. Zvyagin, and A. Zheludev, Phys. Rev. B 99, 184437 (2019).
- Shpanchenko et al. (2006) V. Shpanchenko, E. E. Kaul, C. Geibel, and E. V. Antipov, Acta Crystallog. C 62, 88 (2006).
- Tsirlin et al. (2009) A. A. Tsirlin, B. Schmidt, Y. Skourski, R. Nath, C. Geibel, and H. Rosner, Phys. Rev. B 80, 132407 (2009).
- Prokhnenko et al. (2017) O. Prokhnenko, P. Smeibidl, W.-D. Stein, M. Bartkowiak, and N. Stüsser, Journal of large-scale research facilities JLSRF 3 (2017), 10.17815/jlsrf-3-111.
- Dell’Amore et al. (2009) R. Dell’Amore, A. Schilling, and K. Krämer, Phys. Rev. B 79, 014438 (2009).
- Wulf et al. (2015) E. Wulf, D. Hüvonen, R. Schönemann, H. Kühne, T. Herrmannsdörfer, I. Glavatskyy, S. Gerischer, K. Kiefer, S. Gvasaliya, and A. Zheludev, Phys. Rev. B 91, 014406 (2015).
- Beeman and Pincus (1968) D. Beeman and P. Pincus, Phys. Rev. 166, 359 (1968).
- Mayaffre et al. (2000) H. Mayaffre, M. Horvatić, C. Berthier, M.-H. Julien, P. Ségransan, L. Lévy, and O. Piovesana, Phys. Rev. Lett. 85, 4795 (2000).
- Jeong et al. (2017) M. Jeong, H. Mayaffre, C. Berthier, D. Schmidiger, A. Zheludev, and M. Horvatić, Phys. Rev. Lett. 118, 167206 (2017).