CERN-EP-2020-103 \ShineJournalEPJ C \ShineTitleTwo-particle correlations in azimuthal angle and pseudorapidity in central 7Be+9Be collisions at the CERN Super Proton Synchrotron \ShineAbstractA measurement of charged hadron pair correlations in two-dimensional space is presented. The analysis is based on total 30 million central Be+Be collisions observed in the \NASixtyOnedetector at the CERN SPS for incident beam momenta of 19, 30, 40, 75, and 150 \GeVc. Measurements were carried out for unlike-sign and like-sign charge hadron pairs independently. The correlation functions were compared with results from a similar analysis on p+p interactions at similar beam momenta per nucleon. General trends of the back-to-back correlations are similar in central Be+Be collisions and p+p interactions, but are suppressed in magnitude due to the increased combinatorial background. Predictions from the \Eposand UrQMD models are compared to the measurements. Evolution of an enhancement around with incident energy is observed in central Be+Be collisions. It is not predicted by both models and almost non-existing in proton-proton collisions at the same momentum per nucleon.
1 Introduction and motivation
This paper presents experimental results on two-particle correlations in pseudorapidity and azimuthal angle of charged particles produced in central Be+Be collisions at 19, 30, 40, 75, and 150. The measurements were performed by the multi-purpose \NASixtyOne [1] experiment at the CERN Super Proton Synchrotron (SPS). They are part of the strong interactions programme devoted to the study of the properties of the onset of deconfinement and search for the critical point of strongly interacting matter. Within this program a two-dimensional scan in collision energy and size of colliding nuclei recorded data on p+p, Be+Be, Ar+Sc, Xe+La, and Pb+Pb collisions and was completed in 2018. The expected signal of a critical point is a non-monotonic dependence of various fluctuation measures in such a scan; for a recent review see Ref. [2].
Apart from looking for critical point (CP) and quark-gluon plasma (QGP) signatures, it is of interest to study specific physical phenomena that happen during and after the collision. The two-particle correlation analysis in pseudorapidity () and azimuthal angle () allows to disentangle different correlation sources which may be directly connected with phenomena like jets, collective flow, resonance decays, quantum statistics effects, conservation laws, etc.
Measurements of two-particle correlations in pseudorapidity and azimuthal angle were first published by the ACM collaboration at the Intersecting Storage Rings (ISR) [3]. Two- and three-body decays of resonances (, , ) were found to provide the dominant contributions. Two structures were observed: an enhancement near (away-side) explained by the two-body decay scenario and another enhancement at together with an azimuthal ridge (centered at ) consistent with three-body decays.11 1 and definitions are in Eq. 1. These features were confirmed at the higher collision energies of Relativistic Heavy Ion Collider (RHIC) by the PHOBOS [4] collaboration.
At RHIC and the Large Hadron Collider (LHC) parton scattering processes become important. In addition to high transverse momentum jets, studies of correlations in p+p interactions as well as in collisions of heavy nuclei [5, 6, 7, 8] found prominent structures explained as arising from the production of minijets, creating a large correlation peak at small opening angles and a broad structure along at (also referred to as away-side ridge).
A study of two-particle correlations was already performed by \NASixtyOnein inelastic p+p interactions at SPS energies and reported in Ref. [9]. The results show structures connected most probably to resonance decays, momentum conservation, and Bose-Einstein correlations. No clear sign of jet-like structure was observed (a more detailed search for jet-like structures was performed in Ref. [10]).
This paper reports \NASixtyOneresults from the next step in size of the collision system of two-particle correlations in and for the 5% most central 7Be+9Be collisions. The data were recorded in 2011, 2012 and 2013 using a secondary 7Be beam produced by fragmentation of the primary Pb beam from the CERN SPS [11]. The 7Be+9Be collisions play a special role in the \NASixtyOnescan programme. The collision system composed of a 7Be and a 9Be nucleus has eight protons and eight neutrons, and thus is isospin symmetric. Within the \NASixtyOnescan programme the 7Be+9Be collisions serve as the lowest mass isospin symmetric reference needed to study collisions of medium and large mass nuclei. This is of particular importance when data on proton-proton, neutron-proton and neutron-neutron are not available to construct the nucleon-nucleon reference [12]. Finally, the latest RHIC and LHC results suggest that collective effects may also be developed in small (p+Pb, d+Au) or high-multiplicity p+p systems (Refs. [13, 14, 15]).
Study of energy evolution of the near-side correlation in Be+Be is also of interest from the point of view of possible formation and decays of small QGP hot-spots (Refs. [16, 17, 18]) because the products of the first stage of the interaction will undergo less scattering in surrounding matter than in the case of heavy nucleus-nucleus reactions.
In this paper the pseudorapidity variable is calculated as , where with the transverse () and the longitudinal () component of the particle momentum in the collision centre-of-mass system. The pion mass was assumed for all particles in the Lorentz transformation of measured in the laboratory system to the centre-of-mass system. The azimuthal angle is the angle between the transverse momentum vector and the horizontal () axis.
2 Two-particle correlations in pseudorapidity and azimuthal angle
Correlations studied in this paper were calculated as a function of the difference in pseudorapidity () and azimuthal angle () between two particles produced in the same event:
| (1) |
The correlation function is defined and calculated as:
| (2) |
where
are the distributions of particle pairs from the same (data) and from different (mixed) events, respectively. Distributions and were obtained by accumulating the number of pairs in intervals of and . For the calculation of both distributions were normalised to the number of pairs (, ) in the given distribution.
The uncorrelated background was constructed by mixing particles from different data events with two main constraints: (a) the multiplicity distribution of mixed events had to be exactly the same as the original data event; (b) mixed events could not contain two particles from the same data event. The same method of mixing events was used in Ref. [9].
As stated in Eq. 1, the and values will get only positive values. Hence, the measurements were restricted to and . However, in order to better show the correlation structure, the results were mirrored along and, assuming the periodicity in the range of , also along and . Then, the distributions were shifted to the range . These modifications were done to better demonstrate the most interesting correlation structures as well as to make them easily comparable with results obtained by other experiments (e.g. from Refs. [19, 20]).
In this paper, the correlation function was obtained for charged hadrons produced in strong and electromagnetic processes in Be+Be interactions within the \NASixtyOneacceptance. The acceptance maps are available in Ref. [21].
3 Experimental setup
This section gives a brief description of the experimental setup used for recording Be+Be collisions.
3.1 Detector
The \NASixtyOneexperiment is a multi-purpose facility designed to measure particle production in nucleus-nucleus, hadron-nucleus and proton-proton interactions [1]. The detector is situated at the CERN Super Proton Synchrotron (SPS) in the H2 beamline of the North experimental area. A schematic diagram of the setup is shown in Fig. 1.
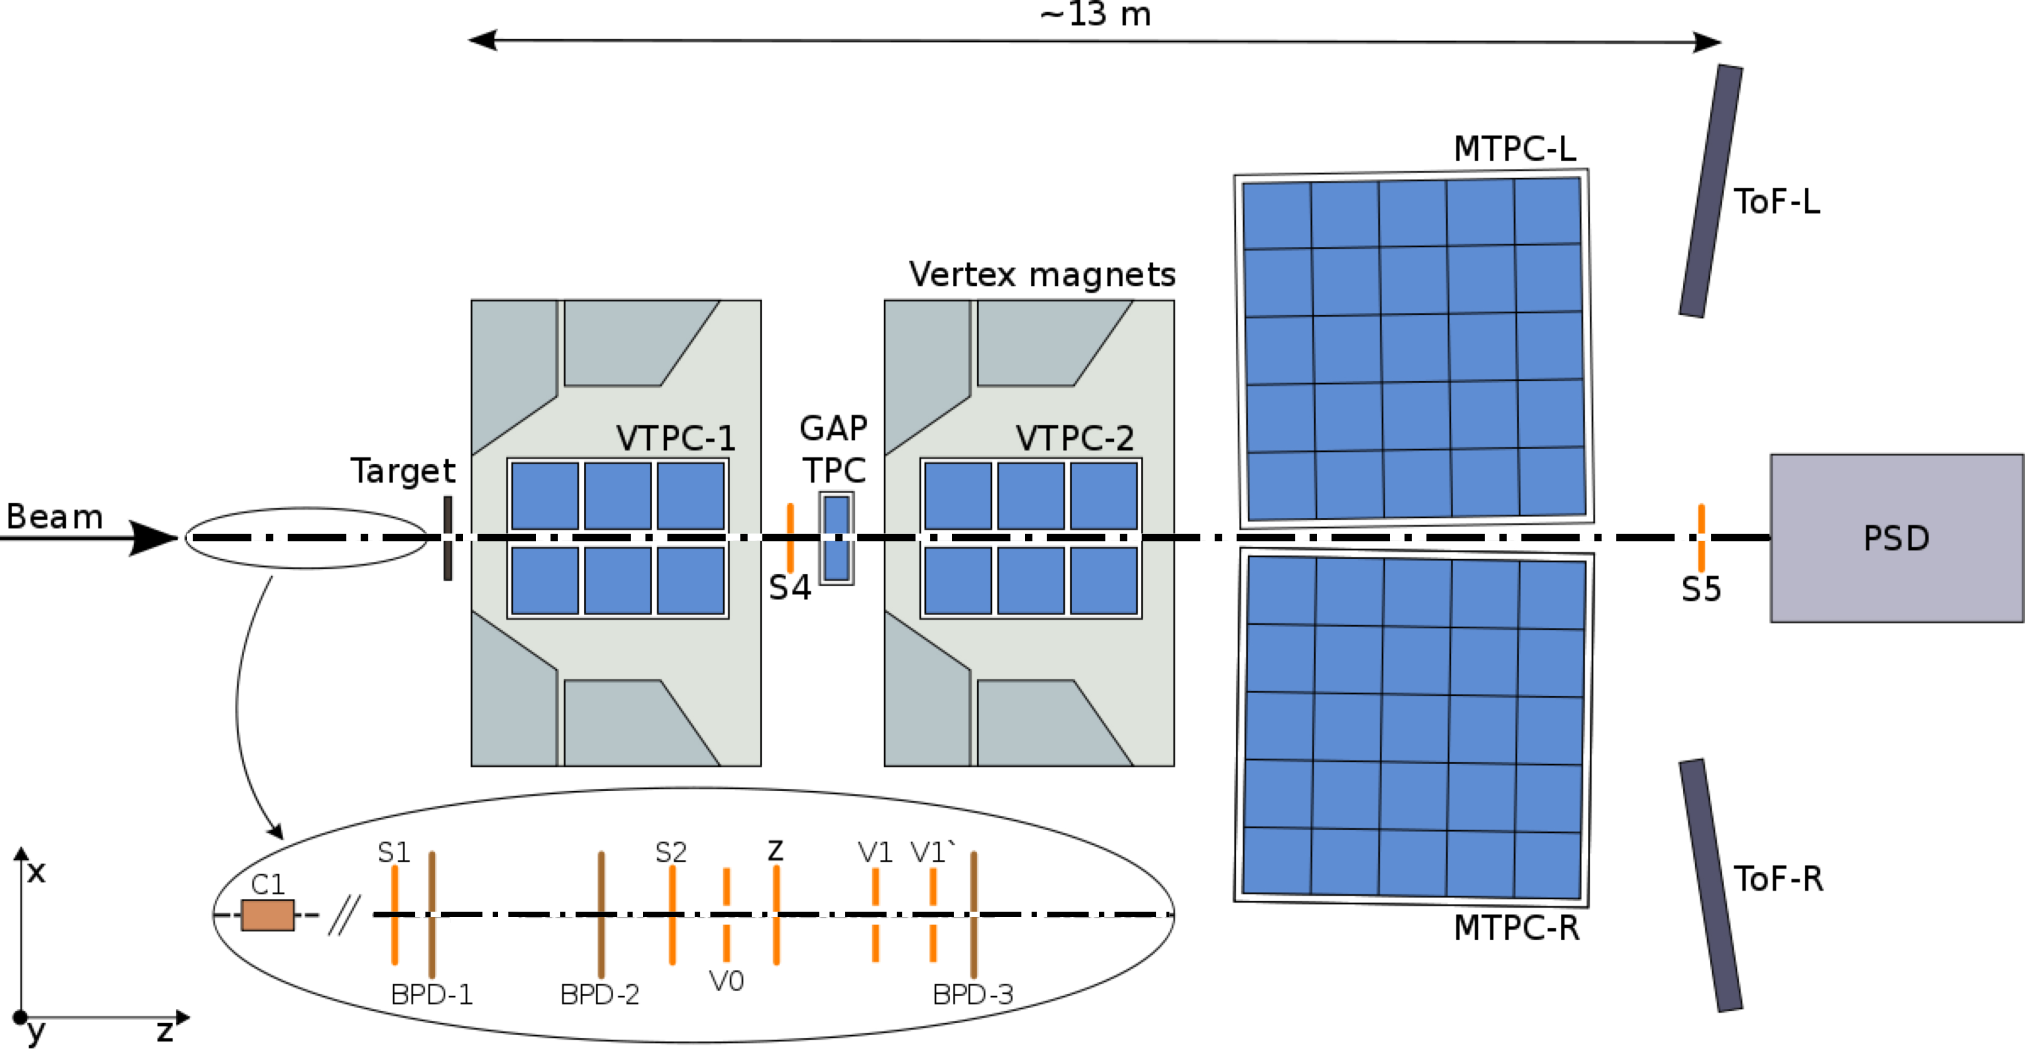
The main components of the produced particle detection system are four large volume Time Projection Chambers (TPC). Two of them, called Vertex TPCs (VTPC), are located downstream of the target inside superconducting magnets with maximum combined bending power of 9 Tm. The magnetic field was scaled down in proportion to the beam momentum in order to obtain similar phase space acceptance at all energies. The main TPCs (MTPC) and two walls of pixel Time-of-Flight (ToF-L/R) detectors are placed symmetrically to the beamline downstream of the magnets. The fifth small TPC (GAP TPC) is located between VTPC-1 and VTPC-2 directly on the beam line. The TPCs are filled with Ar:CO2 gas mixtures in proportions 90:10 for the VTPCs and the GAP-TPC, and 95:5 for the MTPCs.
The Projectile Spectator Detector (PSD), which measures mainly the energy of projectile spectators, is positioned 20.5 m (16.7 m) downstream of the target and behind the MTPCs at 75 and 150 (19, 30, 40), centered in the transverse plane on the deflected position of the beam. The PSD allows to select the centrality (violence) of the collision by imposing an upper limit on the measured spectator energy. For more details see Secs. 3.5 and 3.6.
The beamline instrumentation is schematically depicted in Fig. 2. A set of scintillation counters as well as Beam Position Detectors (BPDs) upstream of the spectrometer provide timing reference, selection, identification and precise measurement of the position and direction of individual beam particles.

3.2 9Be Target
The target was a plate of 9Be of 12 mm thickness placed 75 cm upstream of front face of VTPC-1. Mass concentrations of impurities were measured at 0.3% resulting in an estimated increase of the produced pion multiplicity by less than 0.5% due the small admixture of heavier elements [22]. No correction was applied for this negligible contamination. Data were taken with target inserted (90% of all recorded events) and target removed (10% of all recorded events).
3.3 7Be Beam
The beamline of \NASixtyOneis designed for obtaining high beam purity even with secondary ion beams. The beam instrumentation (see Fig. 2) consists of scintillator counters (S) used for triggering and beam particle identification, veto scintillation counters (V) with a hole in the middle for rejection of upstream interactions and beam halo particles, and a Cherenkov charge detector Z. Three Beam Position Detectors are used for determination of the charge of individual beam particles.
This paragraph provides a brief description of the 7Be beam properties (see Ref. [11]). Primary Pb82+ ions extracted from the SPS were steered toward a 180 cm long beryllium fragmentation target placed 535 m upstream of the \NASixtyOneexperiment. The result is a mixture of nuclear fragments consisting of nucleons not participating in inelastic collisions (spectators) with momentum per nucleon equal to the beam momentum per nucleon smeared by the Fermi motion momentum. The spectrometers of the beamline allow to select beam particles based on the particle rigidity: , where can be adjusted by setting the current on the dipole magnets of the spectrometer and is the momentum and the charge of the beam particle. Thus, the spectrometers select particles with the desired ratio. The charge spectrum measured by the Cherenkov Z detector for rigidity corresponding to 7Be is shown in Fig. 3.

A well separated peak for charge is visible and high purity 7Be ions can be selected by a cut on the measured charge as indicated by the red shading in Fig. 3. At test beam of momentum of 13.9 it was also possible to measure the time-of-flight of the beam particles. As demonstrated in Fig. 4 the selected fragments are high purity 7Be.

3.4 Trigger
The schematic of the placement of the beam and trigger detectors is shown in Fig. 2. The trigger setup consists of a set of scintillation counters recording the presence of the beam particle (S1, S2), a set of veto scintillation counters with a hole used to reject beam particles passing far from the centre of the beamline (V0, V1), and a charge detector (Z). Beam particles were defined by the coincidence T1 = and T1 = for low and high momentum data taking respectively. For the low beam momenta an interaction trigger detector (S4) was used to check whether the beam particle changed charge after passing through the target. In addition, central collisions were selected by requiring an energy signal below a set threshold from the 16 central modules of the PSD (see Sec. 3.5 for details). The event trigger condition thus was T2 = T1 for 19 and 30 and T2 = T1 for 40, 75 and 150. The PSD threshold was set to retain from 70% to 40% of inelastic collisions at beam momenta of 19 and 150, respectively.
3.5 The Projectile Spectator Detector
The centrality measurement for the events used in this report is based on information from the Projectile Spectator Detector (PSD), which is a modular compensating zero-degree calorimeter. Thanks to its modularity, there is only small dependence of the measured energy on the position of the particle and there is the possibility to determine centrality based on the energy measured by a subset of modules.
The Projectile Spectator Detector used for this data taking consisted of 44 modules: 16 small (10x10 cm) modules in the central region of the detector and 28 large (20x20 cm) modules placed around the small modules. Each PSD module consisted of 60 pairs of alternating plates of lead and scintillator (Fig. 5, left). The signals from the scintillators of each module were read by 10 Silicon Photomultipliers (SiPMs). Each SiPM was connected through Wavelength Shifting (WLS) fibres to six consecutive scintillator plates in order to allow longitudinal calibration of the detector as well as the characterization of the longitudinal particle shower development.


The event trigger placed a cut on the summed signals of the 16 small central modules. In the offline analysis a subset of events was selected for which the summed energy from a larger group of modules (see Fig. 5 right) was required to lie below a threshold value in order to select the 5% most central collisions. The module choice was based on the existence of an anti-correlation between the recorded energy and the charged particle multiplicity reconstructed in the TPCs (a description of this method as well as an acceptance map for the region of the PSD used for centrality selection can be found in Ref. [23]). Moreover, the availability of these modules was required at all beam momenta.
3.6 Centrality determination
The determination of centrality (violence) in \NASixtyOneis based on the measurement of the energy deposited in the PSD by spectators (the most central collisions correspond to a low number of spectators and therefore a low energy deposit in the PSD). Only the central 16 modules are included in the trigger. For offline analysis the energy recorded by a larger group of modules is summed (see Fig. 5).
4 Data processing, simulation and detector performance
Detector parameters were optimised by a data-based calibration procedure which also took into account their time dependence. Small adjustments were determined in consecutive steps for:
- (i)
detector geometry, TPC drift velocities and distortions due to the magnetic field inhomogeneities in the corners of the VTPCs,
- (ii)
magnetic field setting,
- (iii)
specific energy loss measurements.
Each step involved the reconstruction of data required to optimise a given set of calibration constants and time dependent corrections followed by verification procedures. Details of the procedure and quality assessment are presented in Ref. [24]. The resulting performance relative to the measurements of quantities relevant for this paper is discussed below.
The main steps of the data reconstruction procedure consists of: cluster finding in the TPC raw data, reconstruction of local track segments in each TPC separately, matching of local track segments and merging them into global tracks, track fitting based on a magnetic field map and determination of track parameters, determination of the interaction vertex using the beam information and the trajectories of tracks reconstructed in the TPCs, refitting of the particle trajectory using the interaction vertex as an additional point and determining the particle momentum vector at the interaction vertex.
A simulation of the \NASixtyOnedetector response is used to correct the reconstructed data. For this purpose Be+Be collisions generated with the \Epos1.99 [25, 26] model were used to obtain the corrections for contamination by weak decays of strange particles, and reconstruction inefficiency of the \NASixtyOnedetector.
The simulation consists of generating Be+Be collisions, propagating outgoing particles through the detector material using the GEANT 3.21 package [27], simulating the detector response using dedicated \NASixtyOnepackages, simulating the interaction trigger selection, reconstructing the simulated events in the same way as the real data and matching reconstructed and simulated tracks based on the cluster positions (see Ref. [28] for more details).
5 Data selection and analysis
This section describes the procedure used for the analysis. It consists of the following steps: application of event and particle selections, obtaining uncorrected experimental results and evaluation of correction factors based on simulations, and finally calculation of statistical uncertainties and estimation of systematic uncertainties.
5.1 Event selection criteria
Due to the very small fraction of out-of-target interactions (less than one per mille) only interactions with target inserted were analysed, while target removed ones were not taken into account. The events selected for the analysis reported in this paper had to satisfy the following conditions:
- (i)
event was selected by the central interaction trigger22 2 Central interaction trigger accepted approximately 40-50% minimum-bias events. and was produced by a good quality33 3 Good quality of the beam was assured by: ensuring that beam was composed purely from beryllium ions, rejection of off-time interactions in the target, proper positioning of beam along BPDs. beam (Interactions).
- (ii)
event has a well-fitted main interaction vertex (Good vertex),
- (iii)
the maximal distance between the main vertex position and the centre of the beryllium target is 2.5 cm (Vertex pos.),
- (iv)
only the 5% most central collisions (based on PSD spectator energy measurement) are accepted (Centrality 5%).
Table 1 presents the number of events analysed for Be+Be reactions at five beam momenta.
| Interactions | Good vertex | Vertex pos. | Centrality 5% | |
|---|---|---|---|---|
| 19 | 565136 | 497624 (88%) | 425346 (75%) | 29531 (5%) |
| 30 | 647662 | 592741 (92%) | 513857 (79%) | 38550 (6%) |
| 40 | 1833013 | 881618 (48%) | 776899 (42%) | 109512 (6%) |
| 75 | 2030413 | 927225 (46%) | 822710 (41%) | 92741 (5%) |
| 150 | 1644127 | 833934 (51%) | 732824 (45%) | 81525 (5%) |
5.2 Track selection criteria and acceptance
The tracks selected for the analysis had to satisfy the following conditions:
- (i)
the track fit of this charged particle converged (Good track),
- (ii)
the total number of reconstructed points on the track should be at least 30 and, at the same time, the sum of the number of reconstructed points in VTPC-1 and VTPC-2 should be at least 15 or the number of reconstructed points in the GAP TPC should be at least five (TPC nPoints),
- (iii)
the ratio of total number of reconstructed points (np) on the track to the potential number of points (nmp) should be between 0.5 and 1.244 4 Due to uncertainty of the momentum fitting and the fitted interaction point, the np/nmp ratio values may exceed 1. Hence, the upper limit for the ratio was established as 1.2. (np/nmp).
- (iv)
the distance between the track extrapolated to the interaction plane and the interaction point (impact parameter) should be smaller or equal to 4 cm in the horizontal (bending – ) plane and 2 cm in the vertical (drift – ) plane55 5 Track impact point resolution depends on track multiplicity in the event as well as the method of vertex determination. Typically, it is at the level of 2 cm in and 1 cm in plane. ( & ),
- (v)
tracks with and total momentum values characteristic for electrons are rejected66 6 See Ref. [29] for the details of this cut. (No e-/e+).
Numbers of tracks after consecutive selection cuts are presented in Table 2.
| Good track | TPC nPoints | np/nmp | & | No e-/e+ | |
|---|---|---|---|---|---|
| 19 | 358504 | 257617 (72%) | 234868 (66%) | 227529 (63%) | 215949 (60%) |
| 30 | 605627 | 443356 (73%) | 407537 (67%) | 393572 (65%) | 375621 (62%) |
| 40 | 2009333 | 1499813 (75%) | 1388029 (69%) | 1338798 (67%) | 1282954 (64%) |
| 75 | 2413377 | 1823376 (76%) | 1696029 (70%) | 1640207 (68%) | 1585880 (66%) |
| 150 | 2943518 | 2185182 (74%) | 2023686 (69%) | 1962862 (67%) | 1916593 (65%) |
Model simulations were performed in acceptance, thus the \NASixtyOnedetector acceptance filter needed to be applied before comparisons with data. The detector acceptance was defined as a three-dimensional matrix (,,) filled with 1 or 0 depending on whether the bin was or was not populated by particles reconstructed and accepted in the events (see Ref. [21]).
For reconstructed tracks from simulation, the cut rejecting electrons and positrons was implemented differently. Due to the lack of information on simulated specific energy loss for reconstructed simulated tracks, a procedure called "matching" was introduced. It connects the currently examined reconstructed to the best matched simulated track candidate by comparing properties of simulated tracks before reconstruction with the properties of the simulated track after reconstruction. The selection of the best candidate is performed in two steps:
- 1.
Pre-select the candidates that have a minimum value for the matching ratio , where is a number of points common for both simulated and reconstructed track and is number of points for the simulated track. The matching of points between simulated and reconstructed tracks is based on the respective positions of the points,
- 2.
From the preselected candidates, choose the one with the highest value.
During the process of the analysis it was found that the minimal matching ratio value has an impact on the magnitude of the correlation in the region near . An analysis based on loss of accepted tracks versus increasing matching ratio value resulted in the choice of the optimal ratio of . The variation related to the choice of the minimal ratio was included in the systematic uncertainty (see Sec. 5.5).
5.3 Corrections
In order to correct the results for biases due to off-line event and track selection, detection efficiency, contribution of weak decays and secondary interaction products, an identical procedure was applied to the simulated data. The \Epos1.99 model was used for event generation as it was done for inelastic p+p interactions [9]. Correction factors were calculated bin-by-bin as the ratio of the correlation functions for simulated events (“pure”) and for the same events after processing through Geant 3.21 [27] detector simulation and reconstruction (“rec”), filtered using the same event and track selection cuts as for the data. The correlation function is derived from differences of extensive quantities of the two particles and is therefore not expected to be sensitive to the details of the centrality selection. Thus a special correction is not required.
5.4 Statistical uncertainties
Statistical uncertainties of the correlation function are calculated in every bin using the following formula:
| (3) |
where is the uncorrected correlation function obtained following Eq. 2 and is the correction factor (described in Sec. 5.3). Detailed evaluation of this formula is described in Sec. 4.3.1 in Ref. [10].
In general, statistical uncertainties do not exceed 5%. The highest uncertainties are for regions with lower statistics, i.e. for and for positively and negatively charged pairs of particles and lower beam momenta. Below statistical uncertainties are within 3% for beam momenta 19, and 30 and within 1.5% for 40, 75 and 150.
5.5 Estimation of systematic uncertainties
In order to estimate systematic uncertainties, the data were analysed with loose and tight event and track selection cuts. By modifying cuts, one changes the magnitude of the corrections due to various biasing effects. If the simulation perfectly reproduces the data, corrected results should be independent of the cuts. A dependence on the selection criteria is due to imperfections of the simulation and is used as an estimate of the systematic uncertainty. For example, systematic uncertainty caused by weakly decaying particles is estimated by varying and cuts. The standard set of cut values, presented in Secs. 5.1 and 5.2 together with values of loose and tight cuts are tabulated in Table 3.
| Event cuts | |||
|---|---|---|---|
| Loose | Standard | Tight | |
| Interactions | applied | ||
| Good vertex | applied | ||
| Vertex pos. | cm | cm | cm |
| Centrality 5% | applied | ||
| Track cuts | |||
| Good track | applied | ||
| Total TPC points | |||
| VTPC (GAP TPC) points | |||
| np/nmp | |||
| cm | cm | cm | |
| cm | cm | cm | |
| cut | applied | ||
| Matching ratio (MC only) | |||
Results for both sets of cuts were subtracted bin-by-bin (). Since the differences in all bins follow Gaussian distributions with mean close to 0, the systematic uncertainties were taken to be approximately equal to the standard deviation of the distribution. This procedure was performed for all charge combinations (all charge, unlike-sign, positively and negatively charge pairs) and for all beam momenta. Mean systematic uncertainties were calculated for two sub-regions of . For mean systematic uncertainties are at the level 0.5% for all charge combinations and beam momenta. For the region of the mean systematic uncertainties are higher and are up to 2% for negatively charged pairs of particles at 19. Statistical uncertainties were not taken into account during this analysis.
6 Results and discussion
This section presents the final two-particle correlation results together with their possible explanations.
6.1 Two-particle correlation function
The corrected correlation functions for all charge pair combinations (all charge pairs, unlike-sign pairs, positively and negatively charge pairs) are presented in Figs. 6, 7, 8 and 9, respectively. Their values span the range between 0.9 and 1.1. Vanishing two-particle correlations would result in .


Two-particle correlations in Be+Be collisions show the following features:
- (i)
A maximum at emerging most probably due to resonance decays and momentum conservation. The maximum is most prominent for lower beam momenta and decreases with increasing beam momentum down to almost for 150 for like-sign pairs. For unlike-sign pairs the maximum depends weakly on beam momentum. Comparing positive and negative charge pairs one can notice that in positive pairs the maximum is stronger. This may be explained by resonance production and decay which contributes mostly to that correlation region. For negative charge pairs the maximum is barely visible due to the very low number of resonances decaying into two negatively charged particles.
- (ii)
An enhancement at likely due to a mix of different phenomena. It is rather broad (a bin corresponds here to rad). At small (smaller than about rad) it can be explained by a mixture of Quantum Statistic effects, Coulomb and final state interactions. A difference in height between positive and negative charge pairs is visible, namely in positive charge pairs the peak is significantly smaller than in negative charge pairs (especially for lower beam momenta). It is most probably due to the admixture of protons and an interplay between Bose-Einstein and Fermi-Dirac statistics. The HBT+Coulomb+FS correlations give a significant contribution to that region, however they probably do not explain all the excess. A more detailed discussion is provided in Sec. 7.1.1.
7 Comparison with p+p data and with model predictions
In this section two-particle correlation results presented in the previous section are compared with published \NASixtyOneresults from p+p interactions [9] and to theoretical predictions of the \Epos1.99 and UrQMD 3.4 [30, 31] models.
7.1 Comparison with correlations in p+p reactions
This section presents a comparison of two-particle correlation measurements for the 5% most central Be+Be collisions to those in inelastic p+p interactions reported in Ref. [9]. Figure 10 shows an example comparison of results for beryllium-beryllium collisions (left panel) with results from proton-proton interactions (right panel). The most striking feature is the general difference in correlation strength. Due to the larger combinatorical background, the correlation strength is diluted in Be+Be collisions. For better comparison of the strengths the center panel of Fig. 10 presents the Be+Be results at the p+p scale. The dilution amounts to approximately a factor of 5 which is close to the ratio of pion multiplicities produced in Be+Be and p+p collisions. This is expected in simple models where e.g. the resonance to direct pion production ratio is assumed to be the same in both reactions.


7.1.1 The near-side correlations behaviour
While both in Be+Be collisions and p+p interactions the away side hill is qualitatively similar, a visible difference of the structure at can be seen. To visualize this, the ratio of the difference of the correlation functions from unity for Be+Be () and p+p () was calculated for all pair combinations and beam momenta using the following formula:
| (4) |
The results for all pair combinations and beam momenta are shown in Fig. 11. The near-side peak structure clearly increases in height with beam momentum, demonstrating that the contribution to that region in Be+Be is stronger than in p+p reactions.


The correlation functions for both colliding systems is presented in Fig. 12 in a near-side slice of versus . The values of for p+p interactions were scaled down by a factor of 5 to approximately account for the expected dilution effect.
In Sec. 6.1 the HBT+Coulomb+FS effects were pointed out as a possible source of the peak in the near-side region. These correlations are indeed of importance for small relative four momentum and, as a consequence, for small relative transverse momentum of the hadron pair. They can produce a maximum in at about 20 , stretching out to about 50 (see e.g. Refs. [32, 33, 34, 35]).
The relative azimuthal angle is related to the relative transverse momenta of the hadron pair via the relation:
| (5) |
| (6) |
For \GeVcand the most probable value of transverse momenta of about 0.4 \GeVcthis corresponds to a difference in azimuthal angle of about 0.1 rad. Therefore HBT+Coulomb+FS correlations can explain only a fraction of the enhancement in the first bin in the panels of Fig. 12. A similar conclusion was drawn e.g. in Refs. [36, 37] at RHIC and LHC energies in nucleus-nucleus and p+A interactions. There a cut on was applied to remove HBT+C+FS effects in order to allow cleaner studies of processes like mini-jet production.
In the Fig. 12 we observe larger near-side correlations for negative charge than for positive charge pairs. However, one should remember that the total number of negative charge pairs is about 2 to 3 times smaller than that of the positive charge pairs. This is expected, because of the proton admixture in the positive charge pair sample and, in consequence, contributions of and pairs in addition to combinations. It is not clear, however, why the contribution to the correlation peak from negative charge pairs () seems to be smaller () than that from positive charge pairs (). We hope to understand better the observed difference with the larger statistics data from Ar+Sc collisions.
Due to limited statistics, in particular for 19 and 30, rather large bins in were used in our analysis. To show better the influence of the HBT+Coulomb+FS mechanisms the results of Fig. 12 are shown in Fig. 13 with finer binning (the width of bin here is rad). This figure presents the region of up to 1 radian for beam momenta of 40, 75, and 150. One finds that the fraction of the two first bins corresponds to , and of the whole near-side effect for 40, 75, and 150 respectively, for the sum of all charge configurations. This excludes the dominant role of the HBT+Coulomb+FS mechanisms in the near-side region.
To better visualise the energy dependence of the near-side correlations the first three points from the Fig. 12 were summed up for different charge configurations of the hadron pairs. The result is shown in Fig. 14 for all charge and unlike-sign pairs. A strong energy dependence is observed between 19-30-40 and 75-150 which could favour the onset of mini-jet formation. If the mini-jet hypothesis is correct, the correlation for oppositely charged particles may be due to local charge conservation.
In Fig. 15 the energy dependence of that sum of in Be+Be collisions for the data and models is presented for different charge configurations. In the same figure the experimental results for proton-proton collisions divided by a factor of 5 (i.e. ) are plotted.
7.2 Comparison with models
Since hard-scattering processes are not expected to contribute substantially to particle production at SPS energies comparison of data with models designed to work also at low collision energies, such as \Eposand UrQMD, appear to be most appropriate. One needs to point out that unfortunately the models do not incorporate HBT+Coulomb+FS effects. Correlations in UrQMD and \Eposare probably dominated by resonance production and string fragmentation processes. The resonance contribution was taken into account in both UrQMD and \Eposmodels, but discrepancies between data and simulations persist (see discussion below).
Although SPS energies are rather low, other models, which take into account the possibility of quark-gluon phase formation, were also proposed to explain the observed near-side correlations. These were interpreted as a result of jet fragmentation or color-tube fragmentation [38, 39], originating from a Glasma flux tube [40] or from Parton Bubbles [41, 16, 17]. The latter were initially proposed by Van Hove [18].
7.3 Comparison with the \Eposand UrQMD models
The final corrected results on were compared with predictions of the pure (i.e. not reconstructed) \Eposand UrQMD models. They are presented in the form of projections on the and axes in Fig. 16 and 17, respectively. In case of projection onto the axis the correlations were divided into four sub-ranges of : , , , and . In case of projection onto the axis, the axis was divided into three sub-ranges: , , and . The functions
| (7) |
and
| (8) |
were recalculated in those sub-ranges. Full statistical uncertainty analysis was performed in each sub-range as well. In case of systematic uncertainty analysis, the general method of calculation was similar to the one mentioned in Sec. 5.5, however here the mean systematic uncertainty was not calculated. The difference of () was shown in each bin separately instead. In order to present the results in a clear way, only two sub-ranges are shown in Figs. 16 and 17.
The UrQMD model predictions are in reasonable agreement with the measured data for both 40 and 150 (dashed lines in Figs. 16 and 17) for all charge combinations. However some differences are seen in the region of the smallest and points. The \Eposmodel works well for away-side correlations (large and ) and fails in the near-side region (full lines in Figs. 16 and 17). At the smallest beam momentum 19, the deviations between data and both models are quite large, but the statistical uncertainties are large and the models are not intended for this low energy. Such a discrepancy between both models predictions and the data exists as well for the region , as evident from Fig.12. It appears for both Be+Be and p+p interactions and different charge combinations.
The comparison between model predictions and the Be+Be data in the region of small and is shown in Fig. 15. Both models underpredict the correlation strength for all the energies measured, but the discrepancy is significantly larger for \Epospredictions.
8 Summary
The correlation function was studied by the \NASixtyOneexperiment in the 0-5% most central Be+Be collisions for a range of different incident beam momenta: 19, 30, 40, 75, and 150 .̧ Near-side and away-side correlations were observed and measured as a function of incident momentum and particle charge combinations. The strength of the correlation was compared with that observed by \NASixtyOnein p+p [9] interactions for which the same experimental conditions were applied. A strong suppression of the correlation function is observed as compared with p+p interaction.
In Be+Be interactions, one observes a back-to-back correlation which is rather wide in and decreases with energy (see Fig. 16, 17). The correlation function behaviour of the data is qualitatively described by the UrQMD 3.4 and \Epos1.99 models. The UrQMD model shows better quantitative agreement.
A narrow enhancement around appears clearly for Be+Be collisions (see Figs. 17, 12). It is wider (RMS about rad) in than expected from the contribution of HBT+Coulomb+FS correlations alone and increases with incident energy (see Fig. 14). This observation disagrees with predictions of the studied models, which do not include quantum statistics and Coulomb repulsion effects, but simulate only the production of the majority of hadron resonances. Much stronger near-side correlations were observed at higher energies in nucleus-nucleus and p+A interactions [36, 37]. The \NASixtyOneexperiment continues correlation studies in for Ar+Sc and Xe+La collisions. The results for different nucleus sizes may help to obtain more insight into the importance of the proposed mechanisms.
Acknowledgements
We would like to thank the CERN EP, BE, HSE and EN Departments for the strong support of NA61/SHINE.
This work was supported by the Hungarian Scientific Research Fund (grant NKFIH 123842/123959), the Polish Ministry of Science and Higher Education (grants 667/N-CERN/2010/0, NN 202 48 4339 and NN 202 23 1837), the National Science Centre Poland (grants 2014/14/E/ST2/00018, 2014/15/B/ST2 / 02537 and 2015/18/M/ST2/00125, 2015/19/N/ST2/01689, 2016/23/B/ST2/00692, 2017/ 25/N/ ST2/ 02575, 2018/30/A/ST2/00226, 2018/31/G/ST2/03910), the Russian Science Foundation, grant 16-12-10176 and 17-72-20045, the Russian Academy of Science and the Russian Foundation for Basic Research (grants 08-02-00018, 09-02-00664 and 12-02-91503-CERN), the Russian Foundation for Basic Research (RFBR) funding within the research project no. 18-02-40086, the National Research Nuclear University MEPhI in the framework of the Russian Academic Excellence Project (contract No. 02.a03.21.0005, 27.08.2013), the Ministry of Science and Higher Education of the Russian Federation, Project "Fundamental properties of elementary particles and cosmology" No 0723-2020-0041, the European Union’s Horizon 2020 research and innovation programme under grant agreement No. 871072, the Ministry of Education, Culture, Sports, Science and Technology, Japan, Grant-in-Aid for Scientific Research (grants 18071005, 19034011, 19740162, 20740160 and 20039012), the German Research Foundation (grant GA 1480/8-1), the Bulgarian Nuclear Regulatory Agency and the Joint Institute for Nuclear Research, Dubna (bilateral contract No. 4799-1-18/20), Bulgarian National Science Fund (grant DN08/11), Ministry of Education and Science of the Republic of Serbia (grant OI171002), Swiss Nationalfonds Foundation (grant 200020117913/1), ETH Research Grant TH-01 07-3 and the Fermi National Accelerator Laboratory (Fermilab), a U.S. Department of Energy, Office of Science, HEP User Facility managed by Fermi Research Alliance, LLC (FRA), acting under Contract No. DE-AC02-07CH11359 and the IN2P3-CNRS (France).
References
- [1] N. Abgrall et al., [NA61/SHINE] Collab. JINST 9 (2014) P06005.
- [2] M. Gaździcki and P. Seyboth, Acta Phys. Polon. B47 (2016) 1201.
- [3] K. Eggert et al., Nucl. Phys. B86 (1975) 201.
- [4] B. Alver et al., [PHOBOS] Collab. Phys. Rev. C75 (2007) 054913.
- [5] R. J. Porter and T. A. Trainor, [STAR] Collab. Acta Phys. Polon. B36 (2005) 353.
- [6] R. J. Porter and T. A. Trainor, [STAR] Collab. arXiv:hep-ph/0406330 [hep-ph].
- [7] B. Abelev et al., [ALICE] Collab. Phys. Lett. B741 (2015) 38–50.
- [8] B. Alver et al., [PHOBOS] Collab. Phys. Rev. C81 (2010) 024904.
- [9] A. Aduszkiewicz et al., [NA61/SHINE] Collab. Eur. Phys. J. C77 no. 2, (2017) 59.
- [10] B. Maksiak, PhD thesis, Faculty of Physics, Warsaw University of Technology, CERN-THESIS-2016-282, 2016.
- [11] O. Berrig et al., [CERN and NA61/SHINE] Collab., Tech. Rep., 2011. CERN-SPSC-2011-005.
- [12] M. Gazdzicki and O. Hansen, Nucl.Phys. A528 (1991) 754–770.
- [13] J. L. Nagle and W. A. Zajc, Ann. Rev. Nucl. Part. Sci. 68 (2018) 211–235.
- [14] S. Mohapatra, EPJ Web Conf. 172 (2018) 05002.
- [15] R. S. Bhalerao, arXiv:2009.09586 [nucl-th].
- [16] S. J. Lindenbaum, R. S. Longacre, and M. Kramer, Eur. Phys. J. C30 (2003) 241–253.
- [17] S. J. Lindenbaum and R. S. Longacre, Phys. Rev. C78 (2008) 054904.
- [18] L. Van Hove, Z. Phys. C27 (1985) 135.
- [19] S. Chatrchyan et al., [CMS] Collab. Phys. Lett. B718 (2013) 795–814.
- [20] V. Khachatryan et al., [CMS] Collab. Phys. Rev. Lett. 116 no. 17, (2016) 172302.
- [21] Particle Population Matrix definitions. https://edms.cern.ch/document/1700774/1
- [22] D. Banas et al., Eur. Phys. J. Plus 134 no. 1, (2019) 44.
- [23] PSD acceptance maps for event selection. https://edms.cern.ch/document/1867336/1
- [24] N. Abgrall et al., [NA61/SHINE] Collab. Tech. Rep. CERN-SPSC-2014-031, SPSC-SR-145, CERN, Geneva, Oct, 2014.
- [25] K. Werner, F.-M. Liu, and T. Pierog, Phys. Rev. C74 (2006) 044902.
- [26] E. Kaptur, [NA61/SHINE] Collab. PoS CPOD2014 (2015) 053.
- [27] R. Brun et al., GEANT Detector Description and Simulation Tool, 1994. http://cds.cern.ch/record/1082634
- [28] N. Abgrall, PhD thesis, Geneva University. CERN-THESIS-2011-165, 2011.
- [29] N. Abgrall et al., [NA61/SHINE] Collab. Eur. Phys. J. C74 (2014) 2794.
- [30] S. Bass et al., Prog. Part. Nucl. Phys. 41 (1998) 255–369.
- [31] M. Bleicher et al., J. Phys. G25 (1999) 1859–1896.
- [32] D. Kincses, M. Nagy, and M. Csanád, arXiv:1912.01381 [hep-ph].
- [33] M. A. Lisa et al., Ann. Rev. Nucl. Part. Sci. 55 (2005) 357–402.
- [34] L. Martin et al., “Particle correlations in ultrarelativistic heavy ion experiments STAR at RHIC and ALICE at LHC,” in 4th TAPS International Workshop on Electromagnetic and Hadronic Probes of Nuclear Matter. 3, 1998. https://lss.fnal.gov/archive/other/subatech-98-02.pdf
- [35] Y. Sinyukov et al., Phys. Lett. B 432 (1998) 248–257.
- [36] J. Adams et al., [STAR] Collab. Phys. Rev. C75 (2007) 034901.
- [37] S. Acharya et al., [ALICE] Collab. Phys. Rev. C100 no. 4, (2019) 044903.
- [38] J. Adams et al., [STAR] Collab. Nucl. Phys. A757 (2005) 102–183.
- [39] C. Marquet, Nucl. Phys. A855 (2011) 158.
- [40] A. Dumitru et al., Nucl. Phys. A810 (2008) 91–108.
- [41] S. J. Lindenbaum and R. S. Longacre, J. Phys. G26 (2000) 937–956.
The \NASixtyOneCollaboration
A. Aduszkiewicz 15, E.V. Andronov 21, T. Antićić 3, V. Babkin 19, M. Baszczyk 13, S. Bhosale 10, A. Blondel 4, M. Bogomilov 2, A. Brandin 20, A. Bravar 23, W. Bryliński 17, J. Brzychczyk 12, M. Buryakov 19, O. Busygina 18, A. Bzdak 13, H. Cherif 6, M. Ćirković 22, M. Csanad 7, J. Cybowska 17, T. Czopowicz 9,17, A. Damyanova 23, N. Davis 10, M. Deliyergiyev 9, M. Deveaux 6, A. Dmitriev 19, W. Dominik 15, P. Dorosz 13, J. Dumarchez 4, R. Engel 5, G.A. Feofilov 21, L. Fields 24, Z. Fodor 7,16, A. Garibov 1, M. Gaździcki 6,9, O. Golosov 20, V. Golovatyuk 19, M. Golubeva 18, K. Grebieszkow 17, F. Guber 18, A. Haesler 23, S.N. Igolkin 21, S. Ilieva 2, A. Ivashkin 18, S.R. Johnson 25, K. Kadija 3, N. Kargin 20, E. Kashirin 20, M. Kiełbowicz 10, V.A. Kireyeu 19, V. Klochkov 6, V.I. Kolesnikov 19, D. Kolev 2, A. Korzenev 23, V.N. Kovalenko 21, S. Kowalski 14, M. Koziel 6, A. Krasnoperov 19, W. Kucewicz 13, M. Kuich 15, A. Kurepin 18, D. Larsen 12, A. László 7, T.V. Lazareva 21, M. Lewicki 16, K. Łojek 12, V.V. Lyubushkin 19, M. Maćkowiak-Pawłowska 17, Z. Majka 12, B. Maksiak 11, A.I. Malakhov 19, A. Marcinek 10, A.D. Marino 25, K. Marton 7, H.-J. Mathes 5, T. Matulewicz 15, V. Matveev 19, G.L. Melkumov 19, A.O. Merzlaya 12, B. Messerly 26, Ł. Mik 13, S. Morozov 18,20, S. Mrówczyński 9, Y. Nagai 25, M. Naskręt 16, V. Ozvenchuk 10, V. Paolone 26, O. Petukhov 18, R. Płaneta 12, P. Podlaski 15, B.A. Popov 19,4, B. Porfy 7, M. Posiadała-Zezula 15, D.S. Prokhorova 21, D. Pszczel 11, S. Puławski 14, J. Puzović 22, M. Ravonel 23, R. Renfordt 6, D. Röhrich 8, E. Rondio 11, M. Roth 5, B.T. Rumberger 25, M. Rumyantsev 19, A. Rustamov 1,6, M. Rybczynski 9, A. Rybicki 10, A. Sadovsky 18, K. Schmidt 14, I. Selyuzhenkov 20, A.Yu. Seryakov 21, P. Seyboth 9, M. Słodkowski 17, P. Staszel 12, G. Stefanek 9, J. Stepaniak 11, M. Strikhanov 20, H. Ströbele 6, T. Šuša 3, A. Taranenko 20, A. Tefelska 17, D. Tefelski 17, V. Tereshchenko 19, A. Toia 6, R. Tsenov 2, L. Turko 16, R. Ulrich 5, M. Unger 5, D. Uzhva 21, F.F. Valiev 21, D. Veberič 5, V.V. Vechernin 21, A. Wickremasinghe 26,24, Z. Włodarczyk 9, K. Wojcik 14, O. Wyszyński 9, E.D. Zimmerman 25, and R. Zwaska 24
1 National Nuclear Research Center, Baku, Azerbaijan
2 Faculty of Physics, University of Sofia, Sofia, Bulgaria
3 Ruđer Bošković Institute, Zagreb, Croatia
4 LPNHE, University of Paris VI and VII, Paris, France
5 Karlsruhe Institute of Technology, Karlsruhe, Germany
6 University of Frankfurt, Frankfurt, Germany
7 Wigner Research Centre for Physics of the Hungarian Academy of Sciences, Budapest, Hungary
8 University of Bergen, Bergen, Norway
9 Jan Kochanowski University in Kielce, Poland
10 Institute of Nuclear Physics, Polish Academy of Sciences, Cracow, Poland
11 National Centre for Nuclear Research, Warsaw, Poland
12 Jagiellonian University, Cracow, Poland
13 AGH - University of Science and Technology, Cracow, Poland
14 University of Silesia, Katowice, Poland
15 University of Warsaw, Warsaw, Poland
16 University of Wrocław, Wrocław, Poland
17 Warsaw University of Technology, Warsaw, Poland
18 Institute for Nuclear Research, Moscow, Russia
19 Joint Institute for Nuclear Research, Dubna, Russia
20 National Research Nuclear University (Moscow Engineering Physics Institute), Moscow, Russia
21 St. Petersburg State University, St. Petersburg, Russia
22 University of Belgrade, Belgrade, Serbia
23 University of Geneva, Geneva, Switzerland
24 Fermilab, Batavia, USA
25 University of Colorado, Boulder, USA
26 University of Pittsburgh, Pittsburgh, USA