Effects of the Hubble Parameter on the Cosmic Growth of the First Quasars2020Effects of the Hubble Parameter on the Cosmic Growth of the First Quasars–ReferencesEffects of the Hubble Parameter on the Cosmic Growth of the First Quasars–References
Abstract
Supermassive black holes (SMBHs) play a crucial role in the evolution of galaxies and are currently detected up to . Theories describing black hole (BH) growth are challenged by how rapidly seeds with initial mass , formed at , grew to by . Here we study the effects of the value of the Hubble parameter, , on models describing the early growth of BHs. First, we note that the predicted mass of a quasar at changes by if the underlying Hubble parameter used in the model varies from to km s-1Mpc-1, a range encompassing current estimates. Employing an MCMC approach based on priors from quasars and on , we study the interconnection between and the parameters describing BH growth: seed mass and Eddington ratio . Assuming an Eddington ratio of , in agreement with previous estimates, we find km s-1Mpc-1. In a second analysis, allowing all the parameters to vary freely, we find (at 95% CL), km s-1Mpc-1 and at 68% CL. Our results on the typical Eddington ratio are in agreement with previous estimates. Current values of the Hubble parameter strongly favour heavy seed formation scenarios, with . In our model, with the priors on BH masses of quasars used, light seed formation scenarios are rejected at .
Keywords:
Quasars: supermassive black holes – Cosmological parameters: – Early Universe – Dark ages, reionization, first stars1 Introduction
Numerous surveys of the high-redshift Universe () strongly suggest that supermassive black holes (SMBHs), with masses in the range , are already in place by that cosmic age and provide the energy to power quasars (e.g., Fan et al. 2006; Wu et al. 2015; Bañados et al. 2018a). The detection of several SMBHs at redshift with masses is a significant challenge to the standard model of black hole (BH) growth: in fact, it is still unclear how did these BHs form and grow so rapidly over cosmic time. Current theories describe the first BH seeds to form at , less than Myr after the Big Bang, and then to rapidly grow, by gas accretion and mergers, to their final masses (Pacucci & Loeb 2020). Extensive reviews about the formation and early growth of quasars can be found in Gallerani et al. 2017, Latif & Schleicher 2019, and Inayoshi et al. 2019.
Over the past two decades, a large number of high- quasars have been discovered in surveys as SDSS and the CFHQS (Jiang et al. 2009; Willott et al. 2010), PanSTARRS1 (Bañados et al. 2016), VST/ATLAS (Carnall et al. 2015), DES (Reed et al. 2015; Reed et al. 2017), Subaru/HSC (Matsuoka et al. 2016), UKIDSS (Venemans et al. 2007) and VIKING (Venemans et al. 2015; Venemans et al. 2013). Growing observational and theoretical evidence strongly suggest that the seeds at the origin of these massive objects formed at early times, likely at (Barkana & Loeb 2001).
One possibility, the “light seeds model”, consists in these seeds being formed as remnants of the first population of stars (i.e., Population III, or Pop III, stars). While large uncertainties remain on the initial mass function of Pop III stars, several simulations and theoretical models point to a mass of the BH remnant in the range (e.g., Hirano et al. 2014). Alternatively, the “heavy seeds model” predicts the existence of more massive BHs, with a typical mass scale already at formation. These heavy seeds are named direct collapse black holes (DCBHs; e.g., Bromm & Loeb 2003; Lodato & Natarajan 2006; Pacucci et al. 2017a).
While heavy seeds could reach the mass scale in time to match the observations of quasars with Eddington-limited accretion, light seeds most likely need episodes of super-Eddington accretion (Haiman & Loeb 2001; Volonteri & Rees 2005; Pelupessy et al. 2007; Tanaka & Haiman 2009a; Madau et al. 2014; Volonteri et al. 2015; Pacucci et al. 2015; Begelman & Volonteri 2017; Regan et al. 2019).
In addition to these two baseline formation channels, additional scenarios have been proposed, such as BHs formed from stellar collisions (Devecchi & Volonteri 2009; Devecchi et al. 2012; Katz et al. 2015) and black hole mergers (Davies et al. 2011; Lupi et al. 2014).
Currently, six quasars are known at (Inayoshi et al. 2019). The farthest one thus far is J1342+0928 at with (Bañados et al. 2018a). Future surveys in the electromagnetic spectrum like Lynx (The Lynx Team 2018), AXIS (Mushotzky et al. 2019), Athena (Barret et al. 2020) and the James Webb Space Telescope, as well as surveys in the gravitational wave realm, e.g. LISA (Amaro-Seoane et al. 2017), will provide invaluable information about the formation and the growth process of high- BH seeds (Pacucci & Loeb 2020).
Remarkably, any prediction on how BHs grow over cosmic time depends on the underlying cosmology assumed. A modification in the value of the cosmological parameters used, and/or any extension beyond the concordance CDM cosmology, could significantly change the evolution and the dynamics of the Universe, possibly producing very different predictions for BH growth. Particular attention should be granted to estimates of the Hubble parameter, , which describes the current expansion rate of the universe. The most recent analyses of the Cosmic Microwave Background (CMB) observations by the Planck collaboration, assuming the CDM scenario, obtained km s-1Mpc-1 (Planck Collaboration et al. 2018). A model-independent local measurement by the Hubble Space Telescope (HST) suggested instead km s-1Mpc-1 (Riess et al. 2019), which is in tension with Planck’s estimate. Additionally, the H0LiCOW collaboration reports km s-1Mpc-1 (Wong et al. 2019). Another accurate independent measure was carried out in Freedman et al. 2019, showing that km s-1Mpc-1. These are the most robust estimates of available in literature. As noted, there is a high degree of statistical divergence between them. This observed tension could be a signal of additional fundamental new physics beyond the standard CDM model (see, e.g., Verde et al. 2019; Kumar et al. 2019 and references therein).
Here, we aim to understand the effect of the value of on models for early BH growth. First, we show how the predicted mass at can be significantly affected by the choice of . Then, we constrain using information from the mass of the farthest quasars detected thus far, in the range , assuming that mass growth occurs mostly by gas accretion. Conversely, we then study how much , assumed a free parameter, can influence our estimate of the parameters that quantify the BH growth.
This study is organized as follows. In Sec. 2 we revise the theoretical model used to describe the evolution of BH mass over cosmic time. In Sec. 3 we present our data sets and in Sec. 4 our main results and discussions. Finally, Sec. 5 summarizes our conclusions and presents some future perspectives.
2 The cosmic growth of black holes
In this section we review the theoretical framework used to describe the cosmic growth of BHs via gas accretion, from seed formation () to the observation of the farthest quasars (). The formalism adopted here is described extensively in Pacucci et al. 2015 and Pacucci et al. 2017b (see also, e.g., Shapiro 2005; Ricarte & Natarajan 2018).
The evolution in cosmic time of the BH mass , starting from an initial mass of the seed , is usually described with the following set of three parameters:
- 1.
The matter-to-energy conversion efficiency factor , which describes the fraction of rest-mass energy that is radiated away during gas accretion. The efficiency factor is defined as:
(1) where is the accretion rate onto the BH and is its luminosity. The factor is customarily assumed to be for radiatively efficient accretion disks (Shakura & Sunyaev 1976). In case of optically thick accretion disks, or radiatively inefficient accretion flows (or RIAF), the factor can be significantly lower (see, e.g., Narayan & McClintock 2013).
- 2.
The Eddington ratio, which parametrizes the accretion rate on a BH of mass in terms of the Eddington accretion rate :
(2) - 3.
The duty cycle , quantifying the fraction of time spent accreting (i.e., the continuity of mass inflow). It is worth noting that typical quasar timescales are of order .
If we assume that the accretion rate is dominated by baryonic matter, then the BH growth rate is found with the following expression (see, e.g., Shapiro 2005; Pacucci et al. 2017b):
| (3) |
where is the characteristic accretion timescale, or Salpeter timescale (Salpeter 1955), Gyr.
In general, the matter-to-energy conversion efficiency factor is a strong function of the BH spin (e.g., Bardeen 1970; Novikov & Thorne 1973; Narayan & McClintock 2013). The efficiency for disk accretion onto a Schwarzschild (i.e., non-rotating) BH is , while for a Kerr, maximally rotating BH the value is found to be . In fact, for rotating BHs the accretion disk extends farther inwards, closer to the event horizon, so that a larger fraction of its energy can be radiated away. As we do not track the spin evolution in our work, in what follows we assume .
If we assume that , and are constant between and , we can easily integrate Eq. (3), obtaining:
| (4) |
where is the initial time when the BH has a mass . The lookback time as a function of can be written as
| (5) |
where is the ratio between the Hubble parameter at and its current value. The value is the age of the object at redshift , assuming that it formed at redshift . For our purposes, is the redshift where the quasar is detected, and is the redshift at seed formation.
Assuming that BH growth occurred only via baryonic gas accretion is certainly an approximation. A more realistic scenario would allow for additional growth channels, e.g. black hole mergers and contributions from dark matter (collisionless and self-interacting species). Recent studies (e.g., Pacucci & Loeb 2020) have shown that gas accretion is significantly dominant over mergers for the growth of BHs with in the early Universe (). For this reason, we believe that our model including only gas accretion is, to the first order, a good approximation of how BHs grew at early cosmic epochs.
3 Methodology and data set
In the following we briefly describe the data sets we use to explore the parameter space of our model.
Mass estimates for quasars: We consider quasars in the redshift range [6.5, 7.54], i.e. up to the farthest quasar detected thus far. In particular, we consider the following sources: J2348-3054 (, Venemans
et al. 2016), J0109-3047 (, Venemans
et al. 2016), J0305-3150 (, Venemans
et al. 2016), P036+03 (, Venemans
et al. 2015; Bañados
et al. 2015), J1342+0928 (, Bañados
et al. 2018b), J1243+0100 (, Matsuoka
et al. 2019), J1120+0641 (, Mortlock
et al. 2011) and J0038-1527 (, Wang et al. 2018). This information is summarized in Table 1.
Hence, we include in our analysis all quasars from Inayoshi
et al. 2019 for which an error bar for the mass is reported, and some quasars in the range [6.5, 7.0] for which the error bars are small, i.e. the mass is known typically within a factor . There are currently confirmed quasars within [6.5, 7.0] (see the NASA/IPAC Extragalactic Database, NED, and, e.g., Matsuoka
et al. 2016) but some of these sources are characterized by very large uncertainties for the BH mass, or it is unconstrained altogether. In order to maximize the accuracy of our Markov Chain Monte Carlo method, we choose to limit the sources in our sample.
| Name | ||
|---|---|---|
| J1342+0928 | 7.54 | |
| J1243+0100 | 7.07 | |
| J1120+0641 | 7.085 | |
| J0038-1527 | 7.021 | |
| J2348-3054 | 6.90 | |
| J0109-3047 | 6.80 | |
| J0305-3150 | 6.61 | |
| P036+03 | 6.54 |
Measurement of the Hubble parameter: We adopt the latest measurements of the Hubble parameter obtained in a model-independent way. In particular, we use:
- 1.
The re-analysis of the HST data using Cepheids as calibrators (Riess et al. 2019), which led to a value . We refer to this data point as R19.
- 2.
The recent determination of from the Tip-of-the-Red-Giant-Branch approach (Freedman et al. 2019), which led to a value , including systematic. We refer to this data point as F20.
BH growth model: In our analysis we assume a flat-CDM model as background scenario. Thus, our BH growth model is completely described by the following parameters: the seed initial mass , the redshift formation of the BH , the Hubble parameter , the matter density parameter (baryons + dark matter) , the Eddington ratio and the duty cycle . To decrease the complexity of this 6-dimensional parameter space, we make the following, physically motivated assumptions: (i) we fix , (ii) we fix , and (iii) we fix . The first assumption is motivated by the fact that the concordance flat-CDM model seems to be characterized by smaller uncertainties on than on (Planck Collaboration et al. 2018). The second assumption is supported by several models in early structure formation indicating that the formation of the first BHs occurred in the redshift range (e.g., Barkana & Loeb 2001; Inayoshi et al. 2019). As there is only a difference in cosmic time within this redshift range, comparable to the typical quasar lifetime, we choose to fix as the mid-point of this range of interest. This is further supported by our preliminary analysis, during which we noticed that any value within the flat prior does not change our main results. The third assumption stems from the fact that the Eddington ratio and the duty cycle are completely degenerate in any BH growth model. Hence, we assume and interpret the Eddington ratio as averaged over sufficiently long timescales, typically of the order of the quasar lifetime, i.e. . This assumption is based on semi-analytical models (e.g., Tanaka & Haiman 2009b) as well as measurements of clustering of quasars at (Shen et al. 2007; Shankar et al. 2009).
We use the Markov Chain Monte Carlo (MCMC) method to analyze the parameters , building the posterior probability distribution function
| (6) |
where
| (7) |
Here, runs over all quasars in Table 1, , and are the theoretical BH growth rate defined in Eq. (4), the observational measurement and associated error on the mass of the quasars reported in Table 1, respectively. The quantities and represent the model-independent measurement of the Hubble parameter and its theoretical expectation inferred from the BH growth, respectively.
The goal of any MCMC approach is to draw samples from the general posterior probability density
| (8) |
where and are the prior distribution and the likelihood function, respectively. Here, the quantities and are the set of observations and possible nuisance parameters. The amount is a normalization term.
We subdivided our analysis in three steps: (i) we analyze the SMBH data only, assuming fixed values for the Eddington ratio ; (ii) we analyze the SMBH data only with all parameters free; (iii) we consider the joint analysis SMBH + R19 and SMBH + F20 data.
We perform the statistical analysis based on the emcee algorithm (Foreman-Mackey et al. 2013), assuming the theoretical model described in Sec. 2 and the following priors on the parameters baseline: , , and in our overall analysis. We discard the first 20% steps of the chain as burn-in. We follow the Gelman-Rubin convergence criterion (Gelman & Rubin 1992), checking that all parameters in our chains have , where the parameter quantify the Gelman-Rubin statistic, also know as the potential scale reduction factor. It is recommended that for all model parameters, in order to be confident that convergence is reached. We note in our chains. We carry out a marginalization on .
A flat prior on the seed mass allows both light and massive seeds (see our Sec. 1) to be included in the analysis. A flat prior on the Eddington ratio allows us to consider both sub-Eddington accretion rates and super-Eddington accretion rates, up to above Eddington. Super-Eddington accretion rates are predicted to be common at high-, due to a large availability of cold gas. Simple estimates presented in Begelman & Volonteri 2017 suggest that a fraction of active galactic nuclei could be accreting at super-Eddington rates already at .
4 Results and Discussion
In the following we explore the parameter space with our MCMC approach, in order to constrain the probability distribution of the main parameters characterizing the growth of early BHs.
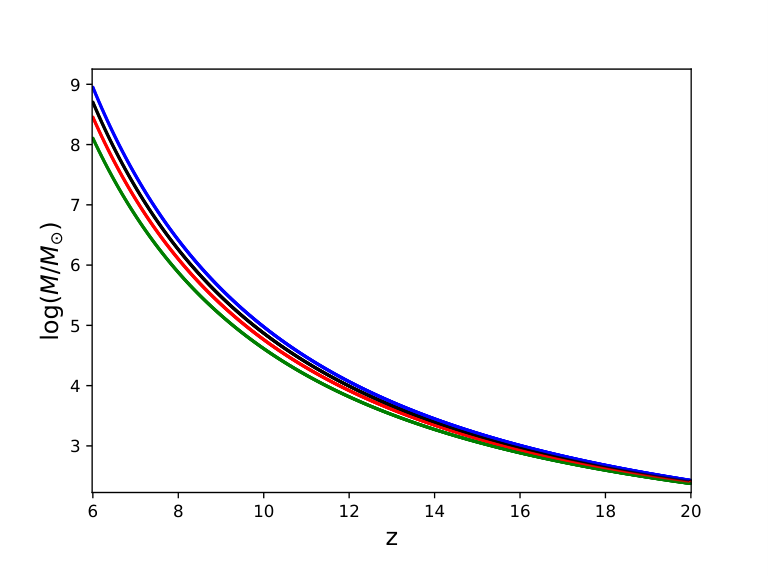
As a case study, in Fig. 1 we show an example of BH mass growth as a function of for four values of . For simplicity, we assume , and initial seed mass of at . In Fig. 2 we show the percentage difference between and (i.e., the mass computed assuming the Planck’s value of or a generic value) as a function of redshift in the range [6, 10], in order to quantify how different values can influence the cosmic evolution of . The differences in the BH mass evolution for are minimal, as the cosmic time from the seeding redshift is very short, i.e. . On the contrary, we note that for the differences in the predicted BH mass start to become significant. In particular, assuming different values and keeping constant, we note significant changes in the final mass at a given value. Specifically, Fig. 2 shows that at the BH mass computed assuming km s-1Mpc-1 and km s-1Mpc-1 differs by 48% and 300%, respectively, from the mass computed assuming the fiducial Planck’s value. As all SMBHs observed thus far are at and given the current tension in the measurement of , analyzing how the value of this parameter can affect the BH mass evolution and, conversely, how observations of quasars can constrain the cosmological parameters is certainly very relevant.
As a first step in our statistical analysis, we only vary the seed mass and , fixing the Eddington ratio at some physically motivated value, specifically at . This sustained rate is supported by the fact that at most of the BHs are predicted to be accreting close to, or even above, the Eddington rate (Begelman & Volonteri 2017), due to a large availability of cold gas. Because of our assumption of , we keep the value of below unity. In Fig. 3 we show the parametric space in the plane , where is the reduced Hubble parameter. We find at 95% confidence level (CL). This result clearly indicates a preference for heavy seeds over light seeds to match the observation of the earliest quasars. For the Hubble parameter, we find km s-1Mpc-1 at 68% CL, in substantial agreement with the measurement by Riess et al. 2019. Considering the 95% CL bounds, instead, we note that may extend to lower values, which are compatible with high- measurements from the CMB. As mentioned in Sec. 1, there is a significant tension on when comparing very high- measures from CMB data with local measures.
As a second step, we vary the parameters of the entire space , and , while fitting the data for our sample of SMBHs. The results are shown in the left panel of Fig. 4. In this global analysis, our results are as follows: , km s-1Mpc-1 and . The lower bound on the initial mass is at 95% CL, while the other constraints are at 68% CL. If we leave all three parameters of our BH growth model free, we notice that the constraints on are loose, certainly not competitive when compared to other robust cosmological tests. In principle, fixing certain parameters in the BH growth model can lead to robust constraints on , when fitting to data from the farthest quasars. Unfortunately, constraining growth parameters is far from straightforward, as they can significantly vary from one BH to another.
In order to improve the estimates in our baseline parameters, we analyze the data combination SMBH + R19 and SMBH + F20. It is important to emphasize that R19 and F20 are model-independent measures. We are using these additional priors to break the statistical degeneracy which characterizes our analysis shown in the left panel of Fig. 4, especially in the parameter, where we use a very loose and flat prior: . The R19 and F20 measures acts to keep our constraints for close to the observed values and, additionally, to improve the constraints on the other parameters. In fact, the BH growth parameters have significant positive correlations with , mainly when analyzed from SMBHs data only (see the left panel of Fig. 4).
The right panel of Fig. 4 shows the parametric space from the joint analysis SMBHs + R19 and SMBH + F20. For the combination SMBH + R19, we find: (at 95% CL), km s-1Mpc-1 and at 68% CL. In the joint case SMBH + F20, we find: (at 95% CL), km s-1Mpc-1 and at 68% CL. We summarize our results for SMBH + R19 and SMBH + F20 as follows:
- •
The addition of R19 and F20 data improves the constraints on by 0.3 dex. Our analysis show that the presence of quasars at strongly favors the formation of BH seeds with mass .
- •
Regarding the parameters of the BH growth model, we note an improvement by 10.86% and 9.58% on from the addition of R19 and F20 data, respectively.
This analysis confirms that Hubble parameter data can be fundamental to improve the constraints on the parameters of the BH growth model.
As a complementary information to the best fit values, Table 2 reports the correlation matrix for the parameters resulting from the analysis SMBH + R19 (the corresponding table for SMBH + F20 is very similar). We emphasize that there is a strong anti-correlation between the parameters and , as expected from their physical interpretation. Also, we note a positive-correlation between and . This warrants a careful choice of the combination of these parameters whenever running numerical simulations.
| 1.00 | -0.01 | -0.89 | |
| -0.01 | 1.00 | 0.43 | |
| -0.89 | 0.43 | 1.00 |
5 Final Remarks
We have investigated the effect that the value of the Hubble parameter has on models for the cosmic growth of BH seeds, by using an MCMC technique to fit mass measurements for quasars. First, we noted that the predicted mass for a BH at changes by % if is changed from 65 to 74 . Assuming that seed formation occurs at , we find a strong preference for heavy seeds with in all our models. With the specific priors on quasars used, light seed formation scenarios are rejected in our model at . Our analysis is improved by considering gaussian priors on the value of , specifically (Riess et al. 2019, or R19) and (Freedman et al. 2019, or F20). When considering the joint analysis SMBH + R19 and SMBH + F20, the priors on the value of the Hubble parameter significantly improve the constraints on . We find that the Eddington ratio can be estimated with an accuracy of 3.9% and 4.6% from SMBH + R19 and SMBH + F20, respectively. Without targeted priors on , we can constrain only with an accuracy of 33%. Of course, additional efforts are needed to better constrain the parameters of BH growth model: numerical and semi-analytical simulations, as well as additional data sets for high- quasars, will provide better estimates. On the other hand, we showed that measurements of the Hubble parameter are fundamental to improve the constraints on these parameters.
We recognize that there is a fundamental difference between the BH growth parameters and the value of the Hubble parameter. While the former parameters depend on the local accretion conditions and, in general, each BH is characterized by a different, possibly time-variable, combination of , the latter is a constant value. Hence, constraining the Hubble parameter by improving our knowledge on seems realistic only with a very large statistical sample of high- quasars. Despite this, we showed that there is a strong correlation between the Hubble parameter and the BH growth parameters: their combined analysis can thus bring a new perspective in the study of the farthest quasars.
An additional contribution to cosmology from the study of quasars could come from low- observations. The Universe is currently undergoing an accelerated expansion and a complete explanation of this observation is still lacking. The concordance model thus far calls for an exotic component of dark energy, at low-, to accelerate the cosmological expansion. Concurrently, the vast majority of AGNs (or accreting SMBHs at the center of galaxies) is currently detected at low redshift. Therefore, it could be fruitful to study how a background expansion of the Universe in the presence of well-motivated dark energy models can also influence SMBH mass estimates at low-, and vice versa. As the lookback time is very sensitive to the density parameter of dark energy at low , a modified background expansion could significantly change the mass growth of BHs in the nearby Universe. We defer this investigation to a future communication.
Acknowledgements
The authors thank the referee for her/his very constructive comments and suggestions. RCN would like to thank the Brazilian Agency FAPESP for financial support under Project No. 2018/18036-5. FP acknowledges support from a Clay Fellowship administered by the Smithsonian Astrophysical Observatory and from the Black Hole Initiative at Harvard University, which is funded by grants from the John Templeton Foundation and the Gordon and Betty Moore Foundation.
References
- Amaro-Seoane et al. (2017) Amaro-Seoane P., et al., 2017, arXiv e-prints, p. arXiv:1702.00786
- Bañados et al. (2015) Bañados E., Decarli R., Walter F., Venemans B. P., Farina E. P., Fan X., 2015, ApJ, 805, L8
- Bañados et al. (2016) Bañados E., et al., 2016, ApJS, 227, 11
- Bañados et al. (2018a) Bañados E., et al., 2018a, Nature, 553, 473
- Bañados et al. (2018b) Bañados E., et al., 2018b, Nature, 553, 473
- Bardeen (1970) Bardeen J. M., 1970, Nature, 226, 64
- Barkana & Loeb (2001) Barkana R., Loeb A., 2001, Phys. Rep., 349, 125
- Barret et al. (2020) Barret D., Decourchelle A., Fabian A., Guainazzi M., Nandra K., Smith R., den Herder J.-W., 2020, Astronomische Nachrichten, 341, 224
- Begelman & Volonteri (2017) Begelman M. C., Volonteri M., 2017, MNRAS, 464, 1102
- Bromm & Loeb (2003) Bromm V., Loeb A., 2003, ApJ, 596, 34
- Carnall et al. (2015) Carnall A. C., et al., 2015, MNRAS, 451, L16
- Davies et al. (2011) Davies M. B., Miller M. C., Bellovary J. M., 2011, ApJ, 740, L42
- Devecchi & Volonteri (2009) Devecchi B., Volonteri M., 2009, ApJ, 694, 302
- Devecchi et al. (2012) Devecchi B., Volonteri M., Rossi E. M., Colpi M., Portegies Zwart S., 2012, MNRAS, 421, 1465
- Fan et al. (2006) Fan X., et al., 2006, AJ, 131, 1203
- Foreman-Mackey et al. (2013) Foreman-Mackey D., Hogg D. W., Lang D., Goodman J., 2013, PASP, 125, 306
- Freedman et al. (2019) Freedman W. L., et al., 2019, ApJ, 882, 34
- Gallerani et al. (2017) Gallerani S., Fan X., Maiolino R., Pacucci F., 2017, Publ. Astron. Soc. Australia, 34, e022
- Gelman & Rubin (1992) Gelman A., Rubin D. B., 1992, Statistical Science, 7, 457
- Haiman & Loeb (2001) Haiman Z., Loeb A., 2001, The Astrophysical Journal, 552, 459
- Hirano et al. (2014) Hirano S., Hosokawa T., Yoshida N., Umeda H., Omukai K., Chiaki G., Yorke H. W., 2014, The Astrophysical Journal, 781, 60
- Inayoshi et al. (2019) Inayoshi K., Visbal E., Haiman Z., 2019, arXiv e-prints, p. arXiv:1911.05791
- Jiang et al. (2009) Jiang L., et al., 2009, The Astronomical Journal, 138, 305
- Katz et al. (2015) Katz H., Sijacki D., Haehnelt M. G., 2015, MNRAS, 451, 2352
- Kumar et al. (2019) Kumar S., Nunes R. C., Yadav S. K., 2019, European Physical Journal C, 79, 576
- Latif & Schleicher (2019) Latif M., Schleicher D., 2019, Formation of the First Black Holes, doi:10.1142/10652.
- Lodato & Natarajan (2006) Lodato G., Natarajan P., 2006, MNRAS, 371, 1813
- Lupi et al. (2014) Lupi A., Colpi M., Devecchi B., Galanti G., Volonteri M., 2014, MNRAS, 442, 3616
- Madau et al. (2014) Madau P., Haardt F., Dotti M., 2014, ApJ, 784, L38
- Matsuoka et al. (2016) Matsuoka Y., et al., 2016, ApJ, 828, 26
- Matsuoka et al. (2019) Matsuoka Y., et al., 2019, The Astrophysical Journal, 872, L2
- Mortlock et al. (2011) Mortlock D. J., et al., 2011, Nature, 474, 616
- Mushotzky et al. (2019) Mushotzky R., et al., 2019, in BAAS. p. 107 (arXiv:1903.04083)
- Narayan & McClintock (2013) Narayan R., McClintock J. E., 2013, arXiv e-prints, p. arXiv:1312.6698
- Novikov & Thorne (1973) Novikov I. D., Thorne K. S., 1973, in Black Holes (Les Astres Occlus). pp 343–450
- Pacucci & Loeb (2020) Pacucci F., Loeb A., 2020, arXiv e-prints, p. arXiv:2004.07246
- Pacucci et al. (2015) Pacucci F., Volonteri M., Ferrara A., 2015, MNRAS, 452, 1922
- Pacucci et al. (2017a) Pacucci F., Natarajan P., Ferrara A., 2017a, ApJ, 835, L36
- Pacucci et al. (2017b) Pacucci F., Natarajan P., Volonteri M., Cappelluti N., Urry C. M., 2017b, The Astrophysical Journal, 850, L42
- Pelupessy et al. (2007) Pelupessy F. I., Di Matteo T., Ciardi B., 2007, ApJ, 665, 107
- Planck Collaboration et al. (2018) Planck Collaboration et al., 2018, arXiv e-prints, p. arXiv:1807.06209
- Reed et al. (2015) Reed S. L., et al., 2015, MNRAS, 454, 3952
- Reed et al. (2017) Reed S. L., et al., 2017, MNRAS, 468, 4702
- Regan et al. (2019) Regan J. A., Downes T. P., Volonteri M., Beckmann R., Lupi A., Trebitsch M., Dubois Y., 2019, MNRAS, 486, 3892
- Ricarte & Natarajan (2018) Ricarte A., Natarajan P., 2018, MNRAS, 474, 1995
- Riess et al. (2019) Riess A. G., Casertano S., Yuan W., Macri L. M., Scolnic D., 2019, The Astrophysical Journal, 876, 85
- Salpeter (1955) Salpeter E. E., 1955, ApJ, 121, 161
- Shakura & Sunyaev (1976) Shakura N. I., Sunyaev R. A., 1976, MNRAS, 175, 613
- Shankar et al. (2009) Shankar F., Weinberg D. H., Miralda-Escudé J., 2009, ApJ, 690, 20
- Shapiro (2005) Shapiro S. L., 2005, The Astrophysical Journal, 620, 59
- Shen et al. (2007) Shen Y., et al., 2007, AJ, 133, 2222
- Tanaka & Haiman (2009a) Tanaka T., Haiman Z., 2009a, ApJ, 696, 1798
- Tanaka & Haiman (2009b) Tanaka T., Haiman Z., 2009b, ApJ, 696, 1798
- The Lynx Team (2018) The Lynx Team 2018, arXiv e-prints, p. arXiv:1809.09642
- Venemans et al. (2007) Venemans B. P., McMahon R. G., Warren S. J., Gonzalez-Solares E. A., Hewett P. C., Mortlock D. J., Dye S., Sharp R. G., 2007, MNRAS, 376, L76
- Venemans et al. (2013) Venemans B. P., et al., 2013, ApJ, 779, 24
- Venemans et al. (2015) Venemans B. P., et al., 2015, ApJ, 801, L11
- Venemans et al. (2016) Venemans B. P., Walter F., Zschaechner L., Decarli R., De Rosa G., Findlay J. R., McMahon R. G., Sutherland W. J., 2016, ApJ, 816, 37
- Verde et al. (2019) Verde L., Treu T., Riess A. G., 2019, Nature Astronomy, 3, 891
- Volonteri & Rees (2005) Volonteri M., Rees M. J., 2005, The Astrophysical Journal, 633, 624
- Volonteri et al. (2015) Volonteri M., Silk J., Dubus G., 2015, ApJ, 804, 148
- Wang et al. (2018) Wang F., et al., 2018, The Astrophysical Journal, 869, L9
- Willott et al. (2010) Willott C. J., et al., 2010, The Astronomical Journal, 140, 546
- Wong et al. (2019) Wong K. C., et al., 2019, arXiv e-prints, p. arXiv:1907.04869
- Wu et al. (2015) Wu X.-B., et al., 2015, Nature, 518, 512