New Constraints On the Origin of Surface Brightness Profile Breaks of Disk Galaxies From MaNGAJournal: ApJ
Abstract
In an effort to probe the origin of surface brightness profile (SBP) breaks widely observed in nearby disk galaxies, we carry out a comparative study of stellar population profiles of 635 disk galaxies selected from the MaNGA spectroscopic survey. We classify our galaxies into single exponential (Ti), down-bending (Tii) and up-bending (Tiii) SBP types, and derive their spin parameters and radial profiles of age/metallicity-sensitive spectral features. Most Tii (Tiii) galaxies have down-bending (up-bending) star formation rate (SFR) radial profiles, implying that abrupt radial changes of SFR intensities contribute to the formation of both Tii and Tiii breaks. Nevertheless, a comparison between our galaxies and simulations suggests that stellar migration plays a significant role in weakening down-bending profile breaks. While there is a correlation between the break strengths of SBPs and age/metallicity-sensitive spectral features for Tii galaxies, no such correlation is found for Tiii galaxies, indicating that stellar migration may not play a major role in shaping Tiii breaks, as is evidenced by a good correspondence between break strengths of and surface brightness profiles of Tiii galaxies. We do not find evidence for galaxy spin being a relevant parameter for forming different SBP types, nor do we find significant differences between the asymmetries of galaxies with different SBP types, suggesting that environmental disturbances or satellite accretion in the recent past do not significantly influence the break formation. By dividing our sample into early and late morphological types, we find that galaxies with different SBP types follow nearly the same tight stellar mass- relation, which makes the hypothesis that stellar migration alone can transform SBP types from Tii to Ti and then to Tiii highly unlikely.
Keywords:
galaxies: formation – galaxies: evolution – galaxies: stellar content – galaxies: structure – galaxies: spiral – galaxies: generalI Introduction
The radial surface brightness profiles of disk galaxies have been studied since the middle of the last century, and it was once thought that they follow a single exponential decline (Patterson 1940; de Vaucouleurs 1959; Freeman 1970). However, since the seminal work by van der Kruit 1979, it has been widely recognized that, instead of following single exponential declining profiles, a large number of galaxies have sharp truncations or breaks in their surface brightness profiles. By analyzing CCD imaging data of large samples of nearby disk galaxies, Erwin et al. 2005 and Pohlen & Trujillo 2006 divided disk galaxy surface brightness profiles into three main types: single exponential profiles (Type I, hereafter Ti), down-bending double exponential profiles (Type II, hereafter Tii) and up-bending double exponential profiles (Type III, hereafter Tiii). Pohlen & Trujillo 2006 found that nearly 90% of their spiral galaxies have broken surface brightness profiles, of which 60% are down-bending profiles and 30% are up-bending profiles. A minor fraction of galaxies even have more than one breaks. Late-type dwarf galaxies continue the trend established for spiral galaxies, with a much larger fraction of Tii than Ti and Tiii profiles (Herrmann et al. 2013). Observations of high redshift galaxies suggest that surface brightness profile breaks are already present in the early universe (Pérez 2004; Azzollini et al. 2008).
Tii profiles are the most common ones among the three disk types. Various mechanisms have been proposed to explain the origin of such down-bending surface brightness profiles. The different mechanisms may be broadly sorted into three categories. The first category attributes the breaks to the maximum angular momentum of the protogalactic clouds which collapsed to form the present-day galaxies (van der Kruit 1987; van der Kruit 1988), the second category invokes an abrupt change in star formation radial profiles (e.g., Kennicutt 1989; Schaye 2004; Elmegreen & Hunter 2006), and the third category invokes stellar radial migration induced by resonant scattering of bars and/or spiral arms (e.g., Sellwood & Binney 2002; Debattista et al. 2006; Roškar et al. 2008; Minchev et al. 2012; Di Matteo et al. 2013). The first category of mechanisms predicts a break radius of around 4 to 5 times the radial scalelengths, which is not consistent with the general observational results that Tii break radii are 3 times the scalelengths (Pohlen & Trujillo 2006, e.g.,). Stellar migration has been widely advocated to explain the U-shaped color/age profiles together with nearly absent stellar mass surface density profile breaks observed in many Tii galaxies (de Jong et al. 2007; Bakos et al. 2008; Yoachim et al. 2012; Radburn-Smith et al. 2012, e.g.,). Nevertheless, simulations within a fully cosmological context found that an abrupt radial change in star formation efficiencies can naturally form down-bending disk profiles, while secular radial migration may play a role in weakening the magnitude of disk profile breaks (Martínez-Serrano et al. 2009; Sánchez-Blázquez et al. 2009).
Tiii profiles are the most commonly observed type in early-type galaxies (Erwin et al. 2005; Gutiérrez et al. 2011). Bakos et al. 2008 find that galaxies with up-bending surface brightness profiles usually also have up-bending stellar mass surface density profiles. Like the Tii profiles, enhanced star formation efficiencies either within or beyond the break radii have been invoked to explain Tiii breaks in actively star-forming galaxies (Hunter & Elmegreen 2006; Laine et al. 2016; Wang et al. 2018). Borlaff et al. 2018 find that the break location and scaling relations of Tiii S0 galaxies up to redshift of 0.6 are compatible to that of their nearby counterparts, and thus suggest that formation of up-bending profiles might be related to gravitational and dynamical processes, contrary to the formation mechanisms proposed for down-bending profiles. It was also suggested that some Tiii profiles might be an artifact caused by a superposition of a smaller single-exponential thin disk and a larger single-exponential thick disk (Comerón et al. 2012). Recent simulations by Herpich et al. 2017 suggest that a strong bar may drive stellar radial migration in low-spin galaxies which leads to formation of up-bending profiles. Nevertheless, environmental influences are probably the most widely advocated formation mechanisms for up-bending profiles (e.g., Erwin et al. 2005; Laine et al. 2014; Watkins et al. 2019). In particular, Younger et al. 2007 show that minor mergers can drive gas inflow toward galaxy centers and at the same time outward transfer of angular momentum, which may result in the formation of up-bending disk profiles. Similarly, Ruiz-Lara et al. 2017 suggest that satellite accretion may help accumulate mass in outer disks and produce up-bending disk profiles. Moreover, Borlaff et al. 2014 show that major mergers can also produce S0-like remnants with up-bending profiles.
Several studies have attempted to explain different disk profile types under a common framework. Recent simulations by Herpich et al. 2015 suggest that there is a correlation between dark matter halo’s initial angular momentum and the resulting stellar radial profiles. In particular, galaxies living in the lowest spin haloes show up-bending disk profiles, while galaxies living in the highest spin haloes develop down-bending disk profiles. In addition, by invoking the two mechanisms of secular stellar migration and satellite accretion, Ruiz-Lara et al. 2017 show that the Ti profile can be an intermediate and transitional type from Tii to Tiii profiles, with the Tiii (Tii) galaxies subject to the strongest (weakest) influence of stellar migration and satellite accretion.
With the advent of large integral field unit (IFU) spectroscopic surveys, such as the Calar Alto Legacy Integral Field Area survey (CALIFA; Sánchez et al. 2012), Sydney-Australian-Astronomical-Observatory Multi-object Integral-Field Spectrograph Galaxy Survey (SAMI; Croom et al. 2012) and Mapping Nearby Galaxies at Apache Point Observatory survey (MaNGA; Bundy et al. 2015), it has become possible to obtain relatively robust constraints on stellar population distribution in large samples of nearby galaxies, which is crucial for a straightforward test of various disk profile formation mechanisms. Based on the CALIFA data, Marino et al. 2016 and Pilyugin et al. 2017 studied the radial gradients of nebular gas abundances of galaxies with different disk profile types. Ruiz-Lara et al. 2016 carried out full spectrum stellar population fitting to 44 CALIFA galaxies and found that U-shaped stellar age radial profiles are present in both Ti and Tii galaxies.
In an effort to gain further insight into the formation mechanisms of different types of disk profiles, the current work makes use of the available Sloan Digital Sky Survey IV (SDSS-IV) MaNGA data to perform a comparative study of stellar population radial variations, galaxy spin and morphologies of galaxies with different profile types. The rest of this paper is structured as follows. Section II presents our sample selection. Section III describes the method used in our data analysis. The main results from our analysis are given in Section IV. A summary and discussion follow in Section V.
II Data and Sample
II.1 Data
The SDSS-IV MaNGA project has been collecting fiber-bundle IFU spectroscopic observations of a representative sample of approximately 10,000 galaxies in the redshift range of . The MaNGA sample is selected from an extended version of the NASA-Sloan Atlas catalogue (Blanton et al. 2011) and have a nearly flat distribution in stellar mass from 109 to 31011 (Wake et al. 2017). MaNGA uses a series of hexagonal optical fiber bundles with different sizes in order to cover galaxies out to 1.5 -band effective radii () for the Primary sample and to 2.5 for the Secondary sample. By using the dual-channel BOSS spectrographs (Smee et al. 2013), MaNGA achieves a continuous wavelength coverage from 3600 Å to 10300 Å with a resolving power of 2000. The reduced datacubes (Law et al. 2016) have a spaxel size of 05 and a typical effective spatial resolution of FWHM 25 (Law et al. 2015). With roughly 3-hr dithered exposures per field, MaNGA reaches a typical S/N of (Å-1 per fiber) at 1.5 and (Å-1 per fiber) at 2.5 (Wake et al. 2017).
The latest SDSS DR15 (Aguado et al. 2019; Fischer et al. 2019) includes MaNGA observations for 4621 galaxies, among which 2956 are from the MaNGA Primary sample and 1665 are from the Secondary sample. We work with galaxies of the Secondary sample in this paper in order to reach beyond the typical radii of surface brightness breaks in nearby disk galaxies (1.5 , Marino et al. 2016). In addition to the reduced spectral datacubes, DR15 also includes higher-level data products (e.g., stellar and emission-line velocity field) produced by the MaNGA Data Analysis Pipeline (DAP, Westfall et al. 2019). These higher-level data products will be used in the following manipulation of MaNGA spectra in this work. We use the SDSS - and -band images to derive surface brightness profiles of our spectroscopic sample. The surface brightness profiles will be used to classify our galaxies into different disk profile types.
II.2 Sample selection
In order to select disk galaxies from the MaNGA Secondary sample, we make use of the MaNGA Deep Learning Morphology Value Added Catalogue (Domínguez Sánchez et al. 2018; Fischer et al. 2019, MDLM-VAC,) which provides Deep Learning based morphological classifications for the SDSS DR15 MaNGA sample. Following Fischer et al. 2019, we use the T-Type 11 1 The MDLM-VAC T-Types are obtained by training with the T-Type catalog of Nair & Abraham 2010 which follows the same morphological classification scheme as RC3 (de Vaucouleurs et al. 1991) for S0 and later types except that S0+ and S0 are assigned the same T-Type value of . The correspondence between T-Types and Hubble morphological types is indicated in the left panel of Figure 2. Note that, unlike the integer T-Type values in Nair & Abraham 2010, MDLM-VAC T-Types are floating point numbers. and parameters from MDLM-VAC to select spiral (T-Type 0) and S0 (T-Type 0, ) galaxies from the Secondary sample. The parameter quantifies the probability of a galaxy being S0 when T-Type 0. In addition, we also require the apparent minor-to-major axis ratio (determined based on our isophotal analysis described below) in order to avoid very edge-on galaxies. The above selection criteria result in 885 relatively face-on spiral or S0 galaxies.
We perform a visual inspection of SDSS images of the above-selected 885 galaxies, and find that 83 of them appear to be either involved in interacting/merging event or substantially contaminated by bright foreground stars. These 83 galaxies are excluded from our following analysis. In addition, as we will show in Section III.2, 18 of the remaining 802 galaxies turn out to have radial surface brightness profiles that are best fitted by non-exponential Sérsic functions (i.e., Sérsic index 1), and another 61 are best fitted by piece-wise exponential functions with more than one breaks. These 79 galaxies are excluded from the current work. Lastly, 88 of the remaining 723 galaxies have surface brightness profile break radii (see Section III.2) that fall outside of the spatial coverage of MaNGA IFU observations, so these galaxies are excluded from further analysis. Therefore, our final sample includes a total of 635 galaxies.
III Data analysis
III.1 Derivation of radial surface brightness profiles
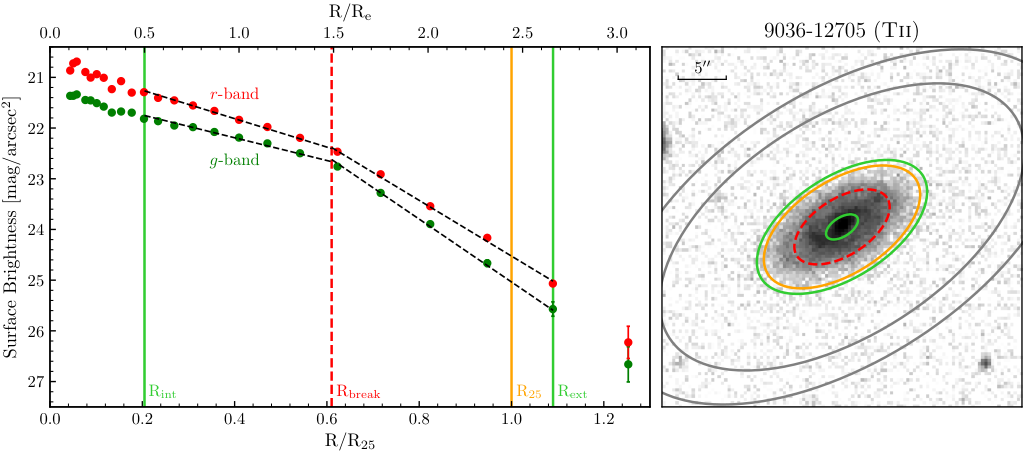
We perform surface photometry on the SDSS - and -band images of galaxies in the MaNGA Secondary sample using the Image Reduction and Analysis Facility (IRAF) task ellipse. To eliminate contamination by foreground and background sources, we create IRAF pixel mask files based on the SEGMENTATION map generated by SExtractor (Bertin & Arnouts 1996). We use the galaxy centers, position angles (PA) and ellipticities from the MaNGA PyMorph Photometric Value Added Catalog (Fischer et al. 2019) as the initial geometric parameters for running ellipse. The isophotal fitting with ellipse is carried out in two steps. In the first step, the galaxy center, PA and ellipticity are allowed to vary with radius in the fitting. In the second step, average values of the best-fit geometric parameters around 1.5 determined in the first step are adopted and kept constant in the second ellipse run.
To determine local sky background for each galaxy, we use a 15-pixel wide elliptical annulus at 5 from the galaxy center and divide the annulus into 15 sectors of equal area. The sky level and its standard deviation are calculated as the median and standard deviation of median pixel values of the 15 sky sectors. The total error budget of our photometry is dominantly contributed by the Poisson noise and uncertainties in sky subtraction. As an example, Figure 1 shows the SDSS image, surface brightness profiles and exponential profile fitting (see Section III.2) for one galaxy selected from our sample.
III.2 Surface brightness profile fitting
We fit the -band radial surface brightness profiles with four sets of model functions. These model functions are, in order of increasing complexity, single exponential, single Sérsic, double exponentials and triple exponentials. The model fitting is limited to data points that are more than 3- brighter than the background. We use the Levenberg-Marquardt least-squares minimization algorithm implemented in MPFIT to find the best-fit parameters for each of the four model functions, and then adopt the corrected Akaike information criterion (AICc) to select the simplest model function that gives an adequate fit to the radial profile of each galaxy. As a sanity check, we also perform a visual inspection of the residuals of model fitting as a function of radius, and find that the AICc-selected best models for 10% of our galaxies do not yield significantly smaller residuals with radius than the next best models with fewer parameters. So we revise the model selection accordingly for these galaxies.
Because our interest in this work is to study disk galaxies with either single or double exponential profiles, we exclude 18 galaxies that are best fitted with non-exponential Sérsic models (i.e., Sérsic index 1) and another 61 galaxies that are best fitted with triple exponential models from the following analysis. The 61 triple-exponential disk galaxies will be the subject of our next work. To eliminate the influence of galaxy bulges on disk profile fitting for the remaining 723 galaxies, we first make a visual identification, if any, of the transition radius from bulge- to disk-dominated regions, and then repeat the exponential model fitting by continuously adjusting the inner radial bound for profile fitting around the visually-identified transition radius until the scale length of the best-fit (inner) exponential model becomes stable.
With the surface brightness profile fitting, our final sample is classified into single exponential profiles (Ti) and double (broken) exponential profiles. The broken exponential profiles are further classified into down-bending profiles whose outer exponentials have steeper radial declining than the inner exponentials (Tii), and up-bending profiles whose outer exponentials have shallower radial declining than the inner exponentials (Tiii).
III.3 Spectral stacking
This work aims to exploit radial gradients of age- or metallicity-sensitive spectral features, including nebular emission lines and Lick absorption line indices (Worthey et al. 1994; Worthey & Ottaviani 1997), to probe the formation mechanisms of disk breaks. In order to obtain robust measurements of the spectral features, especially the Lick absorption line indices which generally requires spectral S/N 20-30 Å-1, we perform spectral stacking (by summing individual spectra) as a function of galactocentric radius. Given the difference between emission line velocity field and absorption line velocity field, two sets of spectral stacking are carried out, one for measuring emission lines and the other one for Lick absorption line indices.
Individual spectra are corrected for Galactic extinction using the Schlegel et al. 1998 extinction map, degraded to the wavelength-dependent Lick/IDS spectral resolution, and then shifted to rest frame before stacking, by using the DAP emission line and absorption line velocity field, respectively, for measuring emission and absorption features. The geometric parameters used for stacking spaxels as a function of radius are the same as those derived from our -band isophotal analysis. The stacking runs from the center to larger radii of each galaxy, with the width of contiguous and non-overlapping radial bins for stacking iteratively increasing outward until the stacked spectra reach S/N 30 Å-1 at wavelength 5500 Å. Only spaxels with spectral S/N 2 are used in our stacking.
III.4 Measurements of spectral features and derivation of stellar mass surface densities
| Lick index | Blue continuum | Feature | Red continuum | Units |
|---|---|---|---|---|
| H | 4057.250-4088.500 | 4091.000-4112.250 | 4114.750-4137.250 | Å |
| Fe4383 | 4359.125-4370.375 | 4369.125-4420.375 | 4442.875-4455.375 | Å |
| Mg1 | 4895.125-4957.625 | 5069.125-5134.125 | 5301.125-5366.125 | mag |
| Mg | 5142.625-5161.375 | 5160.125-5192.625 | 5191.375-5206.375 | Å |
| Fe5270 | 5233.150-5248.150 | 5245.650-5285.650 | 5285.650-5318.150 | Å |
| Fe5335 | 5304.625-5315.875 | 5312.125-5352.125 | 5353.375-5363.375 | Å |
Based on the stacked spectra, we are interested in measuring hydrogen recombination emission lines, the 4000-Å break Dn(4000) (Balogh et al. 1999) and Lick absorption line indices (Worthey et al. 1994; Worthey & Ottaviani 1997). An accurate measurement of the spectral features, particularly the Balmer lines, requires a proper decomposition of the observed spectrum into nebular emission lines and pure stellar absorption spectrum. To this end, we use the Penalized Pixel Fitting (pPXF, Cappellari 2012) software to perform a simultaneous fit of stellar population and Gaussian emission line templates to the stacked spectra. For the stellar population models, we use single stellar population models covering 15 different ages from 0.063 Gyr to 15.8 Gyr and 6 different metallicities from [Z/H] to 0.22.
The Balmer emission line flux is derived directly from the best-fit Gaussian emission-line templates, and the emission line equivalent widths (EW) are obtained by dividing the line flux by local pseudo-continua of the observed spectra. The absorption line features are measured on the emission line subtracted spectra. In addition to measuring the spectral features, we also use the stellar mass-to-light ratios returned by pPXF, together with the measured -band surface photometry, to derive stellar mass surface density profiles of our galaxies.
III.5 Derivation of radial profiles of age/metallicity sensitive spectral indices and star formation
With the above measured spectral indices in hand, we choose to focus on radial profiles of the composite index [MgFe introduced by Thomas et al. 2003 which traces the total metallicities, the magnesium to iron index ratio MgFe which primarily traces the Fe ratio and (thus) star formation timescales, the H index which is among the most age-sensitive Lick indices, and Dn(4000) which serves as an extinction-free indicator of stellar ages and, especially at old ages, metallicities. We also use the extinction corrected (with Balmer decrement method) H luminosities to trace the star formation rate (SFR) averaged over the recent Myr.
Definition of the Lick indices (Worthey et al. 1994; Worthey & Ottaviani 1997) studied in this work is given in Table 1. The composite index [MgFe is a combination of the Mg, Fe5270 and Fe5335 indices and is defined as
| (1) |
and the [MgFe] index is represented by MgFe in Thomas et al. 2003, where Fe (Fe5270 Fe5335). A majority of the MaNGA spectra exhibit noticeable sky-subtraction residuals near the observed wavelength of OI 5577 sky emission line, which results in a contamination to the redshifted Mg, Fe5270 and Fe5335 features, respectively, for 7.5%, 20% and 36.5% of our galaxies. Therefore, we decide to use the Fe4383 index as a substitute for Fe5270 and Fe5335 for our whole sample. Thomas et al. 2003 shows that the Fe4383 index traces Fe abundance nearly as well as the classic indices Fe5270 and Fe5335. For Mg indices, we use the Mg1 index as a substitute for the 7.5% galaxies whose Mg features are contaminated by the sky-subtraction residuals. Thomas et al. 2003 shows that the response of Mg1 to element abundance changes is very similar to Mg.
In order to keep a formal consistency with the original definition of the composite indices, we determine the following empirical relationships based on our galaxies with none of the above mentioned Lick absorption features affected by sky-subtraction residuals:
| (2) | |||
| (3) | |||
| (4) |
These relations have r.m.s. scatters 0.2. We follow the definition in Thomas et al. 2003 to derive [MgFe and MgFe, by using the indices Fe5270, Fe5335 and Mg inferred based on the above three equations.
III.6 Classification of the radial profiles of and
Similar to the practice of classifying surface brightness profiles into Ti, Tii and Tiii (Section III.2), we perform linear regression on the and radial profiles and then make a classification of their basic radial trends. Specifically, we classify radial profiles into single exponential, down-bending double exponential and up-bending double exponential declining profiles, in analogy to the Ti, Tii and Tiii surface brightness profile types. We classify the profiles into single linear, up-bending, down-bending-D, down-bending-F and down-bending- radial shapes, where down-bending-D means the radial gradient becomes shallower but do not change direction beyond the break radius, down-bending-F means the radial gradient becomes flat (i.e., being consistent with zero within 2 uncertainties) beyond the break radius and down-bending- means an approximately -shaped radial profile.
We point out that spectral-index radial profiles can not always be accurately represented by either single or broken linear relations, and our intention here is just to capture the basic radial trend. The profile classification will be used for exploring the influence of galaxy spin on the formation of stellar radial profile breaks. The profile classification will be used as a proxy for stellar age profile classification. Among the three subtypes of down-bending profiles, the -shape profiles correspond to the familiar U-shape age profiles which have been invoked as an observational evidence for stellar radial migration effect.
III.7 Derivation of the spin parameter
Some recent simulations suggest that the halo spin parameter may play an important role in shaping different disk profile types. Generally speaking, the halo spin parameter can not be strictly calculated based on observations. Hernandez et al. 2007 developed a method to obtain an approximate estimate of halo spin parameters of disk galaxies based on the observed stellar disk size, as quantified by the exponential disk scalelength, and maximum stellar rotation velocity (Equation 9 in Hernandez et al. 2007). We choose to use the Hernandez et al. 2007 method to estimate spin parameters of our galaxies.
Most of our galaxies have double-exponential radial profiles, so it is not straightforward to define an exponential disk scalelength for estimation. To proceed, we first derive the disk half-light radius for each galaxy by integrating the best-fit single or double exponential -band radial profile, and then calculate an equivalent disk scalelength as /1.678.
To estimate the maximum rotation velocity, we construct absorption-line rotation curves by using the geometric parameters (i.e., center, ellipticity and PA) derived from our isophotal analysis. Inclination-corrected rotation velocity at a given radius of a galaxy is determined by fitting a sinusoidal function to the azimuthal distribution of the line-of-sight velocity measurements (retrieved from the MaNGA DAP products) of spaxels falling within an elliptical annulus. The maximum rotation velocity is then determined by fitting the rotation curve with a functional form given in Barrera-Ballesteros et al. 2018.
IV Results
IV.1 Hubble types, bars and stellar masses of galaxies with different surface brightness profile types
Among the 635 galaxies in our final sample, 152 (24%) have Ti surface brightness profiles, 264 (42%) have Tii profiles and 219 (34%) have Tiii profiles. The dominant fraction of double exponential profiles (76%) is broadly in line with statistics from previous studies (e.g., 90% in Pohlen & Trujillo 2006, 88% in Gutiérrez et al. 2011 and 84% in Marino et al. 2016). Note that the higher fraction of double exponential profiles found in previous studies should be primarily attributed to an underrepresentation of early-type disk galaxies which have higher fraction of Ti profiles than late-type galaxies (Gutiérrez et al. 2011). Also recall that we have excluded triple exponential profiles from our final sample. Figure 2 shows the fraction of different disk profile types as a function of T-Type (left panel). The fraction of Tii profiles increases toward later T-Types, reaching the maximum of 60% at T-Type 2 (i.e., Sab and later). In contrast to Tii profiles, the fraction of Tiii profiles increases toward earlier T-Types, peaking at 60% at T-Type (i.e., S0 and earlier). The fraction of Ti profiles ( 20%) at T-Type 0 is generally higher (by a factor of 2) than at later T-Types. All of these trends are in general agreement with previous studies (Gutiérrez et al. 2011, e.g.,).
We use the MDLM-VAC P_bar_GZ2 parameter (the probability of having a bar signature) to select the most probable and (thus) strongly barred galaxies in our sample with P_bar_GZ2 50%, and plot their distributions separately in the left panel of Figure 2. We can see that galaxies with strong bars account for a small fraction ( %) of our samples at any given T-Types. Tii galaxies appear to have a higher bar fraction than the other two profile types at T-Types 0.5. Nevertheless, we point out that the actual fraction of barred galaxies, especially when taking into account of the weakly barred ones, can probably reach up to %, as suggested in a recent study by Erwin 2018.
The fraction of different disk profile types generally has a weak stellar mass dependence (right panel of Figure 2). The slight increase of the fraction of Tiii profiles toward higher stellar masses probably reflects the well-known morphology-mass correlation (Calvi et al. 2012, e.g.,), whereby more massive galaxies are more likely to have earlier Hubble types (and thus a higher fraction of Tiii profiles). In a similar vein, the slight decrease of the fraction of Ti profiles toward higher stellar masses appears to be in line with a lower fraction of Ti profiles at later Hubble types.
IV.2 Mass-size relation for galaxies with different surface brightness profile types
The distribution of our galaxies on the stellar mass-size planes is shown in Figure 3. Instead of using the half-light radius , which is a biased size measurement when comparing galaxies with different light concentrations (see below), we choose to use the the -band 25 mag arcsec-2 isophotal radius to quantify the overall size of our galaxies. Note that the -band 25 mag arcsec-2 isophotes (on the AB system) reach mag (depending on galaxy types) fainter, and hence further in radius, than the familiar -band 25 mag arcsec-2 (on the Vega system) isophotes. We can see that galaxies with different disk profile types follow nearly the same relation, once the sample is divided into early-type (T-Type 1) and late-type (T-Type 1) disk galaxies. In addition, for given and T-Types, galaxies of the three profile types have very similar median () colors at (not shown here), with typical differences 0.05 mag, which suggests that they have nearly the same median stellar mass surface densities at , considering a general correlation between () and stellar mass-to-light ratios. It is worth mentioning that previous studies found similar surface mass densities at the break radii of different profile types (Bakos et al. 2008; Herrmann et al. 2016). The similar mass- relations for galaxies with different profile types make the hypothesis that stellar radial migration alone may transform Tii to Ti and finally to Tiii profiles highly unlikely.
To understand the formation processes of disk breaks, it is helpful to compare the exponential disk scale lengths of Ti profiles to that of the inner- and outer-exponential disk of broken profiles. Such comparisons are shown in the middle and bottom rows of Figure 3. By dividing the sample into early-type and late-type galaxies, it is obvious that Tii galaxies (middle row) generally have larger inner-disk median than Ti galaxies, whereas Tiii galaxies (bottom row) generally have smaller inner-disk median than Ti galaxies, irrespective of the morphological types. On the other hand, the outer-disk median of early-type (late-type) Tii galaxies is generally similar to (smaller than) the of Ti galaxies, while the outer-disk median of Tiii galaxies is mostly larger than that of Ti galaxies. Above all, neither the inner-disk nor the outer-disk is an appropriate size parameter to use when comparing galaxies with different disk profile types and morphological types. We also note that the scatter of the mass- relations is generally larger than that of the mass- relations.
IV.3 Radial locations of surface brightness profile breaks
The surface brightness profile breaks of our Tii and Tiii galaxies are located at a range of galactocentric radii from 1.3 kpc to 23.3 kpc. We present the distribution of the break radii normalized by and respectively in the left and right panels of Figure 4. The distribution of Tii galaxies peaks at significantly smaller values than that of Tiii galaxies, with a median of 1.47 for the Tii galaxies and 1.92 for the Tiii galaxies. In contrast to , of Tii and Tiii galaxies have very similar distributions, with virtually the same median values (0.580.16 and 0.570.23).
IV.4 Radial profiles of surface brightness, spectral features and
| Sample | Profile shapes | ||||
|---|---|---|---|---|---|
| Up-bending | Single | Down-bending-D | Down-bending-F | Down-bending- | |
| Early-type Ti | 16(20%) | 39(49%) | 4(5%) | 9(11%) | 11(14%) |
| Early-type Tii | 8(17%) | 21(44%) | 1(2%) | 8(17%) | 11(22%) |
| Early-type Tiii | 20(15%) | 73(55%) | 5(4%) | 25(19%) | 10(8%) |
| Late-type Ti | 6(8%) | 24(33%) | 9(12%) | 24(33%) | 10(14%) |
| Late-type Tii | 23(12%) | 38(19%) | 22(11%) | 56(28%) | 60(30%) |
| Late-type Tiii | 13(22%) | 12(20%) | 6(10%) | 21(35%) | 8(13%) |
Representative examples of radial profiles of the -band surface brightness, and our interested spectral features for the Ti, Tii and Tiii galaxies are shown in Figures 13, 5 and 14 respectively. The breaks of surface brightness profiles and other profiles explored here, whenever they exist, are in reasonable agreement in their radial locations. As described in Section III.6, we make a classification of the basic shapes of radial profiles. The results of the classification are illustrated in Figure 6 and are also given in Table 2. Generally speaking, down-bending radial profiles correspond to up-bending stellar age radial profiles, and down-bending -shape radial profiles correspond to V-shape (or the commonly denoted U-shape) stellar age radial profile.
Galaxies exhibit a diversity of radial profiles of the age/metallicity-sensitive spectral features and , irrespective of their surface brightness profile types. Similar findings have been reported previously (Roediger et al. 2012; Ruiz-Lara et al. 2016, e.g.,), but with an order of magnitude larger and much more homogeneous sample than previous studies, we can now obtain relatively robust statistics on the frequency of different stellar age (as traced by ) profile types for the first time. As shown in Figure 6, the distribution of profile shapes have an obvious dependence on Hubble types, in the sense that the single linear profile shape is the most common one among early-type disk galaxies (T-Type 1), irrespective of surface brightness profile types, whereas the down-bending profiles, including down-bending-F and down-bending-, are the most common ones among late-type disk galaxies (T-Type 1), again irrespective of surface brightness profile types. In addition, the familiar U-shape stellar age profiles, as represented by the -shape profiles here, are the most common ones only in late-type Tii galaxies.
IV.5 Radial gradient slopes of inner versus outer disks

Generally speaking, stellar radial migration induced by either resonant scattering of non-axisymmetric structures (e.g., bars, spiral arms) or environmental influences (e.g., satellite accretion) tends to weaken stellar population gradients (see references in the Introduction section). In order to test whether different surface brightness profile types can be qualitatively explained by different efficiencies of stellar radial migration, Figure 7 compares radial gradient slopes of age-, metallicity- and SFR-sensitive spectral features for galaxies with different surface brightness profile types. Both the scatter of various distributions (grey error bars) and statistical uncertainties of the medians (green, red and blue error bars) are indicated in Figure 7.
We first discuss the median trend for the age-sensitive features. The inner disks of Tii galaxies (regardless of the morphological types) have positive median () that are opposite to the outer disks, which corresponds to the familiar U-shape or V-shape stellar age profiles. (log EW(H)) of Tii galaxies follows a similar inner-outer contrast as (), with an apparent exception of the early-type ones (T-Type 1) which have nearly the same inner and outer median (log EW(H)) within uncertainties. Tii galaxies have the steepest (positive) inner-disk median () and (log EW(H)) among the three profile types for the whole sample, which seems consistent with the idea that Tii profiles are the least influenced by stellar migration effect, but it is not the case once splitting the whole sample into early and late morphological types. For the early-type subsamples, the three break types appear to have similar inner-disk median () and (log EW(H)), and their outer-disk median gradients are also very close to each other when considering the statistical uncertainties. For the late-type subsamples, the Ti and Tii galaxies have similar positive inner-disk median () and (log EW(H)) that are significantly steeper than that of the Tiii galaxies.
Regarding the in situ star formation distributions as traced by profiles, the outer disks of Tii (Tiii) galaxies have steeper (shallower) median (log ) than the inner disks, which is an unambiguous evidence that abrupt changes in star formation intensities from the inner disks to outer disks contribute to the formation of both down-bending and up-bending breaks, irrespective of morphological types. This also rules out the possibility that a superposition of thin and thick disks with different scale lengths is a dominant mechanism for shaping Tiii profiles in our sample. Moreover, late-type Tiii galaxies have significantly more negative inner-disk median (log ) than late-type Ti and Tii galaxies, suggesting that star formation in Tiii galaxies is usually much more concentrated toward smaller radii. For the early-type subsample, the Tii and Tiii galaxies have about the same inner and outer (log ) as their late-type counterparts, but the Ti galaxies have significantly more negative inner and outer median (log ) than their late-type counterparts.
Regarding the metallicities, late-type Ti and Tii galaxies have significantly steeper inner-disk median ([MgFe]′) than late-type Tiii galaxies, whereas the reverse is true for early-type galaxies. Ti and Tii galaxies have comparable inner-disk median ([MgFe]′) within uncertainties. For the outer disks, Tii galaxies have slightly shallower ([MgFe]′) than Ti and Tiii galaxies. Ti and Tiii galaxies have comparable outer-disk median ([MgFe]′) within uncertainties. It is worth noting that the outer-disk median ([MgFe]′) is always shallower than the inner-disk ([MgFe]′) for any given profile type, which indicates either a non-negligible effect of stellar radial migration or satellite accretion for Ti and Tii galaxies, because otherwise we would expect the outer-disk metallicity gradients to be similar to or steeper than the inner-disk gradients (Sánchez-Blázquez et al. 2009, e.g.,). For Tiii galaxies, however, the relatively steeper inner-disk median ([MgFe]′) may be primarily ascribed to a steeper radial decline of star formation efficiency at the inner disks. All of the above trends for ([MgFe]′) generally apply to (Mg/Fe).
Based on 214 spiral galaxies from the CALIFA survey, Ruiz-Lara et al. 2017 found that Tii galaxies show the steepest inner-disk radial gradients of stellar ages and metallicities, Tiii galaxies show the shallowest, and Ti galaxies have radial gradients in between that of Tii and Tiii galaxies. With nearly 3 times larger sample size and a much more uniform coverage of stellar masses and morphological types than the Ruiz-Lara et al. 2017 study, we find a more complicated dependence of stellar population gradients on disk profile types. In particular, late-type Tii galaxies do not have significantly steeper median gradient slopes than Ti galaxies, and early-type Tiii galaxies have steeper, instead of shallower, inner-disk median metallicity gradient slopes than the other two profile types. Stellar radial migration is expected to gradually weaken stellar population gradients. Therefore, our finding negates the simple hypothesis that stellar radial migration alone can transform profile types from Tii to Ti and then to Tiii, in line with our conclusion drawn in Section IV.2.
IV.6 Radial profile break strengths
Different formation scenarios of disk breaks generally predict different behaviors of stellar population radial variations across the disks. In this section, we use the outer minus inner radial gradient slope differences to quantify the break strengths of our galaxies, and explore the relationship between the radial profile break strengths of spectral features, , and surface brightness. Note that we use the break radii measured based on the surface brightness profiles for calculating the break strengths of other profiles. Ti galaxies with down-bending or up-bending profiles are also included in the following comparisons, and for these galaxies, the profile break radii are used for calculating break strengths. For the sake of brevity, we do not distinguish between early-type and late-type galaxies in this section, but point out that the differences (see below) between early-type galaxies with different profile types are generally significantly smaller than that between late-type galaxies.
IV.6.1 Break strengths of surface brightness profiles versus other profiles
Figure 8 compares the break strengths of surface brightness profiles to that of the spectral features, and profiles. Tii galaxies have mostly negative (), positive ([MgFe]′), positive (Mg/Fe), negative (log ) and negative (log EW(H)). Moreover, Tii galaxies with stronger surface brightness profile breaks (i.e., more negative ) also have stronger median break strengths in the other explored radial profiles. In particular, the correspondence between the break strengths of and surface brightness profiles for the whole sample is largely consistent with that expected if SFR is proportional to the stellar light intensity (the top right panel of Figure 8). However, the (log ) distribution of Tii galaxies is skewed toward weaker break strengths compared to that would be expected if is proportional to stellar light intensity (the bottom right panel of Figure 8).
Our finding for a systematically weaker break strengths than that of the surface brightness profiles is in the similar sense to previous studies which, based on broadband optical photometry, found a near absence of breaks in the co-added profiles of Tii galaxies (Bakos et al. 2008, e.g.,), but here we emphasize that galaxies with Tii surface brightness profiles generally have Tii profiles. As we will show in Section IV.6.2, stellar radial migration may play an important role in weakening but not completely erasing the Tii breaks. We mention in passing that dwarf galaxies with Tii surface brightness profiles also generally have Tii profiles (Zhang et al. 2012; Herrmann et al. 2016).
Contrary to the Tii galaxies, Tiii galaxies generally have weak or no correspondence between of surface brightness profiles and the explored spectral feature profiles. Nevertheless, there is a significant positive correlation between the break strengths of surface brightness and profiles of Tiii galaxies, and the sense of this correlation is largely in line with that expected if is proportional to stellar light intensity (i.e. the mass-to-light ratios stay more or less constant with radius), which is clearly illustrated in the bottom right panel of Figure 8. Ti galaxies have close to zero median break strengths for all of the radial profiles explored here.
IV.6.2 Break strengths of versus profiles
Disk profile breaks that were produced by an abrupt change in star formation intensities may be expected to show a good correspondence between the break strengths of and profiles, whereas those formed through or significantly affected by stellar redistribution or accretion may not be expected to have such a correspondence. Figure 9 shows the (log )(log ) distributions for different surface brightness profile types. The SFR surface densities are estimated from extinction-corrected H flux densities. We compare our observations with predictions of a fully cosmological hydrodynamical simulation of galaxy disk formation by Sánchez-Blázquez et al. 2009.
According to the simulation of Sánchez-Blázquez et al. 2009, the down-bending break in surface brightness profile owes its origin primarily to an abrupt decrease in gas volume density and thus in star formation efficiencies at large galactocentric distances. The stellar radial migration, which is induced either by non-axisymmetric structures in galaxies (e.g., bars and spiral arms) or environmental disturbances, tends to weaken the break strengths in stellar mass surface density profiles over time.
The simulation results shown in Figure 9 correspond to the predicted radial profiles at redshift (Figures 4 and 16 in Sánchez-Blázquez et al. 2009). The result from the simulation with stellar migration falls near the peak of the observed (log )(log ) distribution of Tii galaxies, whereas the simulation without stellar migration fails to match observations of any disk profile types. According to the Sánchez-Blázquez et al. 2009 simulation involving stellar radial migration, 60% of the stars presently located beyond the break radius have migrated from the inner disk. We note that the Sánchez-Blázquez et al. 2009 simulations are limited to a low-spin Milky Way-like disk galaxy. It remains to be seen whether similar simulations covering a large parameter space (e.g., spin, mass and environment) can match the observations for all of the disk profile types.
IV.7 Relevance of the spin parameter to disk profile types
According to the classical disk formation scenario (Fall & Efstathiou 1980; Dalcanton et al. 1997; Mo et al. 1998), the angular momentum of galaxy disks arises in the same way as their dark matter halos (i.e., through tidal torques with neighboring structures), and thus the sizes of galaxy disks are scaled with the pre-collapse angular momentum of the host halos. To add to the plausible relevance of halo angular momentum to disk formation, recent simulations by Herpich et al. 2015 find a correlation between the host halo’s initial angular momentum and stellar disk profile types, in the sense that Tii galaxies formed in halos with the highest angular momentum whereas Tiii galaxies formed in halos with the lowest angular momentum.
Here we attempt to make a direct observational test for the relevance of galaxy angular momentum to disk break formation. Figure 10 presents the distribution of the spin parameter for disk classifications based on surface brightness profiles. The spin parameter has been commonly used to quantify the angular momentum of galaxies in the literature. Estimation of is described in Section III.7. We divide the sample into early-type (T-Type 1) and late-type (T-Type 1) galaxies and show their distributions separately in the top and bottom panels of the left column in Figures 10. The -values returned by the Kolmogorov-Smirnov test for subsamples with different surface brightness profile types are indicated in the figure. For early morphological types, there is no significant () difference between the distributions of Ti, Tii and Tiii galaxies, but for late-type morphological types, Ti galaxies have a significantly broader distribution and higher median value than do Tii and Tiii galaxies, with no significant difference between Tii and Tiii galaxies. Given that the halo spin parameter distribution is virtually mass independent and has a very mild cosmic evolution (Muñoz-Cuartas et al. 2011, e.g.,), our results are in conflict with the above-mentioned simulation results of Herpich et al. 2015.
Compared to the surface brightness profile, stellar mass profile is probably a more fundamental property to use when exploring the connection with spin parameters. We classify the profiles of our galaxies into three types, in the same way that we do for classifying the surface brightness profiles except that the break radii, if any, are fixed to that of the surface brightness profiles. To estimate the spin parameter appropriate for stellar mass distributions, we also calculate the equivalent scalelengths of the profiles, in the same way as for surface brightness profiles. The resultant distributions based on profiles are shown in the right column of Figure 10. There are no significant differences between different profile types, irrespective of the morphological types.
In addition to distributions, it is also of our interest to verify whether there is a correlation between the break radius and for galaxies of given masses, as is found in the simulations of Herpich et al. 2015. In Figure 11, we explore the relation between and for galaxies with stellar masses comparable to that of the Milky Way. The Spearman’s rank correlation coefficient for galaxies with different T-Types and profile types is indicated in Figure 11. There is no significant correlation between and for any subsamples shown in Figure 11, again suggesting that the present-day disk profile break is not directly linked to the galaxy spin parameter. Our conclusion here does not depend on the choice of stellar mass ranges.
IV.8 Photometric asymmetry of galaxies with different disk profile types
Tidal disturbances (Erwin et al. 2005; Watkins et al. 2019, e.g.,) and galaxy mergers (Younger et al. 2007; Borlaff et al. 2014, e.g.,) have been invoked as possible formation mechanisms for stellar profile breaks, especially in Tiii galaxies. Galaxies involved in tidal interactions are expected to have distorted or peculiar stellar structures. Photometric asymmetry measurements have been commonly used for automatic recognition of interacting signatures. Here we compare the distribution of the photometric shape asymmetry measurements from the SDSS PawlikMorph catalog22
2
https://data.sdss.org/datamodel/files/MANGA_MORPHOLOGY/
sedmorph/PawlikMorph.html for our galaxies with different surface brightness profile types in Figure 12. The shape asymmetry parameters are measured using the 8-connected structure detection algorithm to enhance the detectability of low surface brightness tidal features (Pawlik et al. 2016).
As shown in Figure 12, there is no significant difference between the asymmetry parameter distributions of late-type galaxies with different surface brightness types. For early-type galaxies, the only (marginally) significant difference is that between Tii and Tiii galaxies, with a Kolmogorov-Smirnov test -value of 0.04. The early-type Ti and Tii galaxies have slightly larger median asymmetry values than Tiii galaxies, which appears to be contrary to the popular thought that mergers or satellite accretion may play a more important role in producing Tiii profiles (Watkins et al. 2019, e.g.,).
V SUMMARY
In an effort to probe the origin of surface brightness profile breaks observed in nearby disk galaxies, we have carried out a comparative study of the radial profiles of surface brightness and stellar populations (out to 2.5) of galaxies with single exponential (Ti), down-bending double exponential (Tii) and up-bending double exponential (Tiii) surface brightness profiles, based on IFU spectroscopic data of 635 disk galaxies selected from the SDSS DR15 MaNGA data release. In particular, we use the index and EW(H) to trace the luminosity-weighted stellar ages, the [MgFe]′ and Mg/Fe indices to trace stellar metallicities, and the H luminosities to trace the recent SFR. We also derive stellar mass surface density profiles based on mass-to-light ratios estimated from a full spectrum fitting and galaxy spin parameters based on rotation curves extracted from the spectroscopic data cubes. Our main results and their implications are summarized below.
- •
Tii profiles are mainly found in late-type galaxies (T-Type 1), while Tiii profiles are mainly found in early-type galaxies (T-Type 1). This general trend is consistent with previous studies. Once dividing our sample into early-type and late-type galaxies, Ti, Tii and Tiii galaxies follow about the same stellar mass- relation (Figure 3), where is the -band 25 mag arcsec-2 isophotal radius. At given stellar masses and T-Types, corresponds to nearly the same stellar mass surface densities for the three profile types. Moreover, the typical radii of surface brightness profile breaks, once normalized by , are about the same for Tii and Tiii galaxies, with a median / ratio 0.6 (Figure 4). The similar mass-size relation for different profile types makes the hypothesis that stellar radial migration alone can transform disk profiles from Tii to Ti and then to Tiii types highly unlikely, because radial migration is expected to gradually increase stellar densities beyond the break radii. This conclusion is corroborated by our finding of no significant difference between the stellar metallicity gradients of Ti and Tii galaxies (Figure 7).
- •
Galaxies exhibit a diversity of radial profile shapes in the age/metallicity-sensitive spectral features, irrespective of their surface brightness profile types. Nevertheless, as one of the most age-sensitive Lick indices, has a single linear radial profile for a dominant fraction of early-type disk galaxies (T-Type 1) while a down-bending radial profile for a dominant fraction of late-type disk galaxies (T-Type 1), irrespective of the surface brightness profile types (Figure 4). The familiar U-shape stellar age profiles, as represented by -shape profiles in this paper, are the dominant ones only for late-type Tii galaxies.
- •
As a tracer of in situ star formation intensities, has a down-bending radial declining for most Tii galaxies while an up-bending radial declining for most Tiii galaxies, irrespective of T-Types (Figure 7). This provides an unambiguous evidence that abrupt changes of star formation intensities from the inner to outer disks contribute to the formation of both Tii and Tiii breaks, and at the same time rules out the possibility that a superposition of thin and thick disks with different scalelengths is an important mechanism for forming Tiii breaks in our sample. Nevertheless, a comparison between the observed distribution of our galaxies and previous simulations (Sánchez-Blázquez et al. 2009) on the radial break strengths of versus plane suggests that stellar radial migration plays a significant role in weakening the down-bending profile breaks produced by in-situ star formation (Figure 9). According to these simulations, more than half of the stars beyond the break radius have migrated from inner disks.
- •
There is a general correspondence between the break strengths (i.e., outer-minus-inner disk gradient slope differences) of spectral feature and surface brightness profiles for Tii galaxies, in the sense that stronger down-bending surface brightness profile breaks correspond to stronger down-bending (and EW(H)) profile breaks and stronger up-bending [MgFe]′ (and Mg/Fe) profile breaks. No such correlations are found for Tiii galaxies (Figure 8). Tiii galaxies have close to zero median break strengths in and EW(H) profiles and much weaker median up-bending breaks in [MgFe]′ and Mg/Fe profiles than Tii galaxies. The lack of correlation for Tiii galaxies may imply that stellar radial migration does not play a major role in shaping the up-bending disk profiles, as is evidenced by the good correspondence between the break strengths of and optical stellar light profiles.
- •
Contrary to predictions from some recent simulations which invoke galaxy spin parameter to explain the formation of different disk profile types (Herpich et al. 2015, e.g.,), we do not find significant differences between distributions of Ti, Tii and Tiii galaxies, nor do we find significant correlations between and break radius at given stellar masses (Figures 10, 11).
- •
There are no significant differences between photometric asymmetries of different profile types, suggesting that environmental disturbances or satellite accretion in the recent past do not play an important role in the formation of surface brightness profile breaks (Figure 12).
Above all, we conclude that Tii surface brightness breaks are primarily formed by abrupt drops in star formation intensities beyond the break radii, but stellar radial migration plays a significant role in weakening the resultant down-bending profile breaks. It is obvious that in situ star formation also contributes to the formation of Tiii breaks. Our finding that Tiii galaxies (especially at later morphological types) have steeper inner-disk star formation radial gradient slopes than Ti and Tii galaxies implies that an enhancement of star formation intensities at smaller radii, instead of at larger radii, is the primary mechanism for shaping Tiii profiles in out sample.
References
- Aguado et al. (2019) Aguado, D. S., Ahumada, R., Almeida, A., et al. 2019, ApJS, 240, 23, doi: 10.3847/1538-4365/aaf651
- Azzollini et al. (2008) Azzollini, R., Trujillo, I., & Beckman, J. E. 2008, ApJ, 684, 1026, doi: 10.1086/590142
- Bakos et al. (2008) Bakos, J., Trujillo, I., & Pohlen, M. 2008, ApJ, 683, L103, doi: 10.1086/591671
- Balogh et al. (1999) Balogh, M. L., Morris, S. L., Yee, H. K. C., Carlberg, R. G., & Ellingson, E. 1999, ApJ, 527, 54, doi: 10.1086/308056
- Barrera-Ballesteros et al. (2018) Barrera-Ballesteros, J. K., Heckman, T., Sánchez, S. F., et al. 2018, ApJ, 852, 74, doi: 10.3847/1538-4357/aa9b31
- Bertin & Arnouts (1996) Bertin, E., & Arnouts, S. 1996, A&AS, 117, 393, doi: 10.1051/aas:1996164
- Blanton et al. (2011) Blanton, M. R., Kazin, E., Muna, D., Weaver, B. A., & Price-Whelan, A. 2011, AJ, 142, 31, doi: 10.1088/0004-6256/142/1/31
- Borlaff et al. (2014) Borlaff, A., Eliche-Moral, M. C., Rodríguez-Pérez, C., et al. 2014, A&A, 570, A103, doi: 10.1051/0004-6361/201424299
- Borlaff et al. (2018) Borlaff, A., Eliche-Moral, M. C., Beckman, J. E., et al. 2018, A&A, 615, A26, doi: 10.1051/0004-6361/201732090
- Bundy et al. (2015) Bundy, K., Bershady, M. A., Law, D. R., et al. 2015, ApJ, 798, 7, doi: 10.1088/0004-637X/798/1/7
- Calvi et al. (2012) Calvi, R., Poggianti, B. M., Fasano, G., & Vulcani, B. 2012, MNRAS, 419, L14, doi: 10.1111/j.1745-3933.2011.01168.x
- Cappellari (2012) Cappellari, M. 2012, pPXF: Penalized Pixel-Fitting stellar kinematics extraction. http://ascl.net/1210.002
- Comerón et al. (2012) Comerón, S., Elmegreen, B. G., Salo, H., et al. 2012, ApJ, 759, 98, doi: 10.1088/0004-637X/759/2/98
- Croom et al. (2012) Croom, S. M., Lawrence, J. S., Bland-Hawthorn, J., et al. 2012, MNRAS, 421, 872, doi: 10.1111/j.1365-2966.2011.20365.x
- Dalcanton et al. (1997) Dalcanton, J. J., Spergel, D. N., & Summers, F. J. 1997, ApJ, 482, 659, doi: 10.1086/304182
- de Jong et al. (2007) de Jong, R. S., Seth, A. C., Radburn-Smith, D. J., et al. 2007, ApJ, 667, L49, doi: 10.1086/522035
- de Vaucouleurs (1959) de Vaucouleurs, G. 1959, ApJ, 130, 728, doi: 10.1086/146764
- de Vaucouleurs et al. (1991) de Vaucouleurs, G., de Vaucouleurs, A., Corwin, Herold G., J., et al. 1991, Third Reference Catalogue of Bright Galaxies
- Debattista et al. (2006) Debattista, V. P., Mayer, L., Carollo, C. M., et al. 2006, ApJ, 645, 209, doi: 10.1086/504147
- Di Matteo et al. (2013) Di Matteo, P., Haywood, M., Combes, F., Semelin, B., & Snaith, O. N. 2013, A&A, 553, A102, doi: 10.1051/0004-6361/201220539
- Domínguez Sánchez et al. (2018) Domínguez Sánchez, H., Huertas-Company, M., Bernardi, M., Tuccillo, D., & Fischer, J. L. 2018, MNRAS, 476, 3661, doi: 10.1093/mnras/sty338
- Elmegreen & Hunter (2006) Elmegreen, B. G., & Hunter, D. A. 2006, ApJ, 636, 712, doi: 10.1086/498082
- Erwin (2018) Erwin, P. 2018, MNRAS, 474, 5372, doi: 10.1093/mnras/stx3117
- Erwin et al. (2005) Erwin, P., Beckman, J. E., & Pohlen, M. 2005, ApJ, 626, L81, doi: 10.1086/431739
- Fall & Efstathiou (1980) Fall, S. M., & Efstathiou, G. 1980, MNRAS, 193, 189, doi: 10.1093/mnras/193.2.189
- Fischer et al. (2019) Fischer, J. L., Domínguez Sánchez, H., & Bernardi, M. 2019, MNRAS, 483, 2057, doi: 10.1093/mnras/sty3135
- Freeman (1970) Freeman, K. C. 1970, ApJ, 160, 811, doi: 10.1086/150474
- Gutiérrez et al. (2011) Gutiérrez, L., Erwin, P., Aladro, R., & Beckman, J. E. 2011, AJ, 142, 145, doi: 10.1088/0004-6256/142/5/145
- Hernandez et al. (2007) Hernandez, X., Park, C., Cervantes-Sodi, B., & Choi, Y.-Y. 2007, MNRAS, 375, 163, doi: 10.1111/j.1365-2966.2006.11274.x
- Herpich et al. (2017) Herpich, J., Stinson, G. S., Rix, H. W., Martig, M., & Dutton, A. A. 2017, MNRAS, 470, 4941, doi: 10.1093/mnras/stx1511
- Herpich et al. (2015) Herpich, J., Stinson, G. S., Dutton, A. A., et al. 2015, MNRAS, 448, L99, doi: 10.1093/mnrasl/slv006
- Herrmann et al. (2013) Herrmann, K. A., Hunter, D. A., & Elmegreen, B. G. 2013, AJ, 146, 104, doi: 10.1088/0004-6256/146/5/104
- Herrmann et al. (2016) —. 2016, AJ, 151, 145, doi: 10.3847/0004-6256/151/6/145
- Hunter & Elmegreen (2006) Hunter, D. A., & Elmegreen, B. G. 2006, ApJS, 162, 49, doi: 10.1086/498096
- Kennicutt (1989) Kennicutt, Robert C., J. 1989, ApJ, 344, 685, doi: 10.1086/167834
- Laine et al. (2016) Laine, J., Laurikainen, E., & Salo, H. 2016, A&A, 596, A25, doi: 10.1051/0004-6361/201628397
- Laine et al. (2014) Laine, J., Laurikainen, E., Salo, H., et al. 2014, MNRAS, 441, 1992, doi: 10.1093/mnras/stu628
- Law et al. (2016) Law, D. R., Cherinka, B., & MaNGA Team. 2016, in American Astronomical Society Meeting Abstracts, Vol. 227, American Astronomical Society Meeting Abstracts #227, 312.13
- Law et al. (2015) Law, D. R., Yan, R., Bershady, M. A., et al. 2015, AJ, 150, 19, doi: 10.1088/0004-6256/150/1/19
- Marino et al. (2016) Marino, R. A., Gil de Paz, A., Sánchez, S. F., et al. 2016, A&A, 585, A47, doi: 10.1051/0004-6361/201526986
- Martínez-Serrano et al. (2009) Martínez-Serrano, F. J., Serna, A., Doménech-Moral, M., & Domínguez-Tenreiro, R. 2009, ApJ, 705, L133, doi: 10.1088/0004-637X/705/2/L133
- Minchev et al. (2012) Minchev, I., Famaey, B., Quillen, A. C., et al. 2012, A&A, 548, A126, doi: 10.1051/0004-6361/201219198
- Mo et al. (1998) Mo, H. J., Mao, S., & White, S. D. M. 1998, MNRAS, 295, 319, doi: 10.1046/j.1365-8711.1998.01227.x
- Muñoz-Cuartas et al. (2011) Muñoz-Cuartas, J. C., Macciò, A. V., Gottlöber, S., & Dutton, A. A. 2011, MNRAS, 411, 584, doi: 10.1111/j.1365-2966.2010.17704.x
- Nair & Abraham (2010) Nair, P. B., & Abraham, R. G. 2010, ApJS, 186, 427, doi: 10.1088/0067-0049/186/2/427
- Patterson (1940) Patterson, F. S. 1940, Harvard College Observatory Bulletin, 914, 9
- Pawlik et al. (2016) Pawlik, M. M., Wild, V., Walcher, C. J., et al. 2016, MNRAS, 456, 3032, doi: 10.1093/mnras/stv2878
- Pérez (2004) Pérez, I. 2004, A&A, 427, L17, doi: 10.1051/0004-6361:200400090
- Pilyugin et al. (2017) Pilyugin, L. S., Grebel, E. K., Zinchenko, I. A., Nefedyev, Y. A., & Vílchez, J. M. 2017, A&A, 608, A127, doi: 10.1051/0004-6361/201731256
- Pohlen & Trujillo (2006) Pohlen, M., & Trujillo, I. 2006, A&A, 454, 759, doi: 10.1051/0004-6361:20064883
- Radburn-Smith et al. (2012) Radburn-Smith, D. J., Roškar, R., Debattista, V. P., et al. 2012, ApJ, 753, 138, doi: 10.1088/0004-637X/753/2/138
- Roediger et al. (2012) Roediger, J. C., Courteau, S., Sánchez-Blázquez, P., & McDonald, M. 2012, ApJ, 758, 41, doi: 10.1088/0004-637X/758/1/41
- Roškar et al. (2008) Roškar, R., Debattista, V. P., Stinson, G. S., et al. 2008, ApJ, 675, L65, doi: 10.1086/586734
- Ruiz-Lara et al. (2017) Ruiz-Lara, T., Few, C. G., Florido, E., et al. 2017, A&A, 608, A126, doi: 10.1051/0004-6361/201731485
- Ruiz-Lara et al. (2016) Ruiz-Lara, T., Pérez, I., Florido, E., et al. 2016, MNRAS, 456, L35, doi: 10.1093/mnrasl/slv174
- Sánchez et al. (2012) Sánchez, S. F., Kennicutt, R. C., Gil de Paz, A., et al. 2012, A&A, 538, A8, doi: 10.1051/0004-6361/201117353
- Sánchez-Blázquez et al. (2009) Sánchez-Blázquez, P., Courty, S., Gibson, B. K., & Brook, C. B. 2009, MNRAS, 398, 591, doi: 10.1111/j.1365-2966.2009.15133.x
- Schaye (2004) Schaye, J. 2004, ApJ, 609, 667, doi: 10.1086/421232
- Schlegel et al. (1998) Schlegel, D., Finkbeiner, D., & Davis, M. 1998, in Wide Field Surveys in Cosmology, ed. S. Colombi, Y. Mellier, & B. Raban, Vol. 14, 297. https://arxiv.org/abs/astro-ph/9809230
- Sellwood & Binney (2002) Sellwood, J. A., & Binney, J. J. 2002, MNRAS, 336, 785, doi: 10.1046/j.1365-8711.2002.05806.x
- Smee et al. (2013) Smee, S. A., Gunn, J. E., Uomoto, A., et al. 2013, AJ, 146, 32, doi: 10.1088/0004-6256/146/2/32
- Thomas et al. (2003) Thomas, D., Maraston, C., & Bender, R. 2003, MNRAS, 339, 897, doi: 10.1046/j.1365-8711.2003.06248.x
- van der Kruit (1979) van der Kruit, P. C. 1979, A&AS, 38, 15
- van der Kruit (1987) —. 1987, A&A, 173, 59
- van der Kruit (1988) —. 1988, A&A, 192, 117
- Wake et al. (2017) Wake, D. A., Bundy, K., Diamond-Stanic, A. M., et al. 2017, AJ, 154, 86, doi: 10.3847/1538-3881/aa7ecc
- Wang et al. (2018) Wang, J., Zheng, Z., D’Souza, R., et al. 2018, MNRAS, 479, 4292, doi: 10.1093/mnras/sty1687
- Watkins et al. (2019) Watkins, A. E., Laine, J., Comerón, S., Janz, J., & Salo, H. 2019, A&A, 625, A36, doi: 10.1051/0004-6361/201935130
- Westfall et al. (2019) Westfall, K. B., Cappellari, M., Bershady, M. A., et al. 2019, AJ, 158, 231, doi: 10.3847/1538-3881/ab44a2
- Worthey et al. (1994) Worthey, G., Faber, S. M., Gonzalez, J. J., & Burstein, D. 1994, ApJS, 94, 687, doi: 10.1086/192087
- Worthey & Ottaviani (1997) Worthey, G., & Ottaviani, D. L. 1997, ApJS, 111, 377, doi: 10.1086/313021
- Yoachim et al. (2012) Yoachim, P., Roškar, R., & Debattista, V. P. 2012, ApJ, 752, 97, doi: 10.1088/0004-637X/752/2/97
- Younger et al. (2007) Younger, J. D., Cox, T. J., Seth, A. C., & Hernquist, L. 2007, ApJ, 670, 269, doi: 10.1086/521976
- Zhang et al. (2012) Zhang, H.-X., Hunter, D. A., Elmegreen, B. G., Gao, Y., & Schruba, A. 2012, AJ, 143, 47, doi: 10.1088/0004-6256/143/2/47