CLEAR II: Evidence for Early Formation of the Most Compact Quiescent Galaxies at High Redshift
Abstract
The origin of the correlations between mass, morphology, quenched fraction, and formation history in galaxies is difficult to define, primarily due to the uncertainties in galaxy star-formation histories. Star-formation histories are better constrained for higher redshift galaxies, observed closer to their formation and quenching epochs. Here we use “non-parametric” star-formation histories and a nested sampling method to derive constraints on the formation and quenching timescales of quiescent galaxies at . We model deep HST grism spectroscopy and photometry from the CLEAR (CANDELS Lyman Emission at Reionization) survey. The galaxy formation redshifts, (defined as the point where they had formed 50% of their stellar mass) range from (shortly prior to the observed epoch) up to . We find that early formation redshifts are correlated with high stellar-mass surface densities, 10.25, where is the stellar mass within 1 pkpc (proper kpc). Quiescent galaxies with the highest stellar-mass surface density, , show a minimum formation redshift: all such objects in our sample have . Quiescent galaxies with lower surface density, , show a range of formation epochs (), implying these galaxies experienced a range of formation and assembly histories. We argue that the surface density threshold uniquely identifies galaxies that formed in the first few Gyr after the Big Bang, and we discuss the implications this has for galaxy formation models.
I Introduction
One of the major outstanding questions in galaxy evolution is “how do massive quiescent galaxies form?”. These galaxies exhibit many extreme traits: compact morphologies (Whitaker et al. 2012; van der Wel et al. 2014, e.g.), indications of rapid formation histories (including [/Fe] enhancement and high star-formation rates [SFRs] at early times) (Papovich et al. 2006; Lonoce et al. 2015; Kriek et al. 2015; Kriek et al. 2019, e.g.,), old stellar populations (Gallazzi et al. 2005; Thomas et al. 2005; Gallazzi et al. 2014; Estrada-Carpenter et al. 2019), and high overall metallicity () (Estrada-Carpenter et al. 2019; Ferreras et al. 2019; Kriek et al. 2019).
Multiple theories have been proposed to explain the inability of massive galaxies to continue star-formation. A very important difference in these models is the timescale of quenching (Man & Belli 2018, e.g.,). Studies in this area have led to the identification of “fast” and “slow” evolutionary paths, which describe the relative rate of quenching (Barro et al. 2013; Wellons et al. 2015; Belli et al. 2019).
The slow path applies to galaxies that quench their star-formation by experiencing a gradual slowdown in their gas accretion rates combined with the consumption or heating of their existing gas (Papovich et al. 2015, as may be the case in the Milky Way,). These galaxies can have compact morphologies if they formed in the early universe (Wellons et al. 2015, when densities were higher, e.g.) or if they undergo (secular) compaction events or dissipative mergers (Dekel et al. 2009; Wellons et al. 2015; Barro et al. 2017). The fast path normally requires a fast-acting compaction event (i.e., major mergers, extreme disk instabilities). This can drive extreme star-formation and/or supermassive black hole accretion, the feedback from which quenches star-formation. Due to higher gas fractions, the fast quenching path may be more common in the early universe (Dekel et al. 2009; Daddi et al. 2010).
The key difference in the physical processes of quenching is the speed at which it occurs. This can be studied using constraints on the galaxies’ star-formation histories (SFHs). Quenching can be correlated with galaxy morphology if the quenching mechanism involves reorganization of the galaxies’ stellar component (such as compaction), or a natural consequence of “inside-out” growth combined with disk fading e.g., Lilly & Carollo 2016). Therefore, deriving the SFHs and comparing them to the morphologies of galaxies has the potential to constrain the quenching mechanisms.
Here, we aim to constrain the SFHs of a large sample of massive quiescent galaxies () at and study these as a function of morphology. Throughout we use a cosmology with , , and km s-1 Mpc-1.
II Data
We use data from the CLEAR survey (a Cycle 23 HST program, PI: Papovich), which consists of deep (12 orbit) HST/WFC3 G102 slitless grism spectroscopy covering µm within 12 fields split between the CANDELS GOODS-North (GN) and GOODS-South (GS) fields (Grogin et al. 2011; Koekemoer et al. 2011; Estrada-Carpenter et al. 2019, see,). These fields overlap with the 3D-HST GOODS fields (Momcheva et al. 2016), which provide shallow (2 orbit depth) slitless G141 grism coverage from µm. The galaxies of interest lie at , where our spectral coverage includes many metallicity and age features. These include the 4000 Å break, Balmer lines (H, H, H, H), Ca HK, Mg, and other absorption features. We also utilize the broadband photometry available (using an updated catalog from Skelton et al. 2014 that includes photometry in the -band from HST/WFC3 in F098M or F105W, see Estrada-Carpenter et al. 2019 and CLEAR collaboration, in prep). The broadband photometric data spans 0.3–8 µm (rest-frame UV to near-IR) allowing for better SFH constraints. We include all bands available in Skelton et al. 2014 (now including the WFC3 F098M and F105W data), with the exceptions of the MOIRCS , and Suprime-cam , -bands in GOODS-N, and with the exceptions of the ISAAC , the ESO/WFI -band, and the IA768, IA797 filters in GOODS-S. These bands consistently showed large biases in the flux calibration (up to mag) compared to residuals between the galaxies’ data and our best-fit models. While these flux-calibration offsets were consistent with those reported by Skelton et al. 2014, we found very larger scatter, which made their flux calibration uncertain. In all cases the excluded bands are significantly shallower than other bands that cover these wavelengths (by up to mag), and excluding these bands had no impact on our final fits.
Figure 2 shows examples of the full data coverage for the broadband photometry and grism spectroscopy. We used the Grism redshift & line analysis software Grizli11 1 https://github.com/gbrammer/grizli for spectral extractions and grism forward modeling. For our analysis, we include all HST/WFC3 grism data available. The primary dataset is from CLEAR, but we include additional WFC3/G102 data from GO 13420 (PI: Barro) and Faint Infrared Grism Survey (FIGS) (Pirzkal et al. 2017) when these overlap with galaxies in the CLEAR fields, as these additional data help to reduce contamination and increase the overall signal to noise of the grism data. Due to the nature of grism data there are instances when the spectra of our galaxies show residual contamination from the spectra of nearby objects (especially in the case that the nearby objects are significantly brighter in flux). For our sample, we visually inspected the individual beams of each object. In cases where we observed any residual contamination, we either removed those beams or masked the residual emission. This affected individual beams in 9% of the objects in our sample. The residuals from contamination subtraction are frequently worse in the G141 spectra. This is primarily due to the fact that these data are taken with only a single HST ORIENT. Therefore the contamination (collisions from the spectra of nearby galaxies) is modeled in only a single role angle, where multiple role angles improve the correction by modeling the galaxy spectra at independent locations (Estrada-Carpenter et al. 2019, see discussion in, e.g.,). In part, this was one reason that we included in our models additional (nuisance) parameters that allow for a bias or tilt to the grism data (see Section III.1). The residuals from contaminating spectra are less severe in the G102 spectra, which include multiple orbits (at least 3 ORIENTs). As discussed below, we include with this Paper an online, interactive appendix that shows the data for each of the galaxies in our sample, see also Appendix B.
For our analysis below, we also make use of MIPS 24 data for the GOODS-N and GOODS-S fields from the GOODS Spitzer Legacy program (Magnelli et al. 2011, PI: M. Dickinson, see,). We use here an updated catalog derived from photometry derived using prior source positions from Spitzer/IRAC (using the same procedures and methods identical to that of Magnelli et al. 2011; [H. Inami and M. Dickinson, private communication]). These catalogs are also discussed in Papovich et al. 2015.
II.1 Sample Selection
Following Estrada-Carpenter et al. 2019, we select quiescent galaxies using a rest-frame – color-color diagram () selection (Whitaker et al. 2011, see),
| (1) | |||||
as seen in Figure 1. For our parent sample we select galaxies with 0.6 3.5 and using updated photometric redshifts (), stellar masses (), and rest-frame colors derived from the broad-band photometry derived from EAZY-py22 2 https://github.com/gbrammer/eazy-py. Our parent sample then consists of 174 candidate quiescent galaxies using these selection criteria. These are shown in Figure 1, subdivided by photometric redshift. We use the redshifts from the broad-band data to select the parent sample even when we have redshifts from grism data using the Grizli extractions (). This is because it is possible for Grizli to misidentify emissions lines, which occur either in low signal-to-noise data, or in cases where objects have residual contamination (e.g., emission lines from nearby objects which are removed post extraction as explained in Section II).
We therefore use the EAZY-py fits to the broad-band data to define our initial sample (from and the rest-frame and colors) and then subsequently refine our sample using the fits to the broad-band photometry and both the G102 and G141 grism data from our analysis below (, see Section III below). Here, we provide some comparisons between the different redshifts. Comparing our adopted redshifts () to either those from Grizli () or to those from the broad-band photometry alone (), the difference is small. We find a small scatter for the redshifts derived from the grism data, with . Fewer than 8% of the galaxies (13 of 174) show differences in redshift as large as , and this appears to be the result of the misidentification of weak emission lines where the grism data is noisy. The difference between our adopted redshifts () and those from the broad-band photometry alone () have larger scatter, , but this is consistent with the uncertainty of the photometric redshifts derived from broad-band photometry compared to spectroscopy (Dahlen et al. 2013; Skelton et al. 2014; Straatman et al. 2016, see, e.g.,).
We then apply a secondary sample selection using the results from our new stellar population fits to the broad-band data and grism data (see Section III below). First we remove 12 galaxies that had poor quality grism spectra, either because they had low SNR ( < 1 pixel-1), had severe contamination from nearby objects, and/or fell near the edge of the WFC3 grism field (where they had 30% spectroscopic coverage in the grism data). We then refine the selection to include only galaxies with 0.7 2.5 and , where the grism subscript denotes quantities deriving using our fits to the broad-band photometry and G102+G141 grism data (see Section III). The redshift range is used to ensure that the HST/WFC3 G102+G141 data include important rest-optical spectral features that are sensitive to age and metallicity (see below), while the stellar mass limit corresponds to (approximately) a volume limited sample limited in stellar mass over this redshift range for our SNR requirement. Furthermore, the bias and scatter between the stellar masses from EAZY-py (used for the parent sample) and the grism-derived method (used for the final sample) are small ( dex and dex, respectively) so this does not affect our final sample which uses a higher stellar-mass limit. We then removed X-ray sources by cross-matching our catalog with sources with ″ within any source in the the 2 Ms Chandra Deep Field-North Survey (Xue et al. 2016) and 7 Ms Chandra Deep Field-South Survey catalogs (Luo et al. 2017). We also incorporate morphological information using results from Sersic-fits, derived using GALFIT (Peng et al. 2002), from van der Wel et al. 2014. We remove galaxies with a fit quality flag of 3 (or “no fit”). Finally we limit our sample to a stellar mass surface density () of 9.6 to remove potential satellites. The final sample passing all our selection criteria includes 98 quiescent galaxies. We show these as large red symbols in Figure 1.
Several previous studies (Whitaker et al. 2013; Fumagalli et al. 2014, e.g.,) have shown that the selection of quiescent galaxies is susceptible to contamination from dust-reddened star-forming galaxies. We tested for this possibility in our own sample by cross-correlating the sources in our catalog against those in the MIPS 24 data for these fields. Of our 98 quiescent galaxies we find matches for 15 of our galaxies within 0.5″. Because the MIPS 24 m point-spread function (FWHM 6″) is substantially larger than that of HST/WFC3 (FWHM ) we inspected the sources visually using the HST/WFC3 images (F125W, F160W bands), Spitzer/IRAC images (3.6, 4.5, 5.8, 8.0 m bands) and MIPS 24 m image. From this, we determined that 9/15 of the 24 m detections are likely a result of flux from nearby sources (as evidenced from the fact that the nearby neighbor is brighter in the IRAC data). We therefore do not remove these galaxies from our sample. In the remaining 6/15 of the 24 m sources, only two have SNR(24m) 5. For completeness, we keep these galaxies in our sample, however, we find that excluding them has no impact on our conclusions as they span a range of stellar mass surface density and formation redshift see below). In addition, all our galaxies have derived specific SFRs (sSFR; averaged over the last 100 Myr) from the broad-band photometry and grism data of , consistent with them being quiescent as they all lie at least 1.5 dex below the star-forming main sequence (Santini et al. 2017). Therefore, even if these objects have obscured star-formation or AGN, it is not a significant contributor to the light dominating the HST grism data and photometry, which instead appears to originate from passively evolving stellar populations.

III Methods
III.1 Modeling the Stellar Populations and Star-Formation Histories
To constrain the stellar population parameters of our galaxies we build on our forward modeling technique described in Estrada-Carpenter et al. 2019, previously applied solely to WFC3/G102 grism data. We use Flexible Stellar Population Synthesis (FSPS) models (Conroy & Gunn 2010, e.g.,), using a combination of MILeS and BaSeL libraries and assuming a Kroupa initial mass function (Kroupa 2001), to fit our SEDs.
We have updated our methodology to use the dynamic nested sampling algorithm engine from Dynesty (Speagle 2019). This allows us to model additional parameters, and take advantage of improvements in computational speed and parallelization. Dynesty allows us to include additional (nuisance) parameters to handle possible systematics which arise when fitting the two spectroscopic data sets (deep G102 and shallow G141 grism spectra) and broadband photometry simultaneously. We include a parameter allowing for an additional linear slope applied to the grism data (to account for corrections to the contamination subtraction). We also introduce parameters to account for correlated noise terms in the grism data described in Carnall et al. 2019. Our methods will be described fully in a future paper (V. Estrada-Carpenter et al. in prep), where we will apply this method to the full CLEAR sample to study the co-evolution of star-forming and quiescent galaxies.
Here we applied this method to all the quiescent galaxies in our parent sample (Section 2.1). We use the WFC3 G102 + G141 data, and broad-band photometry (see Section 2).
In this study we focus on the SFHs of quiescent galaxies at . We adopt a “non-parameteric" SFH parameterization (Leja et al. 2019), which include parameters to describe the SFR in 10 time bins and allows for much greater flexibility in the SFHs. The time bins are wider at larger look-back times (further in the past), except for the last (oldest) time bin, which is slightly smaller to allow for more dynamic range in the SFH. We allowed the time spanned by the full SFH to vary (however the fractional amount of time spanned in each time bin is fixed, see discussion in Leja et al. 2019).
Our full stellar population models have 23 fitted parameters: metallicity (), age, SFH (10 total parameters), redshift, dust attenuation (assuming a Milky Way model (Cardelli et al. 1989)), stellar mass (), and 8 nuisance parameters (1 tilt parameter and 3 correlated noise parameters for each of the two grism spectra). The choice of prior on the SFH is important (as each prior has its own systematics), and should be motivated by properties of the sample. We use the continuity prior for our SFHs, as this has the effect of weighting towards SFHs that evolve more smoothly (Leja et al. 2019, see discussion in Section 2.2.3,).
We then applied this method to all the quiescent galaxies in our parent sample (defined in Section 2.1) using the WFC3 G102+G141 grism data and the broad-band photometry in these fields (see Section 2). For each galaxy, we derive posteriors on each parameter in the model. To generate constraints on our SFHs, we randomly draw from the posteriors generating 5000 realizations of the SFH, we then derive the median SFH and 68%-tile range. Figure 2 shows examples of fits and constraints on the SFHs for three galaxies in our sample. For each galaxy, we show 1000 individual SFH draws, the median SFH, and the 68%-tiles. Each case in this figure illustrates galaxies with qualitatively different SFHs, including one galaxy with evidence of early formation and rapid quenching (GSD 39170), one with evidence for early formation with a slowly declining SFR (GND 21156), one with evidence for a early, nearly constant SFR, followed by slow quenching (GSD 40862), and one with what is possibly a burst of star-formation at a look-back time of 0.5 Gyr (GSD 24569). These are characteristic of the galaxies in our sample. In addition, we provide with this Paper an interactive appendix with the fits and constraints on all the galaxies in our sample, see the information and hyperlink in Appendix B.
We define the “formation” redshift, , of a galaxy by integrating the SFH to the redshift where the galaxy had formed 50% of its stellar mass. We define the 68%-tile on from the SFH using the highest density region (Bailer-Jones et al. 2018, the smallest region that contains 68% of the probability density,). The constraints on are illustrated for the three galaxies in Figure 2.

To understand to what extent the galaxy photometric or spectroscopic features are driving these differences in formation redshift, we inspected a subsample of galaxies at redshifts 0.9 1.1. We limit our sample to this redshift interval so that our SFHs will have similar look-back times and the data will have similar features present in the spectra. We then split this sample into “early” forming galaxies ( 2.9) and “late” forming galaxies ( 2.9), normalize the data at rest-frame Å, and stack them (Figure 3).
Figure 3 shows that the “late” forming galaxies exhibit a flux excess at Å, which increases into the rest-UV. The gradient is largest around the 4000 Å-break in the ratio of the grism data (around the G+H feature), implying younger stellar populations exist in the “late-forming” subsample. This is borne out in an inspection of other features as well. For example, the ratio shows “negative” fluctuations at the locations of all the Balmer lines (H, H, H, and (possibly) H). This is consistent with the differences in the subsamples being stellar populations with ages of Gyr, where we expect such absorption to be strongest (i.e., dominated by A-type stars). Furthermore, the stacked SFHs of the subsamples (inset panel in Figure 3) show that the “early” forming galaxies have high SFRs at early times, peaking at , followed by a relatively steep decline. In comparison the “late” forming galaxies show more extended star formation that peaks at followed by a gradual decline. We conclude the excess flux density in the data at rest-frame UV/blue wavelengths drive the fits to require more recent star formation in the “late” forming galaxies compared to the “early” forming galaxies.
III.2 Measuring Compactness
We parameterize galaxy compactness using the stellar mass density within 1 pkpc (proper kpc), (Fang et al. 2013, e.g.). has advantages for quantifying compactness as it uses information about the total surface-brightness profile and is less sensitive to uncertainties and correlations in quantities such as Sersic index () and effective radius, , (Lee et al. 2018). Furthermore, using is less susceptible to color gradients that can impact quantities such as the half-light radius (Szomoru et al. 2013; Suess et al. 2019, e.g.,).
We define using the measured (total) stellar mass and the measured surface-brightness profile,
| (2) |
where is the Sérsic profile measured in bandpass from van der Wel et al. 2014. The ratio of the integrals measures the fraction of light within 1 pkpc compared to the total light. The ratio corrects for differences in the total magnitude from the GALFIT fits and the measured total photometry. is the total stellar mass from our fits. To account for changes in rest-frame wavelength, we use the surface-brightness profile measured in the WFC3/F125 () bandpass for galaxies at and those measured in the WFC3/F160W () bandpass for galaxies at (van der Wel et al. 2014, see).

Figure 4 shows the relation between the effective radii (major axis) and stellar masses for the galaxies in our samples (i.e., the size-mass relation). The size (hue) of the data points are scaled by the () values. Galaxies with the largest (highest compactness) tend to sit at the high-mass/low-size end of the distribution. This is to be expected as is derived based on both the stellar mass and the surface-brightness profiles (which depends on ). Furthermore, we see no significant correlation between and (the redshift measured from our WFC3/G102 + G141 grism data): galaxies with the highest (and lowest) among our sample span a range of observed redshift.
IV Results
IV.1 Compact Galaxy Formation
Figure 5a shows the main result of our study: galaxies with compact stellar mass surface brightnesses 10.25 favor almost exclusively earlier values (). Among the subsample of objects that fall in this “ultra-compact” region (defined by 10.25) there are no examples of galaxies with lower formation redshifts. Recall that all the galaxies in Figure 5 are classified as “quiescent” using the same () selection criteria, and have no explicit selection by galaxy morphology. Therefore, it is striking that the SFHs of the most compact galaxies, as defined by , disfavor low formation redshifts, . We find the same conclusion if we define “quiescent” using a selection of sSFR yr-1.
Figure 5b reinforces the observation that the stellar mass surface density, , is related to the formation epoch . Here we smooth as a function of using locally weighted scatterplot smoothing (LOWESS) and see that the relationship monotonically rises as a function of compactness. Figure 5c shows that the standard deviation in of the sample changes as a function of compactness (using LOWESS as well), reinforcing that the dynamic range of is dependent on .
Figure 5d shows as a function of using LOWESS. Galaxies with higher stellar masses do tend to have earlier than lower mass galaxies, though this relationship seems to plateau for , where increases more slowly for increasing stellar mass (). In contrast, there is a steeper relation between and : for . Therefore, while is correlated with both stellar mass and stellar-mass surface density, the trend is stronger with the latter.
The preference for early formation of the most compact galaxies does not appear to be due to redshift selection effects. The galaxies in our sample do span a range of observed redshift, and if there is a correlation between observed redshift and formation redshift, then this could account for our findings. Figure 5e shows this is not the case. The distribution of for quiescent galaxies shows that the more compact quiescent galaxies tend towards higher formation redshifts, . This separation is most pronounced for redshifts (Figure 5e). At higher redshifts, , there is no difference in the distribution of and observed redshift. A larger sample of high redshift galaxies would be necessary to see if the separation observed at extends to higher redshift.
We also considered (and rejected) the possibility that our values are dependent on color gradients. For the sample with we recalculated using the –band surface-brightess profile fits (van Dokkum et al. 2014, from). The values change by 5% implying the stellar surface densities for pkpc are robust to color gradients observed to affect the effective radii of galaxies (Szomoru et al. 2013; Suess et al. 2019, e.g.,).
There is also no apparent bias between and SFH. The derivation of SFH constraints and the measurement of are almost entirely independent. The stellar-mass surface density stems from the morphological surface brightness profile. While the morphological profile can affect the spectroscopic resolution of the HST/WFC3 grisms (van Dokkum et al. 2011; Estrada-Carpenter et al. 2019, galaxies with more compact morphologies have higher resolution, see), this is mild for the galaxies in our sample (the spectroscopic resolution changes by a factor of ). Moreover, as shown in Figure 3 the differences in the spectral energy distributions of “early” and “late” forming galaxies extends through the full broadband photometry. Therefore, our results show that ultra-compact massive quiescent galaxies had at least 50% of their stellar-mass in-place at .

IV.2 Quenching Timescales
The main question that arises from our results is what specific properties of galaxies drive the lack of ultracompact quiescent galaxies with 3? There are measurable differences in the SFHs of galaxies as a function of . Figure 6a shows the mean SFHs for all galaxies with as a function of . In this figure, each curve corresponds to the mean SFH within a 0.2 dex bin of centered on the value illustrated by the color bar. The peak SFR increases with , and the shape of the SFH varies with . Galaxies with lower have a flatter overall shape to their SFHs with a more gradual decline in SFR.
These differences in the SFH with for the galaxies are evident in the time evolution of the cumulative fraction of stellar mass, illustrated in Figure 6b. Qualitatively, both Figures 6a and B show that galaxies with the largest stellar-mass surface densities () formed their stellar mass more rapidly and at earlier times compared to galaxies with lower .
We can quantify this point by defining a “quenching timescale”, , as the time (in Gyr) needed for the SFH to form 50% of the mass to 90% of the mass (, illustrated in Figure 6b). Figure 6c shows the values as a function of for the galaxies with , with errors derived from bootstrapping. There is an apparent (anti-)correlation between stellar-mass surface density, and quenching timescale, . Galaxies at lower () have Gyr. In contrast, galaxies with the highest stellar mass surface density ( have shorter quenching times, with Gyr. The faster quenching timescales of the ultra-compact () sub-sample indicates that these galaxies have an overall more rapid SFH with faster quenching (shorter ).
V Discussion
The main finding of our study of the broad-band photometry and HST/WFC3 grism spectroscopy of quiescent galaxies at is that they show evidence for a relation between their SFHs (e.g., formation redshifts, ), and their morphologies parameterized by their stellar-mass surface density within 1 (proper) kpc, (Figure 5). Galaxies with high , ( 10), typically have higher values, where ultra-compact galaxies with all have . They are "early forming". Less compact galaxies () on the whole have lower average formation redshifts, but they span a wide range, . Galaxies with higher show SFHs that have higher peak SFRs at earlier times, with more rapid quenching times. Both the shorter quenching times and earlier values for ultracompact galaxies suggests that these properties are a symptom of the physics related to galaxy quenching.
V.1 Our Results in Context
Our findings reinforce some earlier studies (Tacchella et al. 2017; Williams et al. 2017; Lee et al. 2018; Wu et al. 2018, e.g.,), which found evidence of older ages in compact galaxies when compared to extended galaxies. Likewise, some studies found that compact galaxies also show evidence of quenching more rapidly (Barro et al. 2013; Barro et al. 2017; Nogueira-Cavalcante et al. 2019). In addition, many of our galaxies have relatively high formation redshifts (), suggesting they may be the descendants of quenched galaxies recently identified at high redshift () (Spitler et al. 2014; Straatman et al. 2014; Marsan et al. 2015; Glazebrook et al. 2017; Schreiber et al. 2018a; Tanaka et al. 2019; Forrest et al. 2019; Valentino et al. 2020, e.g.,). Indeed, quiescent galaxy candidates at have very compact sizes (Straatman et al. 2015), consistent with idea that these galaxies have high and could be among the progenitors of the early-forming galaxies in our sample.
Our conclusions depend on the reliability of the SFH constraints. To gauge this, we compared our results to other studies of massive galaxies at similar redshifts. These broadly show a correlation between stellar mass, and shorter, more intense formation periods at higher redshift (Pacifici et al. 2016; Schreiber et al. 2018a; Carnall et al. 2019; Morishita et al. 2019). Our results are in line with these studies, where we do see a trend between and stellar mass (Figure 5d).
V.2 Implications for the Evolutionary Paths of Quiescent Galaxies
A key new result is evidence for a trend between (increasing) stellar-mass surface density, , and (higher) formation redshift, , for galaxies in our sample. The “early-forming” galaxies () have quenching timescales () that decrease with increasing (Figure 6).
V.2.1 On the Origin of Early-Forming Galaxies with High
The origin of galaxies with high stellar mass surface density () at higher is expected as a consequence of the gravitational collapse of galaxies at high redshift (to overcome the cosmic background density, e.g., Wellons et al. 2015; Lilly & Carollo 2016). Wellons et al. 2015 show simulations where the earliest forming quiescent galaxies achieve central stellar densities of by .
Other explanations for high seem less likely. Mergers seem insufficient as major mergers are expected to leave roughly unchanged, while minor mergers can decrease (see Bezanson et al. 2009 and below). These galaxies are also unlikely to be the product of the “compaction” (Dekel et al. 2009; Barro et al. 2013, e.g.,) or from gas-rich mergers (Wellons et al. 2015, e.g.,). These processes should be more frequent at later times, where we do not observe any galaxy with and . Compaction events or major gas-rich mergers for these galaxies are either rare or are unable increase the mass surface density to .
V.2.2 On the Origin of Early-Forming Galaxies with Low
There are two possibilities to explain the existence of galaxies with both high formation redshift () and lower (). These galaxies could form with intrinsically lower , but this is unexpected given the arguments above. Alternatively, these galaxies may form the bulk () of their stellar populations at with high , but then experience evolution that reduces . This could come from the adiabatic expansion through mass losses from late stages of stellar evolution (van Dokkum et al. 2014; Barro et al. 2017, e.g.). However, this becomes more efficient at later times, and there is only 4 Gyr between and for this to manifest. Wellons et al. 2015 show the central density within 1 kpc of an early-forming compact quiescent galaxy at declines by dex by . Furthermore, it is unclear why this affects only some of the ultracompact galaxies when stellar evolution should impact all.
One important clue comes from the correlation between (longer) quenching times, , and (decreasing) . The early-forming galaxies (with ) and lower () have longer quenching times, compared to galaxies with (see Figure 6c). An explanation for this correlation is that all early-forming massive galaxies begin with high . Galaxies then experience a unique assembly history, where the frequency, orbital configuration, and distribution of mass-ratios of mergers and accretion events dictates the change in . Bezanson et al. 2009 show minor mergers (mass ratios 1:10) can decrease , while major mergers (mass ratios greater than 1:4) leave mostly unchanged.
Minor mergers involve high-mass and low-mass systems. The latter have more prolonged SFHs (see Section V.1). We tested how this would impact the formation times (corresponding to ) and the quenching time using a series of simulations. We simulated galaxy SFHs as “delayed-” models (Estrada-Carpenter et al. 2019, e.g.,) using the correlations between SFH and stellar mass (see above). We then randomly “merged” galaxies of different mass ratios, summing their SFHs to simulate the effects of mergers on the integrated SFH. Figure 6d shows the results. Major mergers have little effect on neither nor , which change by 0.25 Gyr (recall that ). Minor mergers, on the other hand, have little effect on (change by 0.2 Gyr) but can extend the SFHs with an increase in , making longer with a scatter of up to 2 Gyr. Therefore, minor mergers provide a mechanism to increase the scatter in with only a small change in (the redshift corresponding to ), and decrease (Bezanson et al. 2009), which is consistent with the observations.
V.3 On the lack of “Early-Forming” Galaxies at low-redshift
Figure 5e shows an absence of quiescent galaxies at lower observed redshifts () and early formation times, . We considered several reasons that could explain this absence, some systematic to the data/analysis and others physical.
One potential systematic reason (which we ultimately reject) could be that galaxies at lower redshifts lack (grism) spectroscopic coverage in the rest-frame UV, and this could limit our ability to constrain the current SFRs in those cases. The WFC3 G102 grism covers 0.8 m, corresponding to 4000 Å in the rest-frame for galaxies. We therefore tested if this could limit our ability to identify objects with early star-formation at these observed redshifts. We simulated the spectral energy distribution of a quiescent galaxy at with early quenching, with . We then perturbed the photometry and grism data for this object by the measured uncertainties, and repeated the model fitting using our procedures applied to the real CLEAR galaxies. In this case we reliably recover this value, within a 68 confidence interval of 0.15 Gyr. Therefore it appears that if galaxies at with existed in our dataset we would identify them as such.
One other systematic reason for the lack of objects with and could be that the CLEAR data sample a relatively small volume. For example, the comoving volume probed by our study is 8 times larger for than , and these objects with early formation and lower observed redshift may simply be rarer at these redshifts. Future studies using larger datasets should be able to test this systematic more fully.
Alternatively, the rarity of early-forming quiescent galaxies () at could be indicative of how these galaxies evolve. Building off the discussion above (Section V.2.2) we expect that quiescent galaxies grow in size through mergers, and this evolution depends on the galaxies’ individual assembly histories. Our toy model argues these mergers both lower and decrease and that the magnitude of both affects should grow with time. We therefore can predict that galaxies with early quenching observed at lower redshift would have lower (measured) and lower and this effect should become more pronounced with decreasing redshift.
Interestingly, our results support this interpretation. Figure 7 shows the relationship between formation age, , and observed redshift . Here, is the lookback time between the observed redshift and the formation redshift for each galaxy. In the figure we split our quiescent galaxies into samples of compact and extended based on or , respectively (see Figure 5). Both the compact and extended galaxies have similar evolution at : their quenching time, is (on average) roughly 1.5 Gyr delayed from the Big Bang (Glazebrook et al. 2017; Schreiber et al. 2018b; Forrest et al. 2019; Valentino et al. 2020, and this is consistent with the currently earliest known galaxies with older stellar populations,).
However, the trend between observed redshift and for the extended and compact quiescent galaxies diverges at observed redshifts of . Here the extended galaxies show lower (at fixed observed redshift) compared to the compact galaxies. This could be a result of the hypothesis that the extended galaxies have experienced more frequent growth due to minor mergers, causing a faster decrease in (making them “extended” as described in Section V.2.2) and in . However, the subsample of quiescent galaxies at in our sample remains small, and larger samples will be needed to confirm these trends.
VI Conclusions
In this paper we constrain the star-formation histories of quiescent galaxies at and correlate these with galaxy masses and morphologies, using “non-parametric” star-formation histories and a nested sampling algorithm. We derived constraints for the formation and quenching timescales for a sample of nearly 100 quiescent galaxies with deep HST grism spectroscopy and photometry from the CLEAR (CANDELS Lyman Emission at Reionization) survey. In addition to the results presented here, we provide in Appendix B a hyperlink to, and a description of, an online appendix that contains similar fits and information for all the galaxies in our sample. Our conclusions from this study are as follows.
- 1.
The galaxy formation redshifts, (defined as the point where they had formed 50% of their stellar mass) range from (shortly prior to the observed epoch) up to . We correlate the formation redshifts with the stellar-mass surface densities, , where is the stellar mass within a 1 pkpc (proper kpc).
- 2.
Quiescent galaxies with the highest stellar-mass surface density, , show a minimum formation redshift: all such objects in our sample have .
- 3.
Quiescent galaxies with lower surface density, , show a range of formation epochs (), implying these galaxies experienced a range of formation and assembly histories.
- 4.
We argue that the surface density threshold uniquely identifies galaxies that formed in the first few Gyr after the Big Bang
We then discuss the implications this has for galaxy formation and quenching. Based on our data, the ultracompact quiescent galaxies () appear to identify galaxies with early formation () and a lower fraction of mergers (at the time they are observed, see Section V.2.2). If these exist in the present Universe, they could be compact cores of galaxies. It could be instructive to identify objects with high density cores, and study their ages, abundances, and gradients. Additional simulations would be useful both to understand the formation and the evolution of these galaxies, and if later time processes (such as adiabatic expansion or mergers) destroy them. Alternatively, it may be that examples of these objects still exist in the present-day Universe. If so, the most compact passive galaxies today may host the oldest stellar populations and be the remnant of these bygone eras.
We favor the conclusion that stochasticity in the mergers/accretion history of lower-mass early-forming galaxies () explains the relation between the quenching timescale and stellar mass surface density: the lower () and longer quenching times ( Gyr) of these galaxies is a result of their history of (minor) mergers.
The formation redshift, (or age, ) can be reduced through subsequent evolution through minor mergers and this can lead to both galaxies with high and lower stellar-mass surface densities as well as account for the lack of observed galaxies at with early formation times (high ). The obvious caveat to this interpretation is that we have neglected the contribution of “progenitor bias” (van Dokkum et al. 1999, see, e.g.,) whereby newly quenched galaxies are continuously becoming “quiescent” at later times. As the more recently-quiescent galaxies will (by definition) have lower and likely have lower , they can also contribute to the trend seen between observed redshift and quenching time () in Figure 7 (Dekel et al. 2009; Barro et al. 2013; Wellons et al. 2015, though see, e.g.,). Ultimately, it is likely that both the effects of early formation plus minor mergers and progenitor bias are at work. This makes an interesting prediction that spatially resolved studies should see variations in the SFH (or possibly abundance histories) as a function of galactic radius in these galaxies. This may be testable with data from either the James Webb Space Telescope (JWST) or 25–30 m-class telescopes.
References
- Bailer-Jones et al. (2018) Bailer-Jones, C. A. L., Rybizki, J., Fouesneau, M., Mantelet, G., & Andrae, R. 2018, AJ, 156, 58
- Barro et al. (2013) Barro, G., Faber, S. M., Pérez-González, P. G., et al. 2013, ApJ, 765, 104
- Barro et al. (2017) Barro, G., Faber, S. M., Koo, D. C., et al. 2017, ApJ, 840, 47
- Belli et al. (2019) Belli, S., Newman, A. B., & Ellis, R. S. 2019, ApJ, 874, 17
- Bezanson et al. (2009) Bezanson, R., van Dokkum, P. G., Tal, T., et al. 2009, ApJ, 697, 1290
- Cardelli et al. (1989) Cardelli, J. A., Clayton, G. C., & Mathis, J. S. 1989, ApJ, 345, 245
- Carnall et al. (2019) Carnall, A. C., McLure, R. J., Dunlop, J. S., et al. 2019, MNRAS, 490, 417
- Conroy & Gunn (2010) Conroy, C., & Gunn, J. E. 2010, ApJ, 712, 833
- Daddi et al. (2010) Daddi, E., Elbaz, D., Walter, F., et al. 2010, ApJ, 714, L118
- Dahlen et al. (2013) Dahlen, T., Mobasher, B., Faber, S. M., et al. 2013, ApJ, 775, 93
- Dekel et al. (2009) Dekel, A., Sari, R., & Ceverino, D. 2009, ApJ, 703, 785
- Estrada-Carpenter et al. (2019) Estrada-Carpenter, V., Papovich, C., Momcheva, I., et al. 2019, ApJ, 870, 133
- Fang et al. (2013) Fang, J. J., Faber, S. M., Koo, D. C., & Dekel, A. 2013, ApJ, 776, 63
- Ferreras et al. (2019) Ferreras, I., Pasquali, A., Pirzkal, N., et al. 2019, MNRAS, 486, 1358
- Forrest et al. (2019) Forrest, B., Annunziatella, M., Wilson, G., et al. 2019, arXiv e-prints, arXiv:1910.10158
- Fumagalli et al. (2014) Fumagalli, M., Labbé, I., Patel, S. G., et al. 2014, ApJ, 796, 35
- Gallazzi et al. (2014) Gallazzi, A., Bell, E. F., Zibetti, S., Brinchmann, J., & Kelson, D. D. 2014, ApJ, 788, 72
- Gallazzi et al. (2005) Gallazzi, A., Charlot, S., Brinchmann, J., White, S. D. M., & Tremonti, C. A. 2005, MNRAS, 362, 41
- Glazebrook et al. (2017) Glazebrook, K., Schreiber, C., Labbé, I., et al. 2017, Nature, 544, 71
- Grogin et al. (2011) Grogin, N. A., Kocevski, D. D., Faber, S. M., et al. 2011, ApJS, 197, 35
- Häussler et al. (2007) Häussler, B., McIntosh, D. H., Barden, M., et al. 2007, ApJS, 172, 615
- Koekemoer et al. (2011) Koekemoer, A. M., Faber, S. M., Ferguson, H. C., et al. 2011, ApJS, 197, 36
- Kriek et al. (2015) Kriek, M., Shapley, A. E., Reddy, N. A., et al. 2015, The Astrophysical Journal Supplement Series, 218, 15
- Kriek et al. (2019) Kriek, M., Price, S. H., Conroy, C., et al. 2019, ApJ, 880, L31
- Kroupa (2001) Kroupa, P. 2001, MNRAS, 322, 231
- Lee et al. (2018) Lee, B., Giavalisco, M., Whitaker, K., et al. 2018, ApJ, 853, 131
- Leja et al. (2019) Leja, J., Carnall, A. C., Johnson, B. D., Conroy, C., & Speagle, J. S. 2019, ApJ, 876, 3
- Lilly & Carollo (2016) Lilly, S. J., & Carollo, C. M. 2016, ApJ, 833, 1
- Lonoce et al. (2015) Lonoce, I., Longhetti, M., Maraston, C., et al. 2015, MNRAS, 454, 3912
- Luo et al. (2017) Luo, B., Brandt, W. N., Xue, Y. Q., et al. 2017, The Astrophysical Journal Supplement Series, 228, 2
- Magnelli et al. (2011) Magnelli, B., Elbaz, D., Chary, R. R., et al. 2011, A&A, 528, doi:10.1051/0004-6361/200913941
- Man & Belli (2018) Man, A., & Belli, S. 2018, Nature Astronomy, 2, 695
- Marsan et al. (2015) Marsan, Z. C., Marchesini, D., Brammer, G. B., et al. 2015, ApJ, 801, 133
- Momcheva et al. (2016) Momcheva, I. G., Brammer, G. B., van Dokkum, P. G., et al. 2016, ApJS, 225, 27
- Morishita et al. (2019) Morishita, T., Abramson, L. E., Treu, T., et al. 2019, ApJ, 877, 141
- Nogueira-Cavalcante et al. (2019) Nogueira-Cavalcante, J. P., Gonçalves, T. S., Menéndez-Delmestre, K., de la Rosa, I. G., & Charbonnier, A. 2019, MNRAS, 484, 3022
- Pacifici et al. (2016) Pacifici, C., Kassin, S. A., Weiner, B. J., et al. 2016, ApJ, 832, 79
- Papovich et al. (2006) Papovich, C., Moustakas, L. A., Dickinson, M., et al. 2006, ApJ, 640, 92
- Papovich et al. (2015) Papovich, C., Labbé, I., Quadri, R., et al. 2015, ApJ, 803, 26
- Peng et al. (2002) Peng, C. Y., Ho, L. C., Impey, C. D., & Rix, H.-W. 2002, AJ, 124, 266
- Pirzkal et al. (2017) Pirzkal, N., Malhotra, S., Ryan, R. E., et al. 2017, ApJ, 846, 84
- Santini et al. (2017) Santini, P., Fontana, A., Castellano, M., et al. 2017, ApJ, 847, 76
- Schreiber et al. (2018a) Schreiber, C., Glazebrook, K., Nanayakkara, T., et al. 2018a, A&A, 618, A85
- Schreiber et al. (2018b) Schreiber, C., Labbé, I., Glazebrook, K., et al. 2018b, A&A, 611, A22
- Skelton et al. (2014) Skelton, R. E., Whitaker, K. E., Momcheva, I. G., et al. 2014, ApJS, 214, 24
- Speagle (2019) Speagle, J. S. 2019, arXiv e-prints, arXiv:1904.02180
- Spitler et al. (2014) Spitler, L. R., Straatman, C. M. S., Labbé, I., et al. 2014, ApJ, 787, L36
- Straatman et al. (2014) Straatman, C. M. S., Labbé, I., Spitler, L. R., et al. 2014, ApJ, 783, L14
- Straatman et al. (2015) Straatman, C. M. S., Labbé, I., Spitler, L. R., et al. 2015, ApJ, 808, L29
- Straatman et al. (2016) Straatman, C. M. S., Spitler, L. R., Quadri, R. F., et al. 2016, ApJ, 830, 51
- Suess et al. (2019) Suess, K. A., Kriek, M., Price, S. H., & Barro, G. 2019, ApJ, 885, L22
- Szomoru et al. (2013) Szomoru, D., Franx, M., van Dokkum, P. G., et al. 2013, ApJ, 763, 73
- Tacchella et al. (2017) Tacchella, S., Carollo, C. M., Faber, S. M., et al. 2017, ApJ, 844, L1
- Tanaka et al. (2019) Tanaka, M., Valentino, F., Toft, S., et al. 2019, ApJ, 885, L34
- Thomas et al. (2005) Thomas, D., Maraston, C., Bender, R., & Mendes de Oliveira, C. 2005, ApJ, 621, 673
- Valentino et al. (2020) Valentino, F., Tanaka, M., Davidzon, I., et al. 2020, ApJ, 889, 93
- van der Wel et al. (2014) van der Wel, A., Franx, M., van Dokkum, P. G., et al. 2014, ApJ, 788, 28
- van Dokkum et al. (1999) van Dokkum, P. G., Franx, M., Fabricant, D., Kelson, D. D., & Illingworth, G. D. 1999, ApJ, 520, L95
- van Dokkum et al. (2011) van Dokkum, P. G., Brammer, G., Fumagalli, M., et al. 2011, ApJ, 743, L15
- van Dokkum et al. (2014) van Dokkum, P. G., Bezanson, R., van der Wel, A., et al. 2014, ApJ, 791, 45
- Wellons et al. (2015) Wellons, S., Torrey, P., Ma, C.-P., et al. 2015, MNRAS, 449, 361
- Whitaker et al. (2012) Whitaker, K. E., Kriek, M., van Dokkum, P. G., et al. 2012, ApJ, 745, 179
- Whitaker et al. (2011) Whitaker, K. E., Labbé, I., van Dokkum, P. G., et al. 2011, ApJ, 735, 86
- Whitaker et al. (2013) Whitaker, K. E., van Dokkum, P. G., Brammer, G., et al. 2013, ApJ, 770, L39
- Williams et al. (2017) Williams, C. C., Giavalisco, M., Bezanson, R., et al. 2017, ApJ, 838, 94
- Wu et al. (2018) Wu, P.-F., van der Wel, A., Gallazzi, A., et al. 2018, ApJ, 855, doi:10.3847/1538-4357/aab0a6
- Xue et al. (2016) Xue, Y. Q., Luo, B., Brandt, W. N., et al. 2016, ApJS, 224, 15


Appendix A Data Tables
We report here the catalog for the galaxies in the sample used here. These include two tables. Table 3 reports values for each galaxy derived without the analysis of the grism data (including galaxy ID numbers, coordinates, photometric redshift, photometric masses, and circularized radii). Table 3 reports values derived from our fits to the photometry and grism data here (including redshifts, masses, specific star-formation rates, dust attenuations, stellar-mass surface densities, quenching timescales, and formation redshifts).
Appendix B Interactive Online Model Fits for the Galaxy Sample
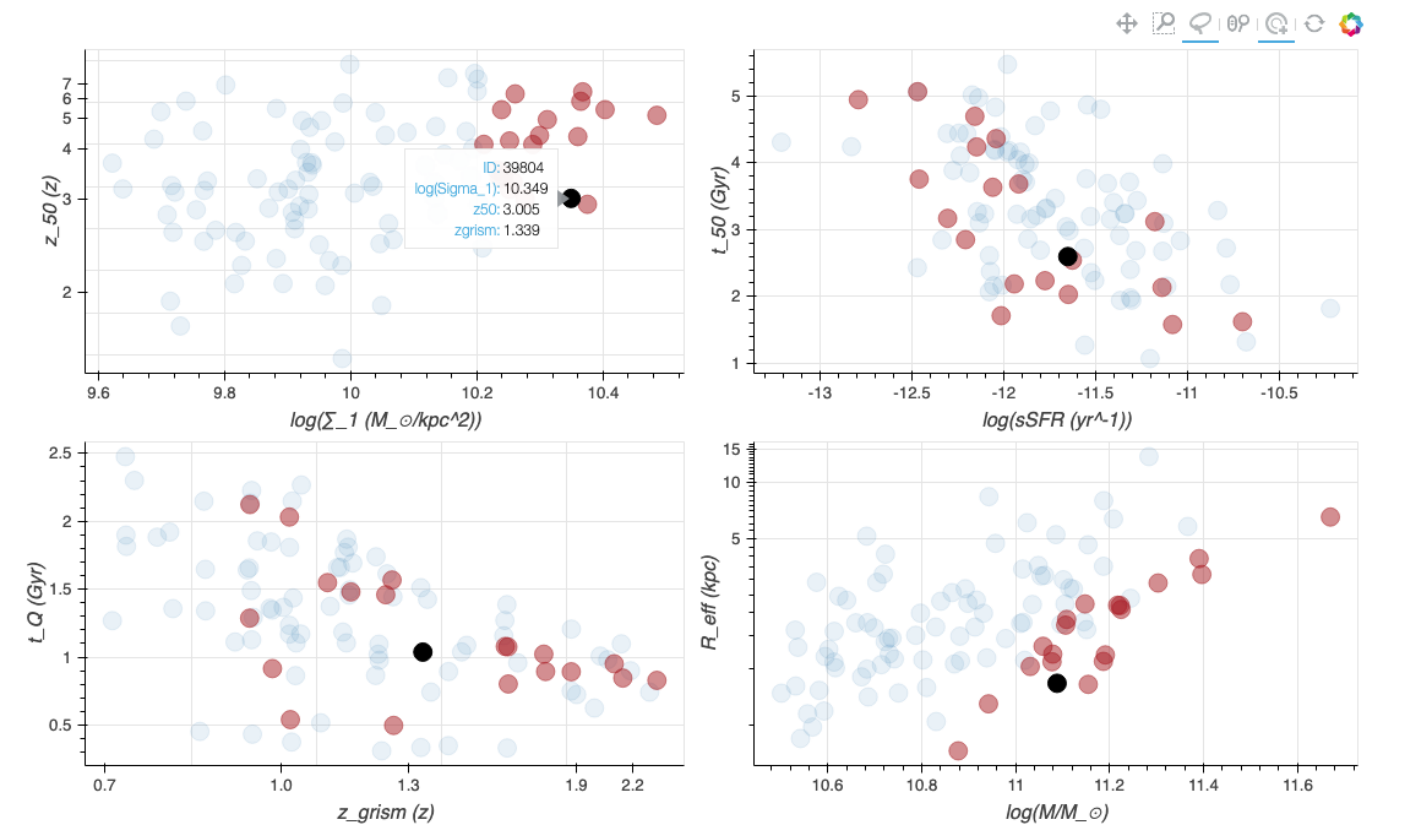
We include with this paper an interactive appendix, which shows the properties and model fits for all the galaxies in our sample. The appendix is available here: interactive online appendix33 3 Also available at https://vince-ec.github.io/appendix/appendix. At this link the reader can see galaxy properties on multiple plots simultaneously (Figure 8), and also access individual galaxy morphology, photometric and spectroscopic data and model fits (Figure 9). The user can interact with the star-formation history, and spectral energy distribution. The online material also includes a hyperlink to show all galaxy SFHs and morphologies ordered by 44 4 Also available at https://vince-ec.github.io/appendix/fullfig on a single figure (Figure 10).
| ID | RA | DEC | |||
|---|---|---|---|---|---|
| (deg, J2000) | (deg, J2000) | (kpc) | |||
| (1) | (2) | (3) | (4) | (5) | (6) |
| GND-29879 | 189.254227 | 62.291579 | 10.9 | ||
| GSD-41147 | 53.081634 | -27.717718 | 10.8 | ||
| GSD-47140 | 53.131853 | -27.687304 | 10.8 | ||
| GSD-46001 | 53.120312 | -27.691486 | 11.2 | ||
| GND-27006 | 189.263714 | 62.275807 | 10.8 | ||
| GND-22358 | 189.081040 | 62.251545 | 10.7 | ||
| GND-36838 | 189.251622 | 62.344526 | 10.8 | ||
| GND-37186 | 189.243199 | 62.349892 | 11.0 | ||
| GND-13774 | 189.179829 | 62.211733 | 11.1 | ||
| GND-32108 | 189.277164 | 62.305097 | 10.7 | ||
| GND-23459 | 189.310355 | 62.258286 | 11.0 | ||
| GND-24795 | 189.202555 | 62.264622 | 10.9 | ||
| GND-14158 | 189.192218 | 62.212927 | 10.6 | ||
| GND-29183 | 189.245464 | 62.287267 | 10.6 | ||
| GND-24177 | 189.343191 | 62.262053 | 11.0 | ||
| GND-23081 | 189.334875 | 62.255800 | 11.2 | ||
| GND-22213 | 189.201365 | 62.252076 | 11.2 | ||
| GND-33453 | 189.264307 | 62.314325 | 10.7 | ||
| GND-23758 | 189.217983 | 62.260352 | 11.2 | ||
| GND-22246 | 189.220896 | 62.252424 | 11.1 | ||
| GND-26673 | 189.279210 | 62.274483 | 10.8 | ||
| GND-27951 | 189.226202 | 62.281984 | 11.1 | ||
| GND-37340 | 189.289100 | 62.352859 | 11.0 | ||
| GND-12793 | 189.236022 | 62.205604 | 10.9 | ||
| GSD-38191 | 53.141108 | -27.732652 | 10.7 | ||
| GSD-39850 | 53.173100 | -27.724355 | 10.7 | ||
| GND-36161 | 189.201410 | 62.336077 | 10.7 | ||
| GSD-19148 | 53.164983 | -27.819326 | 11.5 | ||
| GND-22363 | 189.169647 | 62.251296 | 10.7 | ||
| GND-27185 | 189.242059 | 62.277510 | 11.2 | ||
| GSD-42221 | 53.079234 | -27.711869 | 10.8 | ||
| GND-16758 | 189.162357 | 62.224840 | 11.1 | ||
| GND-12078 | 189.166744 | 62.202054 | 10.7 | ||
| GSD-39170 | 53.041826 | -27.725868 | 11.4 | ||
| GSD-43615 | 53.093057 | -27.707368 | 10.9 | ||
| GND-22633 | 189.161700 | 62.252923 | 10.7 | ||
| GSD-39241 | 53.042327 | -27.726209 | 11.1 | ||
| GSD-39631 | 53.042169 | -27.725928 | 11.0 | ||
| GND-37955 | 189.337824 | 62.371137 | 11.0 | ||
| GND-37210 | 189.252761 | 62.350806 | 11.2 | ||
| GSD-45972 | 53.115984 | -27.693568 | 11.1 | ||
| GSD-44620 | 53.249645 | -27.702048 | 10.7 | ||
| GSD-29928 | 53.154965 | -27.768904 | 11.7 | ||
| GND-30358 | 189.299204 | 62.293310 | 10.6 | ||
| GND-23857 | 189.070894 | 62.259299 | 10.6 | ||
| GSD-47691 | 53.273156 | -27.681599 | 11.2 | ||
| GND-21724 | 189.063257 | 62.248675 | 11.0 | ||
| GND-37325 | 189.251371 | 62.351582 | 10.6 | ||
| GND-22027 | 189.065790 | 62.249816 | 10.9 | ||
| GND-34694 | 189.147840 | 62.323647 | 11.1 | ||
| GND-38102 | 189.339219 | 62.375874 | 10.7 | ||
| GND-28451 | 189.247715 | 62.282931 | 10.7 | ||
| GND-20432 | 189.362767 | 62.242309 | 11.1 | ||
| GND-17746 | 189.049436 | 62.228979 | 11.1 | ||
| GSD-39805 | 53.163237 | -27.724724 | 10.8 | ||
| GSD-40476 | 53.108262 | -27.721924 | 10.9 | ||
| GSD-37828 | 53.158121 | -27.734502 | 10.7 | ||
| GSD-40597 | 53.148451 | -27.719472 | 11.4 | ||
| GND-34419 | 189.311828 | 62.320264 | 10.8 | ||
| GND-13191 | 189.217041 | 62.207326 | 10.8 | ||
| GND-14713 | 189.236333 | 62.214608 | 10.8 | ||
| GND-17070 | 189.268086 | 62.226445 | 11.3 | ||
| GSD-38785 | 53.168249 | -27.727300 | 11.1 | ||
| GND-21156 | 189.239409 | 62.247548 | 11.4 | ||
| GSD-35774 | 53.158775 | -27.742385 | 11.3 | ||
| GND-37686 | 189.274474 | 62.360820 | 11.2 | ||
| GSD-40862 | 53.048020 | -27.719743 | 11.2 | ||
| GSD-46066 | 53.061039 | -27.693501 | 11.2 | ||
| GSD-39804 | 53.178423 | -27.724640 | 11.2 | ||
| GSD-45775 | 53.158558 | -27.694968 | 11.4 | ||
| GND-36530 | 189.275620 | 62.340723 | 11.1 | ||
| GSD-40623 | 53.130480 | -27.721152 | 11.1 | ||
| GND-24345 | 189.244758 | 62.261225 | 10.6 | ||
| GND-16574 | 189.233886 | 62.223678 | 10.7 | ||
| GND-21427 | 189.368121 | 62.247344 | 11.0 | ||
| GSD-40223 | 53.124956 | -27.722957 | 11.0 | ||
| GSD-39649 | 53.059630 | -27.725792 | 10.9 | ||
| GSD-42487 | 53.116396 | -27.712701 | 11.0 | ||
| GSD-38843 | 53.107039 | -27.729749 | 10.6 | ||
| GSD-39012 | 53.064240 | -27.727621 | 11.3 | ||
| GSD-41520 | 53.152726 | -27.716251 | 11.2 | ||
| GSD-44042 | 53.104570 | -27.705421 | 11.4 | ||
| GND-33775 | 189.188648 | 62.315319 | 10.7 | ||
| GSD-42615 | 53.127414 | -27.712062 | 11.2 | ||
| GSD-41148 | 53.127925 | -27.718885 | 11.4 | ||
| GND-33780 | 189.202025 | 62.317153 | 11.6 | ||
| GND-17735 | 189.060905 | 62.228977 | 11.1 | ||
| GND-19850 | 189.090085 | 62.239244 | 10.9 | ||
| GSD-24569 | 53.158798 | -27.797153 | 11.0 | ||
| GSD-24315 | 53.162991 | -27.797654 | 10.7 | ||
| GND-14132 | 189.190249 | 62.211662 | 11.1 | ||
| GSD-43572 | 53.142153 | -27.707427 | 11.2 | ||
| GND-21738 | 189.210937 | 62.248818 | 11.4 | ||
| GND-32933 | 189.156358 | 62.309106 | 10.7 | ||
| GND-17599 | 189.121464 | 62.228903 | 11.0 | ||
| GSD-44133 | 53.110407 | -27.703706 | 10.4 | ||
| GND-23018 | 189.277544 | 62.254617 | 11.3 | ||
| GSD-48464 | 53.144819 | -27.682470 | 11.4 |
Note. — (1) catalog ID number (matching those in Skelton et al. 2014); (2) right ascension; (3) declination; (4) photometric redshift; (5) stellar mass from Eazy-py; (6) circularized effective radius (derived from van der Wel et al. 2014 and defined as r, where is the radius of the semi-major axis in kpc, is the axis ratio)
| ID | sSFR | ||||||
|---|---|---|---|---|---|---|---|
| (mag) | (Gyr) | ||||||
| (1) | (2) | (3) | (4) | (5) | (6) | (7) | (8) |
| GND-29879 | |||||||
| GSD-41147 | |||||||
| GSD-47140 | |||||||
| GSD-46001 | |||||||
| GND-27006 | |||||||
| GND-22358 | |||||||
| GND-36838 | |||||||
| GND-37186 | |||||||
| GND-13774 | |||||||
| GND-32108 | |||||||
| GND-23459 | |||||||
| GND-24795 | |||||||
| GND-14158 | |||||||
| GND-29183 | |||||||
| GND-24177 | |||||||
| GND-23081 | |||||||
| GND-22213 | |||||||
| GND-33453 | |||||||
| GND-23758 | |||||||
| GND-22246 | |||||||
| GND-26673 | |||||||
| GND-27951 | |||||||
| GND-37340 | |||||||
| GND-12793 | |||||||
| GSD-38191 | |||||||
| GSD-39850 | |||||||
| GND-36161 | |||||||
| GSD-19148 | |||||||
| GND-22363 | |||||||
| GND-27185 | |||||||
| GSD-42221 | |||||||
| GND-16758 | |||||||
| GND-12078 | |||||||
| GSD-39170 | |||||||
| GSD-43615 | |||||||
| GND-22633 | |||||||
| GSD-39241 | |||||||
| GSD-39631 | |||||||
| GND-37955 | |||||||
| GND-37210 | |||||||
| GSD-45972 | |||||||
| GSD-44620 | |||||||
| GSD-29928 | |||||||
| GND-30358 | |||||||
| GND-23857 | |||||||
| GSD-47691 | |||||||
| GND-21724 | |||||||
| GND-37325 | |||||||
| GND-22027 | |||||||
| GND-34694 | |||||||
| GND-38102 | |||||||
| GND-28451 | |||||||
| GND-20432 | |||||||
| GND-17746 | |||||||
| GSD-39805 | |||||||
| GSD-40476 | |||||||
| GSD-37828 | |||||||
| GSD-40597 | |||||||
| GND-34419 | |||||||
| GND-13191 | |||||||
| GND-14713 | |||||||
| GND-17070 | |||||||
| GSD-38785 | |||||||
| GND-21156 | |||||||
| GSD-35774 | |||||||
| GND-37686 | |||||||
| GSD-40862 | |||||||
| GSD-46066 | |||||||
| GSD-39804 | |||||||
| GSD-45775 | |||||||
| GND-36530 | |||||||
| GSD-40623 | |||||||
| GND-24345 | |||||||
| GND-16574 | |||||||
| GND-21427 | |||||||
| GSD-40223 | |||||||
| GSD-39649 | |||||||
| GSD-42487 | |||||||
| GSD-38843 | |||||||
| GSD-39012 | |||||||
| GSD-41520 | |||||||
| GSD-44042 | |||||||
| GND-33775 | |||||||
| GSD-42615 | |||||||
| GSD-41148 | |||||||
| GND-33780 | |||||||
| GND-17735 | |||||||
| GND-19850 | |||||||
| GSD-24569 | |||||||
| GSD-24315 | |||||||
| GND-14132 | |||||||
| GSD-43572 | |||||||
| GND-21738 | |||||||
| GND-32933 | |||||||
| GND-17599 | |||||||
| GSD-44133 | |||||||
| GND-23018 | |||||||
| GSD-48464 |
Note. — (1) catalog ID number (matching those in Skelton et al. 2014) and line-matched to those in Table 3; All other quantities are derived from the model fits to the full grism and photometric dataset. (2) redshift; (3) stellar mass; (4) specific star-formation rate (where the SFR is the time averaged over the previous 100 Myr of the SFH); (5) dust attenuation value for a Milky Way dust law; (6) stellar mass surface density within 1 kpc, ; (7) quenching timescale defined as - , the difference between the time when the galaxy had formed 50% () and 90% () of its stellar mass; (8) formation redshift (where the galaxy had formed 50% of its stellar mass); Note that we are using a highest density region to estimate our parameter fits, this reports the mode and smallest region containing 68 of the probability (Bailer-Jones et al. 2018). Therefore if the mode of the probability distribution function is peaked at the bounds on the parameter, then the uncertainty will also be zero beyond that bound. This is the case for some values of , for example, where the mode of the distribution function is =0.0 mag (and the lower 68%-tile uncertainty is likewise 0.0 mag).