Characterising DNA T-motifs by Simulation and Experiment
Abstract
The success of DNA nanotechnology has been driven by the discovery of novel structural motifs with a wide range of shapes and uses. We present a comprehensive study of the T-motif, a 3-armed, planar, right-angled junction that has been used in the self-assembly of DNA polyhedra and periodic structures. The motif is formed through the interaction of a bulge loop in one duplex and a sticky end of another. The polarity of the sticky end has significant consequences for the thermodynamic and geometrical properties of the T-motif: different polarities create junctions spanning different grooves of the duplex. We compare experimental binding strengths with predictions of oxDNA, a coarse-grained model of DNA, for various loop sizes. We find that, although both sticky-end polarities can create stable junctions, junctions resulting from 5′ sticky ends are stable over a wider range of bulge loop sizes. We highlight the importance of possible coaxial stacking interactions within the motif and investigate how each coaxial stacking interaction stabilises the structure and favours a particular geometry.
I Introduction

Over the past few decades, DNA has been used extensively as a material for bottom-up nano-fabrication. Seeman and Sleiman 2017 The robust Watson-Crick base pairing rules enable a target structure to be encoded as the global free-energy minimum. Inspired by naturally occurring Holliday junctions, Holliday 1964 DNA nanotechnology began with the sequence design of short, single-stranded oligonucleotides that hybridize to form immobile four-way junctions: Seeman 1982; Seeman and Kallenbach 1983 sticky ends at the end of the branching duplexes allow inter-motif binding. Further advances have led to the creation of more rigid structural motifs such as the double-crossover molecule (DX tile),Fu and Seeman 1993 the basis of many two-dimensional structures, Winfree et al. 1998; He et al. 2006; Zheng et al. 2009 and DNA polyhedra. Shih, Quispe, and Joyce 2004; Goodman et al. 2005; Zhang et al. 2008; He et al. 2008; Zhang et al. 2009; He et al. 2010; Iinuma et al. 2014 The DNA origami Rothemund 2006 and DNA brick Wei, Dai, and Yin 2012; Ke et al. 2012 techniques have enabled the creation of larger structures with intricate twists and curves.Ke et al. 2009; Douglas et al. 2009; Dietz, Douglas, and Shih 2009; Han et al. 2011; Liedl et al. 2010 These techniques may be combined, for example in the growth of tile-based crystals using DNA origami seeds. Barish et al. 2009
The success of DNA nanotechnology has stimulated the search for a greater variety of structural motifs. Current motifs can be broadly classed into tiles,Fu and Seeman 1993; LaBean et al. 2000 branched junctions,Seeman and Kallenbach 1983; Zheng et al. 2009; Wang et al. 2019; Zhang et al. 2015; Benson et al. 2015; Hong et al. 2016 and two- and three-dimensional blocks of parallel, densely-packed helices.Rothemund 2006; Douglas et al. 2009; Dietz, Douglas, and Shih 2009; Ke et al. 2012 Most structures make extensive use of reciprocal strand exchange to connect parallel helices and nearly all inter-motif connections are based on sticky-end cohesion, with the notable exceptions of paranemic crossover,Zhang et al. 2002; Qian et al. 2012 edge-sharing,Yan and Seeman 2001 and stacking interactions.Gerling et al. 2015 Recently, an interesting motif was presented by Hamada et al Hamada and Murata 2009 which does not rely on reciprocal strand exchange between parallel duplexes and produces a right-angled geometry resembling the letter T. DNA T-motifs consist of one duplex with a bulge loop and a second duplex with a single-stranded (3′ or 5′) sticky end. Hybridization of the bulge loop and the sticky end leads to a well-defined, planar geometry (Figure 1). T-motifs have been used to create a variety of periodic Hamada and Murata 2009; Li et al. 2017 and finite structures Li et al. 2012; Zuo et al. 2015 and to perform computations in algorithmic assembly schemes.Tandon et al. 2019 To the best of our knowledge, all of the structures presented in the literature make use of 5- or 6-nucleotide sticky ends with 5′ polarity; however, the reason for this choice is not immediately clear. Our aim is to present a comprehensive study of T-motifs to understand the underlying interactions at the junction and provide a useful guide to incorporating these motifs in larger structures.
In this paper, we investigate the thermodynamic stabilities and conformations of T-motifs experimentally and by means of a coarse-grained model, oxDNA.Ouldridge, Louis, and Doye 2011; Šulc et al. 2012; Doye et al. 2013; Snodin et al. 2015 While all-atom simulations have recently been used to study a variety of DNA systems,Yoo and Aksimentiev 2013; Göpfrich et al. 2016; Wu et al. 2013; Lee, Lee, and Kim 2017 their extreme computational costs limit their scope to specific cases. On the other hand, coarse-grained models whose fundamental units are larger than a nucleotidePenna and Perico 2010; Castro et al. 2011 are unable to capture important processes involved in T-motif formation such as hybridization, duplex fraying and coaxial stacking. OxDNA provides a description of DNA interactions at the nucleotide level and has been highly successful at reproducing structural, mechanical and thermodynamic properties of single-stranded and duplex DNA. The model has been applied successfully to probe the kinetics of hybridization and toehold-mediated strand displacement Ouldridge et al. 2013a; Srinivas et al. 2013; Mosayebi et al. 2014 as well as a variety of dynamic systems including DNA tweezers,Ouldridge, Louis, and K 2010 walkers,Ouldridge et al. 2013b; Šulc et al. 2014 and origamiSnodin et al. 2016 and brick assembly.Fonseca et al. A recent study Schreck et al. 2015 using oxDNA quantified the flexibility induced by bulge-loops of different sizes in DNA duplexes, predicting higher bend angles for larger bulge-loops. Crucially, oxDNA has been recently adapted to include the difference in groove widths of duplex DNA,Snodin et al. 2015 making it well suited to study the geometries of T-motifs.
II Methods
II.1 Simulation Methods
In oxDNA,Snodin et al. 2015 each nucleotide is represented as a rigid body that interacts pairwise with other nucleotides through three interaction sites: (a) a backbone connectivity site, (b) a stacking and coaxial stacking site, and (c) a hydrogen-bonding and cross-stacking site. The interaction potential also includes an excluded volume interaction and a Debye-Hückel term describing screened electrostatic interactions that takes into account different salt conditions. A more detailed description of the model can be found in Supplementary Material SI A but we discuss some relevant aspects of the model here.
There are several reasons why oxDNA is well suited to this study. First, the model includes an explicit description of stacking and can describe different helical and non-helical conformations of single-stranded DNAOuldridge, Louis, and Doye 2011. It is crucial that the description of such conformations is accurate when investigating the interactions between the sticky end and the bulge loop at the T-motif junction. Second, the model has been parametrized to reproduce the melting temperatures of thousands of DNA sequences Šulc et al. 2012 and can provide a good description of hybridization thermodynamics including the tendency of duplexes to fray close to their melting temperature and the breaking of base pairs caused by extreme stresses. Importantly, parameters describing interactions involving base pairing, base stacking along a strand, and cross stacking along duplexes are all sequence-dependent, allowing direct comparison to our experiments. Third, the most recent version of the model has been adapted to include a distinct assymetry between the major and minor grooves, Snodin et al. 2015 providing a more realistic geometric description of duplex DNA. This feature is crucial to studying T-motifs, since their properties are highly sensitive to the geometric fit of the branch duplex to the helical groove that it spans.
The model does incorporate some simplifications that are important for this study. First, coaxial stacking interactions across backbone “nicks” are not sequence-dependent; instead, an average-base parametrization is used for these interactions. These interactions are important in T-motif formation but oxDNA cannot provide any insights into the effect of changing the identity of the bases that flank the ends of the junction. Second, the simple treatment of electrostatics in oxDNA cannot capture ion-specific effects. The parametrisation of the Debye-Hückel term reproduces the dependence of duplex melting temperatures on monovalent [Na+] ions. Therefore, local effects of charges at the T-motif junctions may not be fully described by the model. Third, only interactions between canonical Watson-Crick (A-T/G-C) pairs are taken into account in the oxDNA potential, ignoring other interactions such as sugar-edge bonds and Hoogsteen pairing. These interactions have been shown to affect the flexibility of bulge loop nucleotides in RNAMacchion, Strömberg, and Nilsson 2008 and may play a similar role in DNA.
Standard Monte Carlo algorithms are inefficient for sampling systems of strongly interacting particles with short-range interactions. We use the virtual move Monte Carlo methodWhitelam et al. 2008 (VMMC) to allow trial collective movements of clusters by iteratively adding nearby nucleotides to a growing cluster with probabilities that depend on the resultant changes in energy. The collective movement is then accepted with a probability that ensures correct sampling from the canonical ensemble. The algorithm is particularly suited to DNA nanostructures because collective motion significantly enhances the sampling speed of conformations of a strand or aggregates of strands. In addition, we use the umbrella sampling technique Torrie and Valleau 1977 to apply biases to our simulations in order to flatten energy barriers and sample transitions between meta-stable states. In this work the bias is applied over two order parameters: the end-to-end distance between the bulge loop and sticky-end, to quantify the entropy loss on binding; and the number of base pairs formed between the bulge-loop and the sticky-end, to quantify the free energy change during hybridization (see Supplementary Material SI B).
All simulations were run at 25C and salt conditions of [Na+] = 0.5M, with all stands at a concentration of 42 M. This relatively high concentration is used for computational efficiency. The results can be extrapolated to other concentrations by a thermodynamically appropriate scaling of the (unbiased) partition function of bound states relative to that of the unbound states. Ouldridge, Louis, and Doye 2010 Strand sequences and precise simulation details can be found in Supplementary Material SI C.
II.2 Experimental Methods
To form a T-motif, the four component strands were cooled from 95 to 25C at a rate of 1C/min, in a TAE/Mg2+ buffer (40mM Tris base, 1mM EDTA, 20mM acetic acid, and 12.5mM MgCl2, pH 8.50.2). Polyacrylamide gel electrophoresis (PAGE) was used to assess the conformations of the annealed complexes. A fluorescent label was conjugated to the 5′ end of the strand that contains the bulge loop (see Supplementary Material SII A for full sequences).
In order to obtain more accurate measurements of changes in electrophoretic mobility, standard reference markers were used. Our protocol (Supplementary Material SII B) corrects for variability between gel lanes and provides a reliable way of measuring the electrophoretic mobility of each sample relative to reference markers as , where , and are the mobilities of the sample, and the high-mobility and low-mobility markers, respectively.
In order to calculate T-motif dissociation constants (Section III.2) the concentrations of strands within the electrophoresis gel were estimated on the basis of the approximate volume occupied by a gel band (see Supplementary Material SII B).
III Results and Discussion
III.1 Simulation Results
As shown in Figure 1, a T-motif formed by the hybridization of a bulge loop in one duplex with a terminal sticky end on another creates a three-arm junction. Two of the arms form an approximately continuous duplex. The third arm comprises one of the double-helical domains flanking the bulge: its two component strands branch off at nicks in the backbone on opposite sides of one of the helical grooves of the quasi-continuous duplex. The geometry of the B-DNA double-helix implies that the junction will span a different groove depending on the polarity, , of the sticky end. We use the notation to specify a T-motif. The stability and geometry of a T-motif depends on its polarity , on the length of the bulge loop, , and on the number of base pairs within the loop formed with the sticky end, . Additional stability is provided by coaxial stacking at the nicks. We describe the coaxial stacking state of the junction by , where: corresponds to a well-formed T-motif; denotes no coaxial stacking; , are partially folded states that have only one of the sites depicted in Figure 1(b) stacked; is the misfolded state shown in Figure 1(d) in which domains and of the bulge duplex are approximately collinear; and has, in addition, stacking between the terminal base pair of a partly-formed loop duplex D2 and the end of sticky-end duplex .

A site is characterised as stacked if the magnitude of the coaxial stacking interaction energy between the relevant nucleotides is above a threshold value, taken to be the same as the threshold used to assess hydrogen-bonding of 0.6 kcal mol-1 at 25C which corresponds to 0.093 times the well depth of the interaction potential. This cutoff was chosen to avoid counting fleeting and weak interactions.
Figure 2 shows the probabilities of coaxial stacking states for states with a given during the formation of 5′ T-motifs with various loop sizes. Equivalent results for 3′ T-motifs are shown in Supplementary Material SIII D. For an optimal loop size (eg. ), coaxial stacking at site is observed during initial stages of binding (small ) and is followed by coaxial stacking at site . In the fully formed , both sites are simultaneously stacked (stacking state ) with high probability. When the bulge loop and inserted sticky end are too large (eg. ), a similar behaviour is observed in the initial stages of binding but stacking at site is broken in the final stage in order to relieve stress when all base pairs are incorporated (see the top right configuration in Figure 3). In such cases, there is a preference to stack at site rather than as this is geometrically more feasible without breaking base pairs in the side-branch duplex. For short loop sizes (eg. ), there is a high probability of coaxial stacking between arms and at site (Figure 1d). When all base pairs have formed between loop and sticky end, states in which the duplex incorporating the bulge loop forms a continuous helix (, ) compete with states that have the T-motif geometry (, , ). The relative weakness of states , for longer bulge loops is consistent with the tendency seen in Ref. (57) for duplexes with longer bulged loops (and without sticky-end insertions) to adopt configurations with no stacking across the bulge. As will be discussed later, these two classes of configuration are evident in the observed bimodal probability distributions for the angles between arms.
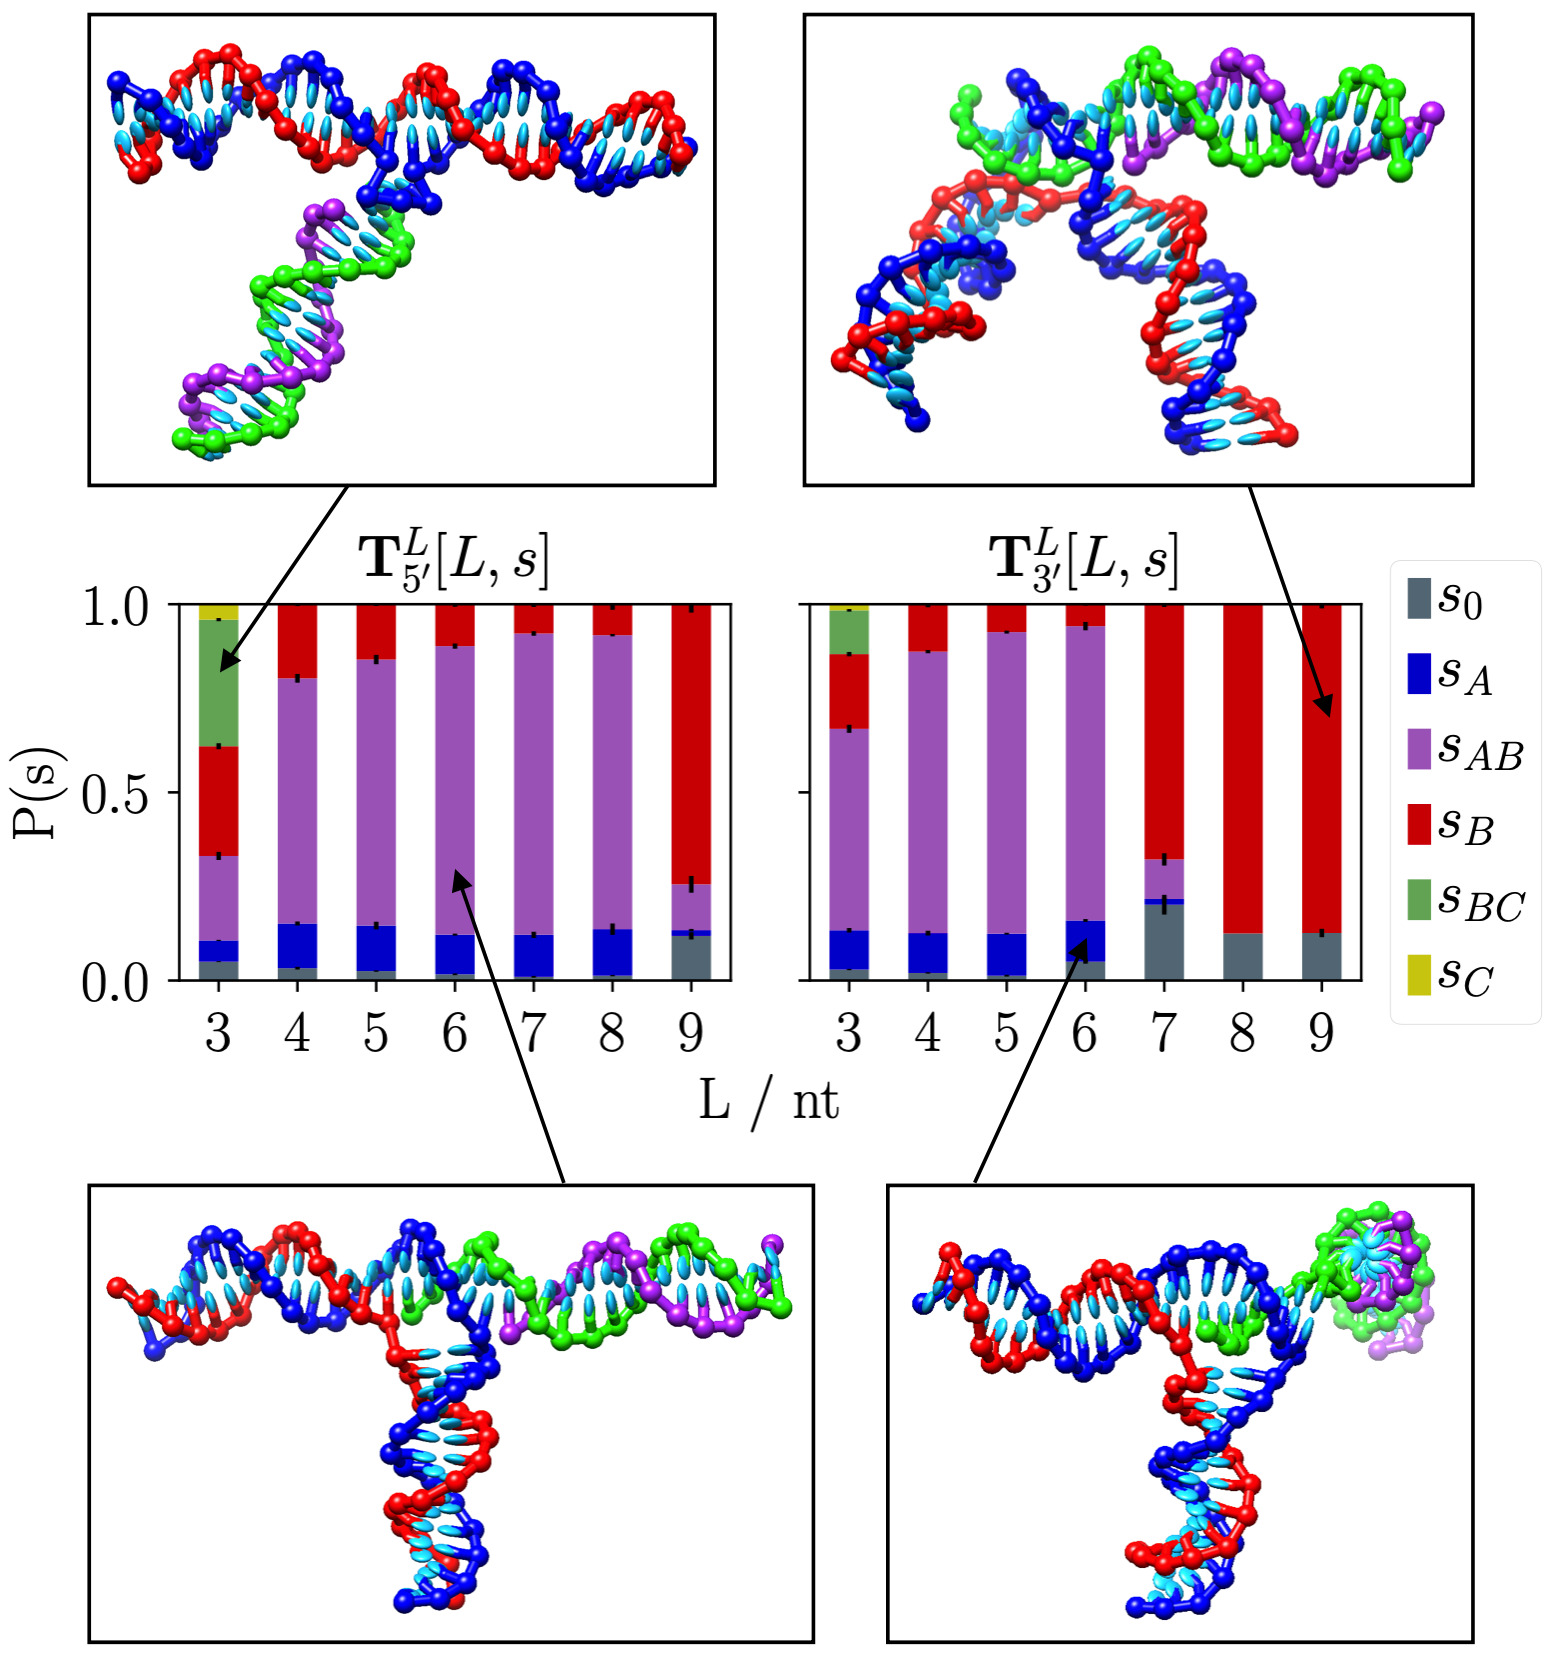
Figure 3 shows the probabilities of coaxial stacking states for T-motifs with fully-bound bulge loops. In an ideal structure, sites and (Figure 1(b)) would both be stacked (configuration ). This ideal case occurs with high probability in fully-base-paired 5′ T-motifs with loop sizes of and 3′ T-motifs with . The difference between these optimal loop (and sticky end) lengths arises because a 3′ T-motif forms a junction spanning the narrower minor groove of the quasi-continuous, coaxially-stacked duplex, whereas a 5′ T-motif junction spans the wider major groove (Figure 1).
To characterise the geometries of T-motifs, vectors pointing in the direction of each arm were calculated according to the scheme shown in Figure 1c: direction vectors are averages over base-normal vectors of the 11 central base pairs of each arm. The means and standard deviations of the angles between arms, calculated assuming a wrapped normal distribution, are plotted in Figure 4. For an ideal T-motif, we expect a planar geometry in which , and . It is clear that 5′ T-motifs with loop sizes nucleotides and 3′ T-motifs with nucleotides best satisfy these requirements with low variance in the distribution of angles. These ranges coincide with loop sizes for which coaxial stacking at sites and stabilizes the T-motif.
Figure 5 examines more closely the relationship between coaxial stacking and T-motif geometries. The distributions of end-to-end distances across the nicked duplex, , and the dihedral angle, , are shown for each coaxial stacking state. For every loop size, coaxial stacking state corresponds to the target geometry in which is maximised and . Partially stacked and unstacked states have much wider distributions of and , leading to the large variances observed in Figure 4 for extreme loop sizes ( and ). Stacking states and , in which stacking within the bulge duplex inhibits the formation of a well-defined T-junction, have a well-defined geometry of their own. In these cases, the duplex containing the bulge loop is extended, , maximising its end-to-end distance ; the sticky-end duplex hangs off the loop with . See Supplementary Material SIII D and Supplementary Figures S13 - S20 for all distributions of characterised angles and lengths.
The thermodynamics of T-motif formation was investigated by using umbrella sampling to speed up transitions between metastable states. The number of base pairs formed between the bulge loop and the sticky end, , was used as an order parameter to obtain the free energy , where is the (unbiased) partial partition function of the states with base pairs. Figure 6 shows free-energy profiles for T-motifs with different loop sizes . To understand the features of the free energy profiles, let us highlight several events in a hypothetical assembly pathway for a T-motif with ideal loop size. First, there is a concentration-dependent entropic cost associated with bringing the interacting bulge and sticky end into close proximity. Once the first base pair forms, hybridization between sticky end and bulge loop progressively decreases the free energy through enthalpic gains which outweigh further entropic penalties as the duplex “zips up”. As discussed above, coaxial stacking of bases across the nicks increases the stability of the structure. As the final base pairs form, these stacking-energy gains stabilise the T-junction as it “clicks” into shape. For an ideal bulge size (e.g. ), the formation of the final base pair thus results in the highest gain in stability. However, if the duplex formed by hybridization of the bulge with the sticky end is just larger than the groove width (e.g. ), the formation of the final base pairs results in little energy gain as the junction is sterically constrained, inhibiting base stacking. When the bulge size is much larger than the groove width (e.g. ), the junction loses its well-defined T-shape; it is stabilized by the formation of additional base pairs but lacks the contribution of base stacking across the nicks.
III.2 Experimental Results
The electrophoretic mobility of a T-motif is lower than those of the component sticky-end and loop duplexes. For a fixed concentration of loop duplex, the mobility of the gel band corresponding to the T-motif was found to be dependent on the concentration of the sticky-end duplex. This behaviour is consistent with fast on- and off-rates for association of the sticky-end with the bulge loop, causing them to bind and unbind while co-migrating through the gel. As shown in Supplementary Material SII D, when the difference in mobilities of the component duplexes is increased, they migrate separately and no band shift is observed.
To estimate the dissociation constant of a T-motif, , the relative electrophoretic mobility of the gel band containing the loop duplex, , was measured as a function of sticky-end duplex concentration, [S]. Reference markers were used to enable accurate measurement of , as outlined in Section II.2. Dissociation constants were estimated by fitting measurements of to the function , corresponding to the assumptions that the change in relative electrophoretic mobility is proportional to the fraction of loop duplex bound in a T-motif and that this fraction is close to the equilibrium value. Experimental results for motif are shown in Figure 7, along with the resulting binding curve.

Binding affinities, corresponding to the fitted dissociation constants, for T-motifs with bulge sizes between 5 and 7 are compared to oxDNA simulation results in Figure 8. oxDNA reproduces the experimentally determined dependence on bulge size and polarity of sticky end. 5′ T-motifs are generally more stable, especially for larger bulge sizes, because they span the wider major groove. Agreement between experiment and simulation is close, but there are uncertainties in both sets of data. Firstly, the temperature in oxDNA simulations is set to C but gel electrophoresis experiments are performed at C. The extrapolation of simulation results to C using single-histogram reweighting,Kumar et al. 1992 is described in Supplementary Material SI D. Secondly, oxDNA simulations were carried out using different salt conditions ([Na+] = 0.5M) to those used in experiments ([Mg2+] = 12.5mM). As discussed in section II.1, the simple treatment of electrostatics in oxDNA does not allow simulation of arbitrary solution conditions but the conversion factor between monovalent and divalent salt concentrations used here is roughly consistent with the scale factors provided by Bosco et al.Bosco, Camunas-Soler, and Ritort 2014 Thirdly, although the hydrogen-bonding potentials for our simulations are sequence-specific, the coaxial stacking interactions in oxDNA are not. Our estimates of the binding strengths of T-motifs therefore do not capture their dependence on the coaxial stacking strengths of the specific nucleotides flanking stacking sites , and . Finally, as outlined in Supplementary Material SII B, there is experimental uncertainty associated with estimation of concentrations in the electrophoresis gel. This introduces an additional systematic error in experimentally-determined dissociation constants.
IV Conclusions
The T-motif has recently become a popular building block in DNA nanostructures. T-motifs are formed by the interaction of a bulge loop in one duplex and a sticky-end of another, creating a characteristic 3-arm “T” shape. A T-motif incorporating a 3′ sticky-end leads to a junction in which the side arm is connected across the minor groove of a quasi-continuous duplex; a 5′ sticky-end leads to a junction that spans the major groove. We have used coarse-grained oxDNA simulations to investigate the geometries and stabilities of T-motifs of both polarities with a range of bulge-loop and sticky-end sizes.
If the size of the duplex formed by hybridization of the bulge loop and sticky end is approximately equal to the groove width, coaxial stacking interactions at either side of this duplex provide additional stability and favour the formation of a junction with well-defined ‘T’ geometry. Given the larger size of the major groove, 5′ T-motifs can incorporate a larger number of base pairs in the junction and can adopt stable geometries for a wider range of bulge sizes. If the bulge loop is too short, there is a high probability that coaxial stacking of base pairs across the bulge on the loop duplex destabilises the junction. If the bulge is too long, the desired stacking interactions are disrupted when the sticky end and loop are fully hybridized, again leading to undesired non-‘T’ geometries. Experimentally determined T-motif binding affinities show a remarkable correlation with oxDNA results. Our simulations show that optimal bulge loop lengths are in the ranges nucleotides for 5′ T-motifs and nucleotides for 3′ T-motifs.
Previous work on T-motifsHamada and Murata 2009; Li et al. 2017; Li et al. 2012; Zuo et al. 2015; Tandon et al. 2019 has made use of the 5′ variant due to its higher stability. We have shown that T-motifs can also be stable and adopt well-defined geometries. If incorporated within larger structures, the reduced stability of the junction could be compensated for by cooperative assembly, in which the formation of other structural links increases the local concentration of sticky ends at their target bulge loops.
V Acknowledgments
KGY was supported by Engineering and Physical Sciences Research Council Life Sciences Interface Doctoral Training Centre EP/F500394/1 and AJT by a Royal Society Wolfson Research Merit Award. BN thanks Dr. Thomas Ouldridge for helpful discussions and Domen Prešern for providing Figure S1.
References
- Seeman and Sleiman (2017) N. C. Seeman and H. F. Sleiman, Nat. Rev. Mater 3, 17068 (2017).
- Holliday (1964) R. Holliday, Genetics Research 5, 282 (1964).
- Seeman (1982) N. C. Seeman, J. Theor. Biol 99, 237 (1982).
- Seeman and Kallenbach (1983) N. C. Seeman and N. R. Kallenbach, Biophys. J 44, 201 (1983).
- Fu and Seeman (1993) T. J. Fu and N. C. Seeman, Biochemistry 32, 3211 (1993).
- Winfree et al. (1998) E. Winfree, F. Liu, L. A. Wenzler, and N. C. Seeman, Nature 394, 539 (1998).
- He et al. (2006) Y. He, Y. Tian, A. E. Ribbe, and C. Mao, J. Am. Chem. Soc 128, 15978 (2006).
- Zheng et al. (2009) J. Zheng, J. J. Birktoft, Y. Chen, T. Wang, R. Sha, P. E. Constantinou, S. L. Ginell, C. Mao, and N. Seeman, Nature 461, 74 (2009).
- Shih, Quispe, and Joyce (2004) W. M. Shih, J. D. Quispe, and G. F. Joyce, Nature 427, 618 (2004).
- Goodman et al. (2005) R. P. Goodman, I. A. T. Schaap, C. F. Tardin, C. M. Erben, R. M. Berry, C. F. Schmidt, and A. J. Turberfield, Science 310, 1661 (2005).
- Zhang et al. (2008) C. Zhang, M. Su, Y. He, X. Zhao, P. Fang, A. E. Ribbe, W. Jiang, and C. Mao, Proc. Natl. Acad. Sci. USA 105, 10665 (2008).
- He et al. (2008) Y. He, T. Ye, M. Su, C. Zhang, A. E. Ribbe, W. Jiang, and C. Mao, Nature 452, 198 (2008).
- Zhang et al. (2009) C. Zhang, S. Ko, M. Su, Y. Leng, A. E. Ribbe, W. Jiang, and C. Mao, J. Am. Chem. Soc 131, 1413 (2009).
- He et al. (2010) Y. He, M. Su, P. Fang, C. Zhang, A. E. Ribbe, W. Jiang, and C. Mao, Angew. Chem. Int. Ed 49, 748 (2010).
- Iinuma et al. (2014) R. Iinuma, Y. Ke, R. Jungmann, T. Schlichthaerle, J. B. Woehrstein, and P. Yin, Science 344, 65 (2014).
- Rothemund (2006) P. W. K. Rothemund, Nature 440, 297 (2006).
- Wei, Dai, and Yin (2012) B. Wei, M. Dai, and P. Yin, Nature 485, 623 (2012).
- Ke et al. (2012) Y. Ke, L. L. Ong, W. M. Shih, and P. Yin, Science 338, 1177 (2012).
- Ke et al. (2009) Y. Ke, J. Sharma, M. Liu, K. Jahn, Y. Liu, and H. Yan, Nano. Lett 9, 2445 (2009).
- Douglas et al. (2009) S. M. Douglas, H. Dietz, T. Liedl, B. Högberg, F. Graf, and W. M. Shih, Nature 459, 414 (2009).
- Dietz, Douglas, and Shih (2009) H. Dietz, S. M. Douglas, and W. M. Shih, Science 325, 725 (2009).
- Han et al. (2011) D. Han, S. Pal, J. Nangreave, Z. Deng, Y. Liu, and H. Yan, Science 332, 342 (2011).
- Liedl et al. (2010) T. Liedl, B. Högberg, J. Tytell, D. E. Ingber, and W. M. Shih, Nat. Nanotechnol 5, 520 (2010).
- Barish et al. (2009) R. D. Barish, R. Schulman, P. W. K. Rothemund, and W. E, Proc. Natl. Acad. Sci. USA 106, 6054 (2009).
- LaBean et al. (2000) T. H. LaBean, H. Yan, J. Kopatsch, F. Liu, E. Winfree, J. H. Reif, and N. C. Seeman, J. Am. Chem. Soc 122, 1848 (2000).
- Wang et al. (2019) W. Wang, S. Chen, A. Byoungkwon, K. Huang, T. Bai, M. Xu, G. Bellot, Y. Ke, Y. Xiang, and B. Wei, Nat. Commun 10, 1067 (2019).
- Zhang et al. (2015) F. Zhang, S. Jiang, S. Wu, Y. Li, C. Mao, Y. Liu, and H. Yan, Nature Nanotechnology 10, 779 (2015).
- Benson et al. (2015) E. Benson, A. Mohammed, J. Gardell, S. Masich, E. Czeizler, P. Orponen, and B. Högberg, Nature 523, 441 (2015).
- Hong et al. (2016) F. Hong, S. Jiang, T. Wang, Y. Liu, and H. Yan, Angew. Chem. Int. Ed 55, 12832 (2016).
- Zhang et al. (2002) X. Zhang, H. Yan, Z. Shen, and N. C. Seeman, J. Am. Chem. Soc 124, 12940 (2002).
- Qian et al. (2012) H. Qian, J. Yu, P. Wang, Q. F. Dong, and M. C, ChemComm 48, 12216 (2012).
- Yan and Seeman (2001) H. Yan and N. C. Seeman, J. Supramol. Chem. 1, 229 (2001).
- Gerling et al. (2015) T. Gerling, K. F. Wagenbauer, A. Neuner, and H. Dietz, J. Biomol. Struct. Dyn 33, 46 (2015).
- Hamada and Murata (2009) S. Hamada and S. Murata, Angew. Chem. Int. Ed 121, 6952 (2009).
- Li et al. (2017) M. Li, H. Zuo, J. Yu, X. Zhao, and M. C, Nanoscale 9, 10601 (2017).
- Li et al. (2012) X. Li, C. Zhang, C. Hao, C. Tian, G. Wang, and C. Mao, ACS Nano 6, 5138 (2012).
- Zuo et al. (2015) H. Zuo, S. Wu, M. Li, Y. Li, W. Jiang, and C. Mao, Angew. Chem. Int. Ed 54, 15118 (2015).
- Tandon et al. (2019) A. Tandon, S. Kim, Y. Song, H. Cho, S. Bashar, J. Shin, T. H. Ha, and S. H. Park, Nat. Sci. Rep 9, 2252 (2019).
- Ouldridge, Louis, and Doye (2011) T. E. Ouldridge, A. A. Louis, and J. P. K. Doye, J. Chem. Phys 134, 085101 (2011).
- Šulc et al. (2012) P. Šulc, F. Romano, T. E. Ouldridge, L. Rovigatti, J. P. K. Doye, and A. A. Louis, J. Chem. Phys 137, 135101 (2012).
- Doye et al. (2013) J. P. K. Doye, T. E. Ouldridge, A. A. Louis, F. Romano, P. Šulc, C. Matek, B. E. K. Snodin, L. Rovigatti, J. S. Schreck, R. M. Harrison, and W. P. J. Smith, Phys. Chem. Chem. Phys 15, 20381 (2013).
- Snodin et al. (2015) B. E. K. Snodin, F. Randisi, M. Mosayebi, P. Šulc, J. S. Schreck, F. Romano, T. E. Ouldridge, R. Tsukanov, E. Nir, A. A. Louis, and J. P. K. Doye, J. Chem. Phys. 142, 234901 (2015).
- Yoo and Aksimentiev (2013) J. Yoo and A. Aksimentiev, Proc. Natl. Acad. Sci. USA 110, 20099 (2013).
- Göpfrich et al. (2016) K. Göpfrich, C. Y. Li, M. Ricci, S. P. Bhamidimarri, J. Yoo, B. Gyenes, A. Ohmann, M. Winterhalter, A. Aksimentiev, and U. F. Keyser, ACS Nano 10, 8207 (2016).
- Wu et al. (2013) N. Wu, D. M. Czajkowsky, J. Zhang, J. Qu, M. Ye, D. Zeng, X. Zhou, J. Hu, Z. Shao, B. Li, and C. Fan, J. Am. Chem. Soc. 135, 12172 (2013).
- Lee, Lee, and Kim (2017) C. Lee, J. Y. Lee, and D. N. Kim, Nat. Commun 8, 2067 (2017).
- Penna and Perico (2010) G. L. Penna and A. Perico, Biophys. J 98, 2964 (2010).
- Castro et al. (2011) C. E. Castro, F. Kilchherr, D. N. Kim, E. L. Shiao, T. Wauer, P. Wortmann, M. Bathe, and H. Dietz, Nat. Methods 8, 221 (2011).
- Ouldridge et al. (2013a) T. E. Ouldridge, P. Šulc, F. Romano, J. P. K. Doye, and A. A. Louis, Nucleic Acids Res 41, 8886 (2013a).
- Srinivas et al. (2013) N. Srinivas, T. E. Ouldridge, P. Šulc, J. M. Schaeffer, B. Yurke, A. A. Louis, J. P. K. Doye, and E. Winfree, Nucleic Acids Res 41, 10641 (2013).
- Mosayebi et al. (2014) M. Mosayebi, F. Romano, T. E. Ouldridge, J. P. K. Doye, and A. A. Louis, J. Chem. Phys. B. 118, 14326 (2014).
- Ouldridge, Louis, and K (2010) T. E. Ouldridge, A. A. Louis, and D. J. P. K, Phys. Rev. Lett. 104, 178101 (2010).
- Ouldridge et al. (2013b) T. E. Ouldridge, R. L. Hoare, A. A. Louis, J. P. K. Doye, J. Bath, and A. J. Turberfield, ACS Nano 7, 2479 (2013b).
- Šulc et al. (2014) P. Šulc, T. E. Ouldridge, F. Romano, J. P. K. Doye, and A. A. Louis, Natural Computing 13, 535 (2014).
- Snodin et al. (2016) B. E. K. Snodin, F. Romano, L. Rovigatti, T. E. Ouldridge, A. A. Louis, and J. P. K. Doye, ACS Nano 10, 1724 (2016).
- (56) P. Fonseca, F. Romano, J. S. Schreck, T. E. Ouldridge, J. P. K. Doye, and A. A. Louis, J. Chem. Phys. 148, 134910.
- Schreck et al. (2015) J. S. Schreck, T. E. Ouldridge, F. Romano, A. A. Louis, and J. P. K. Doye, J. Chem. Phys 142, 165101 (2015).
- Macchion, Strömberg, and Nilsson (2008) B. N. Macchion, R. Strömberg, and L. Nilsson, J. Biomol. Struct. Dyn 26, 163 (2008).
- Whitelam et al. (2008) S. Whitelam, E. H. Feng, M. F. Hagan, and P. L. Geissler, Soft Matter 5, 1251 (2008).
- Torrie and Valleau (1977) G. M. Torrie and J. P. Valleau, J. Comput. Phys 23, 187 (1977).
- Ouldridge, Louis, and Doye (2010) T. E. Ouldridge, A. A. Louis, and J. P. K. Doye, Journal of Physics: Condensed Matter 22, 104102 (2010).
- Kumar et al. (1992) S. Kumar, J. M. Rosenberg, D. Bouzida, R. H. Swendsen, and P. A. Kollman, J. Comput. Chem 13, 1011 (1992).
- Bosco, Camunas-Soler, and Ritort (2014) A. Bosco, J. Camunas-Soler, and F. Ritort, Nucleic Acids Res 42, 2064 (2014).