On the Lorentz Force and Torque of Solar Photospheric Emerging Magnetic FieldsJournal: ApJL
Abstract
Magnetic flux generated and intensified by the solar dynamo emerges into the solar atmosphere, forming active regions (ARs) including sunspots. Existing theories of flux emergence suggest that the magnetic flux can rise buoyantly through the convection zone but is trapped at the photosphere, while its further rising into the atmosphere resorts to the Parker buoyancy instability. To trigger such an instability, the Lorentz force in the photosphere needs to be as large as the gas pressure gradient to hold up an extra amount of mass against gravity. This naturally results in a strongly non-force-free photosphere, which is indeed shown in typical idealized numerical simulations of flux tube buoyancy from below the photosphere into the corona. Here we conduct a statistical study of the extents of normalized Lorentz forces and torques in the emerging photospheric magnetic field with a substantially large sample of SDO/HMI vector magnetograms. We found that the photospheric field has a rather small Lorentz force and torque on average, and thus is very close to a force-free state, which is not consistent with theories as well as idealized simulations of flux emergence. Furthermore, the small extents of forces and torques seem not to be influenced by the emerging AR’s size, the emergence rate, or the non-potentiality of the field. This result puts an important constraint on future development of theories and simulations of flux emergence.
Keywords:
Magnetic fields; Sun: Photosphere; Magnetic flux emergenceI Introduction
Sunspots and solar active regions (ARs) are believed to be generated by magnetic flux emerging through the solar surface, i.e., the photosphere (Parker 1955). In the first place, magnetic field is generated by the solar dynamo action in the deep convection zone. Then the magnetic fluxes are further intensified and adopt the form of flux bundles because of stretching and twisting of their magnetic field lines by turbulent fluid motions in the convection zone. Eventually, the flux bundles are pushed up by magnetic buoyancy and rise into the photosphere to form ARs.
Since we are not able to observe directly the process in the sub-photospheric layers, most of the knowledge on flux emergence comes from theoretical models and numerical MHD simulations (Archontis 2008; Cheung & Isobe 2014; Archontis & Syntelis 2019). Many simulations show that, a flux tube, generally twisted, experiences a typical two-stage emergence process (Toriumi & Yokoyama 2010, e.g.,) during its passage from the convection zone into the atmosphere, i.e., the solar corona. In the first stage, the magnetic buoyancy force pushes upward the flux tube through the convection zone (Parker 1955), but it is trapped at the shallow layers near the solar surface because of the strongly sub-adiabatic stratification (i.e., much smaller temperature gradient than an adiabatic stratification) of the photosphere (Syntelis et al. 2019, e.g.,). Then in the second stage, with more and more magnetic flux pileup just below the surface, the magnetic pressure gradient increases continuously and eventually the Parker instability (Shibata et al. 1989; Archontis et al. 2004), a kind of magnetic Rayleigh-Taylor instability, is triggered to let part of the flux break through the dense photosphere, which is typically observed as a continuous magnetic flux increasing on the photosphere during the emerging of an AR.
To trigger the Parker instability at the sub-adiabatic photosphere, the Lorentz force must be built up such that it can support against gravity an extra amount of mass comparable to what is supported by the photospheric gas pressure gradient (Newcomb 1961; Acheson 1979; Archontis et al. 2004). Meanwhile the plasma (ratio of plasma pressure to magnetic pressure) is on the order of unity in the photosphere (Gary 2001; Cho et al. 2017). Thus, in the photosphere, the magnitude of Lorentz force should be comparable to that of the magnetic pressure gradient, and so the emerging field in the photosphere is far from a force-free state in which the Lorentz force vanishes as a result of the balancing between magnetic pressure force and magnetic tension (Wiegelmann & Sakurai 2012). Furthermore, once the buoyancy instability is triggered, the emergence runs into a dynamic phase in which there is a strong interaction of the magnetic field with the plasma, and the field cannot be force-free. However, when the field emerges into the atmosphere by a few scale heights above the photosphere, it relaxes quickly to a closely force-free state because of the fast decreasing of the plasma density and pressure with height (Fan 2009). Thus the distribution of the Lorentz force above the solar surface should be restricted mainly within a small height. To quantify the global extent of this force, one can make use of the Gauss’s law by expressing the net volumetric Lorentz force above the photosphere in a surface integral of Maxwell stress tensor of the photospheric magnetic field (Molodenskii 1969; Aly 1984; Low 1985; Fisher et al. 2012, see the formula in Section II), which are observable and thus the results can be used to compare with and constrain theories and simulations. There have been several works done to estimate the global Lorentz force of ARs using the observed vector magnetograms from different instruments (Metcalf et al. 1995; Moon et al. 2002; Tiwari 2012; Liu et al. 2013; Liu & Hao 2015), and some of them conclude that the photospheric field is actually not far away from force-free (Moon et al. 2002; Tiwari 2012, e.g.,). However all the previous studies are carried out using the snapshots of developed ARs without considering the case of flux-emerging ARs.
In this Letter, we perform a systematic survey of the global force focusing on ARs in their full emergence phase and using the vector magnetograms from Solar Dynamics Observatory/Helioseismic and Magnetic Imager (SDO/HMI) (Hoeksema et al. 2014), which are both done for the first time. Furthermore, in addition to checking the global force, we also estimate the global Lorentz torque, which has not been considered in previous investigations. Our results show that the emerging photospheric fields are actually very close to the force-free state, which is not consistent with the results from typical idealized simulations of twisted flux tube emerging from below the photosphere. This result puts an important constraint on the future development of theories and simulations of flux emergence.
II Method and Data
Since the Lorentz force can be expressed as the divergence of a tensor, the Maxwell stress, the integration of force in a volume can be expressed as surface integral of the tensor. Furthermore, by assuming that the emerging magnetic field above the photosphere (i.e., ) is well isolated and its strength falls off fast enough as going upward to infinity, the net Lorentz force in the volume of can be expressed as integration of the Maxwell stress tensor on the photosphere , which is given by (Aly 1984; Low 1985; Fisher et al. 2012)
| (1) |
We note that the same formula can also apply to the interior volume below the surface (by removing the minus sign before the integrations) if the magnetic field below the surface is also well isolated, which, however, is not generally fulfilled unless the surface integration is taken for the full sphere.
To compare the forces in different magnetic fields with different flux contents, it is better to use a normalized measurement. We follow Low 1985 and Metcalf et al. 1995 by employing the integrated magnetic pressure force given by
| (2) |
and the normalized forces are ratios defined as , , and , respectively. For a field being close to force-free, it must have all the ratios much less than unity, i.e., , , and (Low 1985). Metcalf et al. 1995 suggested that the magnetic field can be considered as force-free completely if the normalized forces are all less than or equal to , and this criterion is widely accepted by the later studies (Moon et al. 2002; Tiwari 2012; Liu et al. 2013; Liu & Hao 2015; Jiang & Zhang 2019). On the other hand, for a strongly non force-free field, the ratios can be close to unity, meaning that the magnetic pressure force and the tension force are so unbalanced that the net Lorentz force is comparable to one of its components, the total magnetic pressure force. The HMI team (Sun 2014) released a data set, cgem.Lorentz, which also contains the integrated Lorentz forces of the HMI vector magnetograms. A minor difference exists between the horizontal normalized forces we defined here and the ones in cgem.Lorenzt, i.e., and , and in Equation (4) in (Sun 2014), which are related by , , and . We use the cgem.Lorentz data to verify our calculations.
It should be noted that these ratios being less than is only a necessary condition for the fields to be force-free; even if the global integration of force is zero, the forces locally in different parts are not necessarily zero (for example, near the edge of a sunspot, where the local Lorentz force is balanced by gas pressure gradients). To put an additional constraint, we can compute the net torque induced by the Lorentz force, , which is given as (Aly 1989)
| (3) |
where the origin of the coordinates is set at the lower left corner of the magnetogram. Similarly, the normalized torques are defined as , , and , and is the magnitude of the net torque induced by only the magnetic pressure force, where
| (4) |
A very important requirement in using the formula is that the magnetic field has a high-degree balance of the positive and negative fluxes, which can be quantified by the ratio of the net flux to the total unsigned flux ,
| (5) |
Last we note that since the formula of net force and torque, Equations (1) and (3), are integrations of the pixels of magnetogram, they are not sensitive to the resolutions of the magnetogram (Jiang & Zhang 2019, see also); for instance, we found that the results are almost unchanged by reducing resolution of the original magnetogram with a factor of 2 or 4. Furthermore, we found that calculations of the force and torque are not very sensitive to the noise in the vector magnetograms. Bobra et al. 2014 state that, in the HMI vector magnetograms, the field strengths below 220 G are generally considered to be noise. We have also calculated the forces and torques by using only the field above the noise threshold of G, and found that they are changed very little, likely due to that the contributions of the small-scaled, unresolved fields cancel each other in the integrations.
We survey all the space-weather HMI AR patches (Bobra et al. 2014, SHARP,) with definite NOAA number observed from 2010 May, when SDO began to operate, until the end of 2019. The following criteria are used to select the ARs. First, we focus on the emerging phase of ARs from almost nothing on the solar surface to its peak flux. Thus the ARs should have significant flux emergence during their passing on the solar disk, i.e., the total unsigned magnetic flux shows a evolution trend of overall monotone increase. Second, the target AR should be well separated from the surrounding ARs (presumably a single flux tube emergence and isolated from interaction with significant pre-existing field), so the positive and negative fluxes of the region can be balanced each other in a good degree, and in particular we only select the ARs with the flux-balance parameter during their emergence phase. Third, to reduce the observation errors, we only select the duration when the ARs are located within in longitude from the Sun’s central meridian (as will be shown in the next section, the distance of the observed AR to the solar disk center has a systematic influence on the magnitudes of the forces and torques). By all these criteria, we finally obtained 51 ARs with significant flux emergence during their passage on the solar disk. The ARs and their observed time durations are listed in Table 1, including their start, end times and their Carrington coordinates. The evolutions of total unsigned magnetic fluxes of all the ARs, calculated based on one-hour cadence SHARP data and smoothed by a six-hour window, are shown in Figure 1. As can be seen, overall the larger the AR’s total flux is, the faster the AR emerges (Otsuji et al. 2011; Norton et al. 2017). With all the ARs considered, there are in total vector magnetograms obtained for our study to compute the forces and torques of the photospheric field.
We also take two typical, independently-developed flux-emergence MHD simulations as a comparison with the observations. The two MHD simulations are obtained from Toriumi & Takasao 2017 and Syntelis et al. 2017, respectively, for the aim of reproducing the birth of ARs with significant non-potentiality. Both simulations used typical settings of a twisted flux tube that is initially placed in the convection zone (with several Mm below the photosphere) and buoyantly rises to the photosphere, where it partially emerges into the corona. To compare the simulations with observations, it is crucial to use the same physical height of photosphere. We note that in the simulations, the photosphere is slightly lifted by the emerging flux, and the buoyancy instability essentially happens at altitudes of approximately two scale heights (Fan 2009; Syntelis et al. 2017, e.g.,). Thus, we perform the force and torque computations using the magnetic field at three different heights, starting from , which is closest to in each numerical model, and moving upwards to the Parker instability height () at increments of around one pressure scale height.
III Results
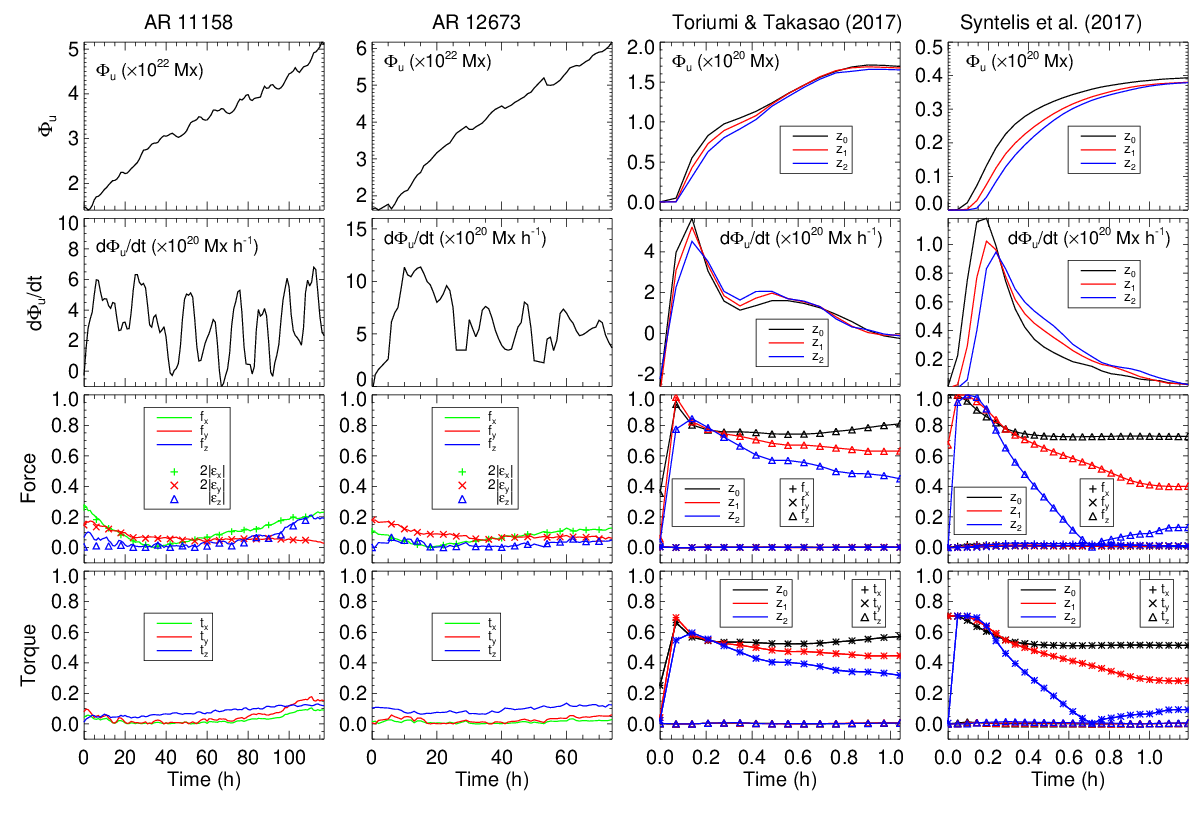
Before giving the statistical results, we first show the evolutions of two well-studied ARs, NOAA 11158 and 12673, and compare them with the two flux-emergence MHD simulations. Both the ARs have a fast flux-emergence phase during their passage on the solar disk and have strong non-potentiality manifested by shearing and rotating motions of the emerging sunspots (Sun et al. 2012; Yang et al. 2017; Yan et al. 2018). As shown in Figure 2, both the ARs have significant flux increase, with an average emerging rate of Mx h-1, and their fluxes are very well balanced (with ). The normalized forces and torques are mostly less than for the full duration, suggesting that the field is very close to force-free in the emergence process. Note that for the normalized forces, our results are almost identical to those directly from the cgem.Lorentz data set.
In the simulations, although their flux contents are smaller by at least two orders of magnitude than the two ARs, their peak emerging rates are comparable the observed ones. Since the two simulations use similar settings, they show very similar evolution, with a very fast rising and saturation of the fluxes in roughly an hour, while the observed ones have a steady flux increase for several days. The very distinct difference between the simulations and the observed ARs lies in the forces and torques: once the photospheric magnetic fluxes begin to increase in the simulations, the forces and torques in all the three levels (see , and labeled in the Figure 2) rise to significantly larger values ( for ) and torques ( for and ), attaining the order of unity. This means that in the simulated cases, the balance between the tension and magnetic pressure gradient is strongly destroyed, i.e., in the extremely non-force-free state. For the level, this strongly-forced state occurs during the entire emerging phase, while for a little higher, the force and torque decrease systematically with time. In particular, in Syntelis et al. 2017’s simulation, they decrease rather fast at where the Parker instability happens, reaching almost zero when the flux saturates. Therefore, our results show that during the flux injection phase, i.e. around the emergence rate peak, the forces and torques in typical flux emergence models are much larger than the observed ones. However later, the dynamics settle to more realistic values. Note that it is due to the perfect symmetry of two emerging polarities in the simulations that the net forces in horizontal directions (i.e., and ) and the net torques in vertical direction () are both zero.
Figure 3 shows the histograms of normalized forces and torques for all the magnetograms with both the average and median values denoted. The averages and standard deviations for the forces are respectively, , , and . Thus all of them are close to , at which the field can be regarded as force-free (Metcalf et al. 1995). The median values of the forces are systematically smaller by a little bit than their average values. The averages and standard deviations for the normalized torques are respectively, , , and . The torques show a slight dependence on the direction; is approximately a half of and . In any case, on average, both the relative forces and torques of the magnetograms are close to , thus they can be regarded as being close to force-free. We note that with such a much larger set of emerging AR samples than previous statistical studies using the snapshots of developed ARs (Moon et al. 2002; Tiwari 2012), our results confirm that the photospheric field is actually not far from the force-free state, even in the dynamically emerging phase.
To explore whether there are correlations between the forces (and torques) and key parameters during the flux emergence of ARs, such as the total unsigned magnetic flux , the flux changing rate and the non-potentiality, which is quantified by the average twist parameter (Bobra et al. 2014) defined by
| (6) |
The simple intuition is that, the faster the flux emerges, the larger the force should be; the more non-potential or twisted the emerging field is, the larger the force and torque should be. In Figure 4, we plot the two-dimensional histogram showing the event frequency distributions in the two-parameter spaces defined by the force (and torque) with the three parameters , , and , respectively. For simplicity, as we only care about the magnitudes, we use average of the three components of force and torque by and . As can be seen, no systematic correlation is found between the forces (and torques) with either the total magnetic flux of the ARs, the emergence rates or the non-potentiality.
We further analyzed whether the force and torque are influenced by the observed locations of the ARs, since the further away from the solar disk center the target AR is, the larger the measurement errors would be. Indeed, as shown in the last column of Figure 4, an approximately linear correlation is seen in the force (and torque) with the distance of the observed AR from the disk center. It shows that the closer to the disk center, the smaller the force (and torque) is. Thus, the increase of the forces (and torques) is most likely due to the errors in the observations, and with a better quality of observed data, presumably the force and torque will be smaller, meaning that the emerging field is actually even closer to force-free than than the results shown here.
IV Discussion
In this Letter, we have, for the first time, systematically surveyed the normalized magnitudes of the global Lorentz forces and torques in solar flux-emergence ARs observed by SDO/HMI. It is found that even during the flux-emergence phase, i.e., the formation of ARs, the magnetic field in the photosphere is generally close to force-free state, since the relative measurements of the Lorentz force and torque are mostly on the order of . There seems to be no correlation between the magnitude of normalized force and torque with the total unsigned flux content of the emerging ARs, the emergence rate, or the non-potentiality of the field. The only systematic correlation of the force (and torque) is found to be with the observed location of the ARs on the solar disk, that is, the closer to the solar disk center, the closer to force-free the field is. Therefore, this suggests that the actual magnetic field is even more force-free than what the statistic results show here. It can explain why many nonlinear force-free coronal-field extrapolations based directly on the photospheric vector magneotgrams generally agrees with each other to some extent (Wiegelmann 2004; Valori et al. 2007; Wiegelmann & Sakurai 2012; Jiang & Feng 2013; Inoue et al. 2014, e.g.,), although there are still some mismatches between the models, and the mismatches can be further alleviated through a preprocessing of the vector magnetograms, in which the photospheric fields are able to be rendered highly force-free by adjusting the observed data within the noise level (Wiegelmann et al. 2006; Jiang & Feng 2014; Duan & Zhang 2018).
Our results show that during the emergence phase, idealized flux emergence simulations in which a twisted flux tube is artificially made buoyant to rise through the convection zone, show significantly larger forces (in comparison to the total magnetic pressure force) at the photosphere than the ones measured by our observations. It is after the flux injection phase, when the photospheric flux saturates, that the models tend to settle to more realistic photospheric force and torque ratios. This is suggestive of a discrepancy between simulations and observations. Very recently, using the the flux emergence simulation of Toriumi & Takasao 2017 as a ground-truth data set (the same one we have analyzed in this Letter as shown in Figure 2), Toriumi et al. 2020 performed a joint comparison of different data-driven coronal field evolution models that using the photospheric magnetograms produced in the simulated flux emergence as input to their bottom boundaries (Cheung & DeRosa 2012; Jiang et al. 2016; Hayashi et al. 2019; Guo et al. 2019). It was found that, although all the data-driven models reproduced a flux rope structure, the quantitative discrepancies are large, which is attributed mainly to the highly non-force-free input photospheric field and to the treatment of background atmosphere. Especially, for a data-driven MHD model (Jiang et al. 2016) that used typical settings of the tenuous atmosphere in the corona (i.e., very low plasma and high Alfvén speed), the reproduced magnetic flux rope is significantly larger in size and stronger in field-line twisting than those in the original simulation as well as other data-driven MHD models that use typically dense plasma near the lower boundary (Guo et al. 2019; Hayashi et al. 2019, e.g.,). This discrepancy clearly arises from too strong Lorentz force of the simulated photospheric field, which cannot be balanced by the plasma in Jiang et al. 2016’s model, and thus the flux rope can rise strongly upward and be freely twisted by the Lorentz force and torque, which leads to the strong magnetic energy and helicity in the corona. Thus, a further test of the data-driven models with more realistic and thus more force-free photospheric magnetic field needs to be done in future.
By comparing the flux emergence rates from observations with those from typical MHD simulations, Norton et al. 2017 have found that the observed emergence rates are smaller than those in simulations, which indicates a slower rise of the flux in the interior than what is captured in simulations. That finding is consistent with ours, since with a slower emergence rate, the emerging field at the photosphere have more time to relax, and consequently, be more force-free. In other words, the emergence at the photosphere might actually proceed in a quasi-static way rather than the dynamic one as shown in simulations. There are several aspects that can be adjusted in simulations to make the field emerge slower and thus, potentially, closer to force-free (and torque-free) in the photosphere. The first one is the depth where the initial flux tube is placed; both the simulations we used here have a flux tube placed near the solar surface, while with a flux tube placed much deeper in the interior, it can expand and stretch with more time to relax during its rising and should become more force-free than initially (Toriumi & Yokoyama 2011; Syntelis et al. 2019, e.g.,). The second one is the twist degree of the initial flux tube; stronger twist can of course create increased torque during its emerging in the photosphere (Sturrock et al. 2015; Sturrock & Hood 2016). The third one might be attributed to geometry of the emerging tube and how it couples with twist and the size of the flux tube, which has been discussed in Syntelis et al. 2019. Finally, to include realistic turbulent convection in the modeling can further yield much relaxed emergence process (Toriumi & Hotta 2019). In summary, our study shows that the photosphere field is very close to force-free during the emergence process, and this fact should be taken into consideration in future development of MHD simulations as well as the theories of flux emergence.
References
- Acheson (1979) Acheson, D. J. 1979, Solar Physics, 62, 23, doi: 10.1007/BF00150129
- Aly (1984) Aly, J. J. 1984, The Astrophysical Journal, 283, 349, doi: 10.1086/162313
- Aly (1989) Aly, J. J. 1989, Sol. Phys., 120, 19, doi: 10.1007/BF00148533
- Archontis (2008) Archontis, V. 2008, Journal of Geophysical Research (Space Physics), 113, 3, doi: 10.1029/2007JA012422
- Archontis et al. (2004) Archontis, V., Moreno-Insertis, F., Galsgaard, K., Hood, A., & O’Shea, E. 2004, Astronomy & Astrophysics, 426, 1047, doi: 10.1051/0004-6361:20035934
- Archontis & Syntelis (2019) Archontis, V., & Syntelis, P. 2019, Philosophical Transactions of the Royal Society A: Mathematical, Physical and Engineering Sciences, 377, 20180387, doi: 10.1098/rsta.2018.0387
- Bobra et al. (2014) Bobra, M. G., Sun, X., Hoeksema, J. T., et al. 2014, Sol. Phys., 289, 3549, doi: 10.1007/s11207-014-0529-3
- Cheung & DeRosa (2012) Cheung, M. C. M., & DeRosa, M. L. 2012, The Astrophysical Journal, 757, 147, doi: 10.1088/0004-637X/757/2/147
- Cheung & Isobe (2014) Cheung, M. C. M., & Isobe, H. 2014, Living Reviews in Solar Physics, 11, doi: 10.12942/lrsp-2014-3
- Cho et al. (2017) Cho, I.-H., Cho, K.-S., Bong, S.-C., et al. 2017, The Astrophysical Journal, 837, L11, doi: 10.3847/2041-8213/aa611b
- Duan & Zhang (2018) Duan, A.-Y., & Zhang, H. 2018, Research in Astronomy and Astrophysics, 18, 085, doi: 10.1088/1674-4527/18/7/85
- Fan (2009) Fan, Y. 2009, ApJ, 697, 1529, doi: 10.1088/0004-637X/697/2/1529
- Fisher et al. (2012) Fisher, G. H., Bercik, D. J., Welsch, B. T., & Hudson, H. S. 2012, Sol. Phys., 277, 59, doi: 10.1007/s11207-011-9907-2
- Gary (2001) Gary, G. A. 2001, Sol. Phys., 203, 71
- Guo et al. (2019) Guo, Y., Xia, C., Keppens, R., Ding, M. D., & Chen, P. F. 2019, The Astrophysical Journal, 870, L21, doi: 10.3847/2041-8213/aafabf
- Hayashi et al. (2019) Hayashi, K., Feng, X., Xiong, M., & Jiang, C. 2019, The Astrophysical Journal, 871, L28, doi: 10.3847/2041-8213/aaffcf
- Hoeksema et al. (2014) Hoeksema, J. T., Liu, Y., Hayashi, K., et al. 2014, Sol. Phys., 289, 3483, doi: 10.1007/s11207-014-0516-8
- Inoue et al. (2014) Inoue, S., Hayashi, K., Magara, T., Choe, G. S., & Park, Y. D. 2014, The Astrophysical Journal, 788, 182. http://stacks.iop.org/0004-637X/788/i=2/a=182
- Jiang & Feng (2013) Jiang, C., & Feng, X. 2013, ApJ, 769, 144, doi: 10.1088/0004-637X/769/2/144
- Jiang & Feng (2014) —. 2014, Sol. Phys., 289, 63, doi: 10.1007/s11207-013-0346-0
- Jiang & Zhang (2019) Jiang, C.-q., & Zhang, M. 2019, Chinese Astronomy and Astrophysics, 43, 252, doi: 10.1016/j.chinastron.2019.04.009
- Jiang et al. (2016) Jiang, C. W., Wu, S. T., Feng, X. S., & Hu, Q. 2016, Nature Comm., 7, 11522, doi: 10.1038/ncomms11522
- Liu & Hao (2015) Liu, S., & Hao, J. 2015, Advances in Space Research, 55, 1563, doi: 10.1016/j.asr.2015.01.010
- Liu et al. (2013) Liu, S., Su, J. T., Zhang, H. Q., et al. 2013, Publications of the Astronomical Society of Australia, 30, e005, doi: 10.1017/pasa.2012.005
- Low (1985) Low, B. C. 1985, in Measurements of Solar Vector Magnetic Fields, Vol. 2374 (ed. M. J. Hagyard (Washington, DC: NASA)), 49
- Metcalf et al. (1995) Metcalf, T. R., Jiao, L., McClymont, A. N., Canfield, R. C., & Uitenbroek, H. 1995, ApJ, 439, 474, doi: 10.1086/175188
- Molodenskii (1969) Molodenskii, M. M. 1969, Soviet Ast., 12, 585
- Moon et al. (2002) Moon, Y.-J., Choe, G. S., Yun, H. S., Park, Y. D., & Mickey, D. L. 2002, The Astrophysical Journal, 568, 422, doi: 10.1086/338891
- Newcomb (1961) Newcomb, W. A. 1961, Physics of Fluids, 4, 391, doi: 10.1063/1.1706342
- Norton et al. (2017) Norton, A. A., Jones, E. H., Linton, M. G., & Leake, J. E. 2017, The Astrophysical Journal, 842, 3, doi: 10.3847/1538-4357/aa7052
- Otsuji et al. (2011) Otsuji, K., Kitai, R., Ichimoto, K., & Shibata, K. 2011, Publications of the Astronomical Society of Japan, 63, 1047, doi: 10.1093/pasj/63.5.1047
- Parker (1955) Parker, E. N. 1955, The Astrophysical Journal, 122, 293, doi: 10.1086/146087
- Shibata et al. (1989) Shibata, K., Tajima, T., Matsumoto, R., et al. 1989, The Astrophysical Journal, 338, 471, doi: 10.1086/167212
- Sturrock & Hood (2016) Sturrock, Z., & Hood, A. W. 2016, Astronomy & Astrophysics, 593, A63, doi: 10.1051/0004-6361/201628360
- Sturrock et al. (2015) Sturrock, Z., Hood, A. W., Archontis, V., & McNeill, C. M. 2015, Astronomy & Astrophysics, 582, A76, doi: 10.1051/0004-6361/201526521
- Sun (2014) Sun, X. 2014, arXiv e-prints, arXiv:1405.7353. https://arxiv.org/abs/1405.7353
- Sun et al. (2012) Sun, X., Hoeksema, J. T., Liu, Y., et al. 2012, ApJ, 748, 77, doi: 10.1088/0004-637X/748/2/77
- Syntelis et al. (2019) Syntelis, P., Archontis, V., & Hood, A. 2019, ApJ, 874, 15, doi: 10.3847/1538-4357/ab0959
- Syntelis et al. (2017) Syntelis, P., Archontis, V., & Tsinganos, K. 2017, The Astrophysical Journal, 850, 95, doi: 10.3847/1538-4357/aa9612
- Tiwari (2012) Tiwari, S. K. 2012, The Astrophysical Journal, 744, 65, doi: 10.1088/0004-637X/744/1/65
- Toriumi & Hotta (2019) Toriumi, S., & Hotta, H. 2019, ApJ, 886, L21, doi: 10.3847/2041-8213/ab55e7
- Toriumi & Takasao (2017) Toriumi, S., & Takasao, S. 2017, The Astrophysical Journal, 850, 39, doi: 10.3847/1538-4357/aa95c2
- Toriumi et al. (2020) Toriumi, S., Takasao, S., Cheung, M. C. M., et al. 2020, ApJ, 890, 103, doi: 10.3847/1538-4357/ab6b1f
- Toriumi & Yokoyama (2010) Toriumi, S., & Yokoyama, T. 2010, The Astrophysical Journal, 714, 505, doi: 10.1088/0004-637X/714/1/505
- Toriumi & Yokoyama (2011) —. 2011, The Astrophysical Journal, 735, 126, doi: 10.1088/0004-637X/735/2/126
- Valori et al. (2007) Valori, G., Kliem, B., & Fuhrmann, M. 2007, Sol. Phys., 245, 263, doi: 10.1007/s11207-007-9046-y
- Wiegelmann (2004) Wiegelmann, T. 2004, Sol. Phys., 219, 87, doi: 10.1023/B:SOLA.0000021799.39465.36
- Wiegelmann et al. (2006) Wiegelmann, T., Inhester, B., & Sakurai, T. 2006, Sol. Phys., 233, 215, doi: 10.1007/s11207-006-2092-z
- Wiegelmann & Sakurai (2012) Wiegelmann, T., & Sakurai, T. 2012, Living Reviews in Solar Physics, 9, 5. https://arxiv.org/abs/1208.4693
- Yan et al. (2018) Yan, X. L., Wang, J. C., Pan, G. M., et al. 2018, ApJ, 856, 79, doi: 10.3847/1538-4357/aab153
- Yang et al. (2017) Yang, S., Zhang, J., Zhu, X., & Song, Q. 2017, ApJ, 849, L21, doi: 10.3847/2041-8213/aa9476
| No. | NOAA AR | Start Time | Longitude | Latitude | End Time | Longitude | Latitude |
| 1 | AR11072 | 2010-05-21T08:00 | -25.29 | -13.63 | 2010-05-26T13:00 | 44.81 | -14.24 |
| 2 | AR11076 | 2010-05-31T20:00 | -6.78 | -18.84 | 2010-06-04T16:00 | 44.47 | -19.31 |
| 3 | AR11117 | 2010-10-26T04:00 | 4.30 | 18.27 | 2010-10-29T05:00 | 44.66 | 18.56 |
| 4 | AR11130 | 2010-11-28T08:00 | -10.53 | 11.88 | 2010-12-02T10:00 | 44.58 | 12.39 |
| 5 | AR11141 | 2010-12-30T22:00 | -3.05 | 37.20 | 2011-01-02T02:00 | 24.93 | 37.46 |
| 6 | AR11158 | 2011-02-12T14:00 | -20.21 | -14.39 | 2011-02-17T11:00 | 44.85 | -14.17 |
| 7 | AR11327 | 2011-10-20T14:00 | -18.73 | -26.34 | 2011-10-24T01:00 | 27.38 | -26.06 |
| 8 | AR11416 | 2012-02-08T14:00 | -44.02 | -11.58 | 2012-02-15T05:00 | 44.72 | -11.22 |
| 9 | AR11422 | 2012-02-19T12:00 | -9.89 | 22.59 | 2012-02-22T23:00 | 36.62 | 22.71 |
| 10 | AR11431 | 2012-03-04T12:00 | 16.26 | -20.95 | 2012-03-06T16:00 | 44.67 | -20.95 |
| 11 | AR11460 | 2012-04-18T01:00 | -25.59 | 21.47 | 2012-04-23T00:00 | 41.11 | 21.04 |
| 12 | AR11551 | 2012-08-20T04:00 | -11.20 | 5.26 | 2012-08-23T21:00 | 38.92 | 5.14 |
| 13 | AR11561 | 2012-08-30T01:00 | -28.89 | -19.08 | 2012-08-30T20:00 | -18.18 | -19.08 |
| 14 | AR11630 | 2012-12-08T12:00 | -23.39 | 19.09 | 2012-12-11T10:00 | 15.65 | 19.47 |
| 15 | AR11640 | 2012-12-30T14:00 | -23.17 | 30.84 | 2013-01-04T18:00 | 44.73 | 31.43 |
| 16 | AR11645 | 2013-01-02T20:00 | -12.58 | -10.24 | 2013-01-05T00:00 | 16.66 | -9.98 |
| 17 | AR11682 | 2013-02-26T02:00 | -9.25 | -11.21 | 2013-02-29T00:00 | 29.82 | -11.17 |
| 18 | AR11702 | 2013-03-20T19:00 | 10.00 | 15.09 | 2013-03-23T06:00 | 43.36 | 15.00 |
| 19 | AR11726 | 2013-04-19T06:00 | -14.30 | 18.00 | 2013-04-23T14:00 | 44.80 | 17.60 |
| 20 | AR11750 | 2013-05-15T01:00 | 0.95 | -7.33 | 2013-05-17T16:00 | 36.51 | -7.63 |
| 21 | AR11764 | 2013-06-02T01:00 | 10.09 | 12.85 | 2013-06-04T00:00 | 36.56 | 12.61 |
| 22 | AR11765 | 2013-06-05T13:00 | -24.40 | 10.51 | 2013-06-10T00:00 | 36.03 | 9.98 |
| 23 | AR11776 | 2013-06-20T05:00 | 12.50 | 9.24 | 2013-06-22T14:00 | 44.62 | 8.98 |
| 24 | AR11781 | 2013-06-27T21:00 | -11.35 | 19.02 | 2013-07-01T00:00 | 30.25 | 18.66 |
| 25 | AR11784 | 2013-07-03T13:00 | -11.31 | -17.98 | 2013-07-05T00:00 | 8.33 | -18.14 |
| 26 | AR11807 | 2013-07-28T11:00 | -3.17 | 23.35 | 2013-07-30T12:00 | 23.58 | 23.20 |
| 27 | AR11813 | 2013-08-07T12:00 | -0.32 | -19.55 | 2013-08-10T00:00 | 33.42 | -19.71 |
| 28 | AR11824 | 2013-08-17T11:00 | 4.51 | -20.47 | 2013-08-19T17:00 | 34.87 | -20.56 |
| 29 | AR11843 | 2013-09-17T08:00 | -15.24 | -6.14 | 2013-09-19T05:00 | 10.28 | -6.12 |
| 30 | AR11855 | 2013-09-30T15:00 | -20.03 | -20.24 | 2013-10-04T00:00 | 25.52 | -20.09 |
| 31 | AR11922 | 2013-12-10T01:00 | 5.96 | 9.86 | 2013-12-12T22:00 | 44.92 | 10.22 |
| 32 | AR11946 | 2014-01-05T16:00 | -25.21 | 12.20 | 2014-01-10T00:00 | 33.55 | 12.69 |
| 33 | AR12003 | 2014-03-10T15:00 | 4.37 | 15.15 | 2014-03-13T13:00 | 44.00 | 15.12 |
| 34 | AR12089 | 2014-06-13T15:00 | 6.27 | 17.22 | 2014-06-16T12:00 | 44.81 | 16.87 |
| 35 | AR12119 | 2014-07-18T10:00 | -23.26 | -25.92 | 2014-07-23T00:00 | 37.78 | -26.33 |
| 36 | AR12219 | 2014-11-25T13:00 | -13.48 | 2.72 | 2014-11-29T20:00 | 44.89 | 3.24 |
| 37 | AR12234 | 2014-12-12T06:00 | 1.81 | 4.56 | 2014-12-15T00:00 | 39.22 | 4.90 |
| 38 | AR12257 | 2015-01-09T03:00 | 16.99 | 9.96 | 2015-01-10T20:00 | 40.20 | 10.13 |
| 39 | AR12273 | 2015-01-26T12:00 | -8.98 | 2.86 | 2015-01-29T14:00 | 32.98 | 3.10 |
| 40 | AR12422 | 2015-09-24T19:00 | -26.50 | -26.83 | 2015-09-30T03:00 | 44.73 | -26.63 |
| 41 | AR12530 | 2016-04-11T00:00 | -2.54 | 21.03 | 2016-04-13T00:00 | 24.38 | 20.88 |
| 42 | AR12543 | 2016-05-09T06:00 | -11.00 | -2.04 | 2016-05-12T21:00 | 38.28 | -2.42 |
| 43 | AR12571 | 2016-08-05T18:00 | -12.30 | 7.86 | 2016-08-09T23:00 | 44.47 | 7.59 |
| 44 | AR12581 | 2016-08-29T22:00 | 19.07 | 5.11 | 2016-08-31T06:00 | 37.08 | 5.09 |
| 45 | AR12635 | 2017-02-08T17:00 | -31.45 | 19.54 | 2017-02-13T09:00 | 31.55 | 19.79 |
| 46 | AR12673 | 2017-09-03T04:00 | -8.37 | -16.47 | 2017-09-06T06:00 | 33.44 | -16.49 |
| 47 | AR12675 | 2017-08-30T23:00 | 8.50 | -13.21 | 2017-09-01T11:00 | 28.88 | -13.21 |
| 48 | AR12715 | 2018-06-19T11:00 | -40.22 | 6.69 | 2018-06-20T22:00 | -20.43 | 6.53 |
| 49 | AR12720 | 2018-08-23T21:00 | 10.78 | 0.83 | 2018-08-25T16:00 | 35.10 | 0.79 |
| 50 | AR12723 | 2018-09-29T15:00 | -4.16 | -16.11 | 2018-10-02T08:00 | 32.55 | -15.98 |
| 51 | AR12733 | 2019-01-24T14:00 | 3.12 | 11.06 | 2019-01-26T21:00 | 34.26 | 11.26 |