Polarization behavior of periodic optical outbursts in blazar OJ287
Abstract
Context. As a characteristic feature of generic blazars the polarization behavior of the quasi-periodic optical outbursts observed in OJ287 is investigated. The optical light-curves of the December/2015 outburst are also simulated in terms of the precessing jet nozzle model previously proposed.
Aims. The polarization behavior of three primary quasi-periodic optical outbursts peaking in 1983.0, 2007.8 and 2015.8 are analyzed in order to understand the nature of their optical radiation.
Methods. A two-component model has been applied, showing that the variations in flux density, polarization degree and polarization position angle can be consistently interpreted with two polarized components: one steady-component with constant polarization and one burst-component with varying polarization (e.g., relativistic shock propagating along the jet-beam axis).
Results. The flux light curves of the December/2015 outburst (including its first flare and second flare) are well model-simulated in terms of 14 elementary synchrotron sub-flares, each having a symmetric profile. The model-simulations of polarization behavior for the three major outbursts (in 1983.0, 2007.8 and 2015.8) demonstrate that they all exhibit rapid and large rotations in polarization position angle, implying that they are synchrotron flares produced in the jet.
Conclusions. Combining with the results previously obtained for interpreting the optical light curves in terms of lighthouse effect for both quasi-periodic and non-periodic outbursts, we suggest that relativistic jet models may be the most appropriate models for understanding the nature of the optical flaring radiation in blazar OJ287: its optical outbursts may comprise a number of blended “elementary synchrotron flares”, each produced by the helical motion of individual superluminal optical knots via lighthouse effect.
Key Words.
galaxies: active – galaxies: jets – galaxies: polarization – galaxies: nuclei – galaxies : individual OJ2871 Introduction
Blazars are active galactic nuclei with their relativistic jets pointing at
small angles with respect to the line of sight. They emit radiation across
the entire electromagnetic spectrum from radio, IR/optical, UV, X-ray
through to high energy (TeV) -rays. Their emissions are highly
variable with a wide range of time-scales from minutes/hours to years
(e.g., Angel & Stockman 1980 1980, Aller et al. 2010 2010, 2014 2014,
Ackermann et al. 2011 2011).
OJ287 (z=0.306) is a unique blazar: its optical variability
not only has the characteristic properties of radiation in generic
blazars, but also reveals a 12-yr
quasi-periodicity with a double-peaked structure at time-intervals
of 1-2 years (in its optical
light curve recorded during more than one hundred years since 1890;
e.g., Sillanpää et al. 1988 1988, Lehto & Valtonen 1996 1996,
Sundelius et al. 1997 1997, Valtonen et al. 2011 2011).
Thus, the investigation (both observational and theoretical) of the
OJ287 phenomena mainly includes four subjects: (1) mechanisms
which cause the 12-yr quasi-periodicity and double-flare structure
of the optical outbursts with time-intervals of 1-2 yr;
(2) characteristics of the optical radiation and its associated
radiation in other wavebands (from radio to -rays).Especially,
correlation between the optical outbursts and the ejection of superluminal
radio knots; (3) connection between the characteristics of the optical
outbursts and the mechanism for its quasi-periodicity; (4) properties
of the putative supermassive black hole binary (precessing
orbital motion and accretion processes) and possible tests of
general-relativity effects (gravitational radiation, precession of binary
orbit and no-hair theorem, etc.).
Various models have been proposed to interpret the quasi-periodicity
and double-peaked structure in its optical light curve
(e.g, Sillanpää et al. 1988 1988,
Lehto & Valtonen 1996 1996, Sundelius et al. 1997 1997,
Valtonen et al.2019 2019, Dey et al. 2019 2019, Valtaoja et al.
2000 2000, Katz 1997 1997, Villata et al. 1998 1998,
Britzen et al. 2018 2018, Tanaka 2013 2013) .
Many authors investigate the nature and properties of the optical/radio
emission, especially, polarization behavior and helical motion of the
emitting components (e.g., Usher 1979 1979, Aller et al. 1981 1981,
Holmes et al. 1984 1984, Kikuchi et al. 1988 1988, Gabuzda et al.
2001 2001, 2004 2004, 1999 1999, D’Arcangelo et al. 2009 2009,
Villforth et al. 2010 2010, Aller et al. 2010 2010, 2014 2014,
2016 2016, Hodgson et al. 2017 2017,
Kushwaha et al. 2018a, 2018b,
Qian 2018b, 2019a, 2019b, Cohen et al. 2017 2017,
2018 2018, Myserlis et al. 2018 2018).
The 12 yr quasi-periodicity is widely suggested to be related
to the orbital motion of the putative black-hole binary in the nucleus.
The precessing jet model (or binary black hole-impact model)
originally proposed by Lehto & Valtonen
(1996 1996) and its improved versions (e.g., Valtonen et al.
2019 2019, Dey et al. 2019 2019) suggest that the quasi-periodicity
is due to the precessing orbital motion of the binary due to
the gravitational interaction between the supermassive secondary and
primary holes. The periodic outbursts are
caused by the secondary black hole’s penetrating
into the disk of the primary black hole. The double-flare structure
is assumed to be due to the two impacts occurring per one orbital cycle
near pericenter and apocenter passages. Each secondary hole’s
crossing of the primary disk will produce strong thermal optical outburst
from the gas-bubble torn off the primary disk. In addition, the
penetrations lead to enhanced accretion onto the primary hole and
optical knot ejections from the jet, producing the follow-up synchrotron
flares (tidal flares). At present, the disk-impact model can well explain
the quasi-periodicity and the double-flare structure, and have successfully
predicted the flare times of a few double-outbursts (including the
2015/2019 pair-flares, Laine et al. 2020 2020). The optical light curve
has been modeled in terms of the combination of impact flares and
tidal flares (e.g., Dey et al. 2018 2018).
Recently, Britzen et al. (2018 2018) have made a detailed
analysis of the kinematic properties of the radio jet on pc-scales
and suggested that the radio jet precession is related to the orbital
motion of the black-hole binary, and the optical variability could
be related to the precession and nutation of the radio jet.
In order to investigate the nature of optical emission for both
quasi-periodic and non-periodic outbursts in OJ287, Qian (2019a)
has made model simulations of their optical light curves under
the precessing jet nozzle scenario, which has been previously used to
study the the kinematics of superluminal radio knots (including their
helical motion and variable Doppler boosting effects), jet-beam
precession, connection between optical and radio variability (including
simultaneous radio/optical variations, evolutional
relation between optical and radio
knots, etc.) in a number of blazars (3C345: Qian et al. 1991a,
2009 2009; 3C454.3: Qian et al. 2014 2014; NRAO 150: Qian 2016 2016;
B 1308+326: Qian et al. 2017 2017; PG 1302-102:
Qian et al. 2018a; 3C279: Qian et al. 2019c, 2013 2013;
OJ287: Qian 2018b, 2015 2015, 2019a, 2019b).
The model simulation of the optical light curves are based on two basic
assumptions: (1) the optical outbursts are decomposed into a number of
elementary synchrotron flares (defined as a single flare with smallest
time-scales of 10 days); (2) each elementary synchrotron
flare is produced by an individual superluminal optical knot moving
along helical trajectory via lighthouse effect.
The optical light curves of the periodic outbursts
observed in 1983.0, 1984.1, 1994.6, 2005.7, 2007.8
and 2015.8 and a few non-periodic outbursts were well simulated
in terms of the precessing jet nozzle model. The light curve of the
periodic outburst in 1995.8 was also model-simulated and its simultaneous
optical and radio variations was explained (Qian 2019b).
In our precessing nozzle model we use the following terms to
describe the jet phenomenon: jet, jet-beam, jet-nozzle, beam-axis
and jet axis (precession axis). They describe the picture of jet
phenomenon: the plasma/magnetic-field and superluminal knots ejected
from the jet-nozzle form the jet-beam and the jet-beam precesses
around the precession-axis (i.e. jet-axis) with a period of
12 yr, producing the jet. Since the superluminal knots (both
radio and optical) and magnetized plasma move along helical trajectory
around the precessing beam-axis, the term ”jet” actually represents the
whole jet which is made up of all the magnetized plasma and
superluminal knots ejected from the precessing nozzle. The
plasma/magnetic-field within the jet should be rapidly swirling and
the jet-axis may be also
precessing in space, which has not been taken into account in the
current precessing nozzle model.
In the precessing jet-nozzle scenario, the optical light curves are
assumed to comprise a number of synchrotron subflares for both periodic
and non-periodic outbursts. That is, we assume that the double-peaked
outbursts observed in the optical light curve are synchrotron flares
produced in the relativistic jet
and related to the ejection of superluminal optical knots from the core,
which are closely
related to the mass-accretion onto the primary hole, the rotation
of its magnetized disk, the spin of the primary hole and the magnetic
acceleration mechanism through strong toroidal fields
in its magnetosphere (e.g., Blandford & Znajek 1977 1977, Blandford &
Payne 1982 1982, Li et al.1992 1992, Camenzind 1990 1990, Meier
2013 2013, 2001 2001, Beskin 2010 2010, Vlahakis & Königl
2004 2004) . The precessing jet nozzle model does not treat the
quasi-periodicity in the optical variability and is not able to predict
the flare-times of the periodic outbursts. It requires additional model(s)
for explaining the quasi-periodicity and double-peaked structure, which
can match its interpretation of the quasi-periodic optical
outbursts being synchrotron in origin within the jet.
11
1
Based on the analysis of the kinematics of the
superluminal radio knots, there might have some evidence for the
existence of two jets in OJ287 (Qian 2018b).
In brief, if the quasi-periodicity with double-flare structure observed in
the optical light curve are not involved temporarily, the precessing
nozzle model is different from the binary
black-hole impact model mainly in two aspects:
- •
The disk-impact model assumes that the first flares of the double-peaked outbursts are thermal flares produced by the impacts of the secondary black hole penetrating the disk of the primary hole, when gas-bubbles are torn off the primary disk and emit thermal emission. At the same time, the impacts (near pericenter and apocenter passages) result in strong disturbances to the primary disk. The disturbances and tidal effects lead to enhanced accretion onto the primary hole, producing the follow-up flares (”tidal flares”) which are synchrotron flares produced in the relativistic jet of the primary hole. The difference between the precessing nozzle model and the disk-impact model is only in the interpretation of the nature of radiation from the first flares of the double-peaked outbursts: the former claims their origin from synchrotron process, while the latter claims their origin from bremsstrahlung process;
- •
The impact models involve both thermal and nonthermal flares, it needs dual-energetics for understanding the optical outbursts (thermal and nonthermal). The energy source of the nonthermal flares mainly comes from the spin energy of the primary hole and the angular momentum of its disk. The synchrotron outbursts are strongly Doppler-boosted 22 2 Doppler-amplification factor could be . and their timescales are shortened by Doppler-beaming effect. But the energy source of the impact (thermal) flares mainly comes from the kinematic energy of the orbiting secondary hole. The flux density of the thermal flares is not Doppler-boosted, and their time-scales are not shortened either. Thus the energy source and energetics of the thermal and nonthermal outbursts are completely different. It seems difficult to unify the two kinds of flares (both in flux density scale and time scale) only by scaling the impact energy and impact-induced accretion rate onto the primary hole (e.g. Dey et al. 2018 2018, 2019 2019). In other words, synchrotron flares gain energy-input from the spin of the primary hole and angular momentum of its disk, which is completely different from the energy source for the thermal outbursts. Thus it seems difficult to understand the observational fact: the non-thermal and thermal outbursts observed in OJ287 could have very similar behaviors in variations of flux density and polarization with similar time-scales (e.g. Valtaoja et al. 2000 2000). In contrast, the precessing nozzle model has no problem in the unification of the energetics. Moreover, the impact-disk model seems not able to explain the structure of the optical outbursts which comprise several spike-like flares on timescales of 10 days with symmetric profiles, rapid polarization variation on time scales of a day, and the simultaneous variations in optical and radio regimes (Valtaoja et al. 2000 2000, Qian 2019a, 2019b). Recently, We have applied the precessing nozzle model with helical motion of the superluminal optical knots to well simulate the R- and V-band light curves of the December/2015 outburst (Qian 2019a). In the following we will investigate the polarization behavior (especially the rotations in polarization position angle observed in the periodic outbursts in 1983.0, 2007.8 and 2015.8, providing further evidence for their origin in synchrotron process.
Recently, Myserlis et al. (2018 2018) observed the fast
rotations of polarization position angle in OJ287 at V-band and radio
wavelengths (10.5, 8.4 and 4.8 GHz) during December/2015-January/2017
(JD2457300-800), showing a time-delay of the radio PA rotation
with respect to the optical PA rotation. They suggested that these
position angle rotations (on time-scales of 10 day in optical and
on time-scales of about a month in radio) are due to the
helical motion of the superluminal optical knots and radio knots,
respectively.33
3
Unfortunately, Myserlis et al.’s observation
did not obtain any polarization data for the first flare of the
December/2015 outburst (peaking at JD2457361.5), which was
claimed as the ”impact (thermal)” flare in the impact-disk
scenario. Rotations in polarization position angle were
also observed by Kushwaha et al. (2018a) in the December/2015
outburst. Cohen et al. (2018 2018) have reported observational
evidence for polarization angle rotations in the cm-light
curves observed in the Michigan Monitoring projects.
These polarization observations seem strongly supporting the
precessing nozzle model. According to our precessing nozzle
scenario for explaining the optical light curves of the
quasi-periodic and non-periodic outbursts
(Qian 2019b), superluminal optical knots move along helical
trajectories, which would result in fast rotations of polarization
position angle. This phenomenon has already been observed in
a few blazars in earlier years: for example, in BL Lacertae
and 0727-115 (Aller et al. 1981 1981,
Sillanpää 1993 1993,
Marscher et al. 2008 2008).
In this paper we shall show the rapid variations in polarization
position angle during the periodic optical outbursts (in 1983.0,
2007.8 and 2015.8) and discuss the interpretation of their
light curves of flux density,
polarization degree and position angle as a whole. We would like to
note that low polarization degrees alone do not necessarily imply
the outbursts being thermal, because thermal flares can greatly
reduce the source polarization degree, but can not cause
rapid changes in polarization position angle.
The cavity-accretion flare model proposed by Tanaka (2013 2013)
is another type of disk-impact model, which assumes that the primary hole
and the secondary hole having comparable masses and are in near-coplanar
orbital motion. Hydrodynamic/magneto-hydrodynamic (HD/MHD)
simulations for such binaries surrounded by circumbinary disks
have shown that cavity-accretion processes would create
two gas-flow streams impacting onto the disks of the black holes per
pericenter passages, possibly causing the double-peak structure of the
quasi-periodic outbursts. This model suggests that the gas-flow impacts
produce thermal outbursts, but it is not able to make
accurate timing of the quasi-periodic outbursts.


2 The precessing jet-nozzle model
2.1 Introduction
It is widely suggested that blazars are extragalactic sources with
relativistic jets pointing close to our line of sight.
Recently, Qian (2019a) has
tentatively proposed an alternative jet model to understand the
phenomena observed in OJ287, which is based on the optical multi-wavelength
observation and -ray observation performed for OJ287
(e.g., Kushwaha et el. 2018a, 2018b), combining with
the distinct features previously found in the optical and radio
(flux and polarization) variations (e.g, Sillanpää et al. 1996a,
Valtaoja et al. 2000 2000, Usher 1979 1979, Holmes et al.
1984 1984, Kikuchi et al. 1988 1988, D’Arcangelo et al. 2009 2009,
Kushwaha et al. 2018a, Britzen et al. 2018 2018,
Qian 2019b).
The precessing jet-nozzle model was originally proposed in Qian et al.
(1991a) to study the VLBI-kinematics of the superluminal radio
components observed in QSO 3C345, which were suggested to move along
helical trajectories. This scenario has been further applied to investigate
the VLBI-kinematics of several blazars, including 3C345, 3C454.3, OJ287,
NRAO 150, B 1308+326 and PG 1302-102, 3C279. These studies have not only
made good model-fits to the observed
kinematic properties (trajectory, core-separation and apparent
velocity versus time) of their superluminal radio components, but also
obtained some new results, e.g.,:
(1) Some convincing evidence for the existence of two radio jets
in QSO 279 (Qian et al. 2019c)
(2) Some evidence for the possible existence of two radio jets
in BLO OJ287 (Qian 2018b)
(3) Derivation of the precession period of jet-beams (or jet-nozzles)
and investigation of the
jet-nozzle precession mechanisms (Newtonian-driven precession,
Lense-Thirring effect and spin-orbit coupling;
Qian et al. 2017 2017, 2018a)
(4) Derivation of the kinematic Lorentz (and Doppler) factor and
investigation of the intrinsic evolution of superluminal radio
components (Qian et al. 1996 1996)
(5) Tentative derivation of the mass and spin of black holes in the
nuclei of blazars through precession mechanisms (Qian et al.
2019c, 2017 2017, 2018b)
(6) Interpretation of the simultaneous optical and radio outbursts
observed in OJ287, helping to clarify the nature of quasi-periodic
optical outbursts (Qian 2019b).
2.2 Formulation of the precessing jet nozzle scenario
we have formulated the scenario to calculate the VLBI-kinematics of
superluminal components (optical or radio knots), details referring to
Qian et al. (1991a, 2019a, 2018b, 2017 2017).
We assume that the jet-nozzle ejects magnetized plasma and superluminal
knots (blobs or shocks) which form the collimated jet-beam and move along
helical trajectories around the beam-axis. The jet-nozzle and the
beam-axis precess around an axis fixed in space (designated as the
precession axis) with a certain precession period. The precession of the
jet-beam produces the overall jet which occupies the whole
region where superluminal components and magnetized plasma ejected at
different times move outward in different directions.
44
4
Here we would like to use
three terms (jet-nozzle, jet-beam and jet) to
describe the three physically distinct entities of the jet phenomenon.
We chose the following set of parameters to define the precessing nozzle
scenario which are the same as used in Qian (2019a, 2018b):
(1) Precession axis is defined by parameters =
and = .
(2) The axis of the jet-beam is assumed to be rectilinear described by
the parameters =1 and =0.0402 as in Qian
(2018b). Thus the beam-axis precesses on a cone with an opening
angle of .
(3) The parameters describing the helical motion of a superluminal
optical knot around the beam-axis are: amplitude =0.0138 mas
and rotation rate d/d=-7.04 rad/mas.
(4) The precession phase is chosen to be: =-2.0 rad which
corresponds to the blue line shown in Figure 1.
(5) The spectral index is assumed to be 1.5
()
(6) The base-level flux density at R- and V-bands are assumed to be
=3.5 mJy and 3.0 mJy, respectively
(7) The concordant cosmology model (CDM model) is assumed with
=0.27 and =0.73 and Hubble constant =
71 km (Spergel et al. 2003 2003, Komatsu et al.
2009 2009). Thus for OJ287, z=0.306, its luminosity distance is
=1.58 Gpc (Hogg 1999 1999, Pen 1999 1999) and angular distance
=0.9257 Gpc. Angular scale 1 mas= 4.487 pc and proper motion
1 mas/yr is equivalent to an apparent velocity =19.1 c (c–speed of
the light).
A sketch describing the precessing jet nozzle scenario is shown
in Figure 1, which
was proposed for interpreting the 90 day periodicity in the
light curve of the December/2015 outburst (between the flares in
JD2457360 and JD2457450, Qian 2019a).
In the following we shall make model-simulation for the
flux density light curve of the
2015 outburst in Section 6, decomposing it into 14 elementary synchrotron
flares.
3 Two-component model for polarization analysis
Blazars are highly variable in their optical continuum and especially in
their polarization. Generally, polarization properties are the main
characteristics revealing their nature of synchrotron radiation originated
from the relativistic jets. For blazar OJ287, there may be a major issue
to be solved: whether the first flares of the quasi-periodic optical
outbursts are thermal flares originated from the
secondary hole penetrating into the disc of the primary hole or
they are nonthermal synchrotron flares originated in the jet.
To solve this issue analysis of the polarization properties of the first
flares of the quasi-periodic outbursts observed in OJ287 are important.
According to Qian (2019a) the periodic optical outbursts in OJ287
can be decomposed into a number of
elementary flares, each of which is produced by a superluminal optical
knot moving along a helical trajectory in helical magnetic fields
due to lighthouse effect.
This explanation naturally predicts
that their polarization position angle should rotate during the helical
motion. PA rotations have been observed in a few blazars on timescales
of 10 day in optical bands (Aller et al. 1981 1981,
Sillanpää et al. 1993 1993, Marscher et al. 2008 2008)
or about a month in radio bands (Aller et al. 1981 1981, 2014 2014,
Königl & Choudhuli 1985a). Mechanisms
for explaining these large-amplitude PA rotations
have been suggested (e.g., Blandford & Königl 1979 1979,
Königl & Choudhuli 1985b, Bjönrson 1982 1982, Qian & Zhang
2003 2003, Qian 1993 1993, 1992 1992). Most of the studies
prefer the mechanisms in
which PA rotations are caused by relativistic shocks moving through helical
magnetic fields or the composition of two polarized components.
In order to analyze the polarization properties, especially the
rotation of the polarization position angle of the quasi-periodic outbursts
observed in blazar OJ287, we will apply a simple method to investigate
the polarization behavior
of three periodic optical outbursts in 1983.0, 2007.8 and 2015.8
in terms of two
component model (Qian et al. 1991b, Qian 1993 1993):
one steady component (or underlying quiescent jet component)
and one variable component (burst component).
Both are polarized synchrotron components.
Assuming (, , ), (, , ) and
(, , being the intensity, polarization degree (%)
and polarization position angle (deg.) of the integrated
outburst, component-1 and component-2, respectively, then we have
| (1) |
| (2) |
Stokes parameters (, ) are
| (3) |
| (4) |
Similar equations are for (, ) and (, ). In our case (, , ) are known, () will be appropriately chosen, then = is known. Only two parameters and need to be determined. And equations (1) and (2) are just sufficient to solve the two parameters.
4 Model simulation of polarization behavior for 1983.0 outburst
As shown above the polarization behavior of
the periodic optical flares is a key ingredient to determine the nature of
optical outbursts, distinguishing the relativistic models from the
disk-impact models. Therefore we will make model simulation of the light
curves of flux density, polarization degree and polarization position
angle (as a whole) for three periodic optical outbursts in 1983.0, 2007.8
and 2105.8.
For the outbursts in 1983.0 and 2007.8 very low polarization degrees
(0.4%-2.4%) were observed, and both outbursts were claimed
to be thermal flares produced by the bubbles
torn off the disk of the primary hole when the secondary hole penetrates
into the primary disk. However, alternative interpretations are also
possible. For example, a non-thermal (synchrotron) flare can also
cause very low polarization degree if the non-thermal flare component has
its direction of polarization nearly perpendicular to that of the
preexisting polarized component with similar polarized flux. But in this
case rapid variations in polarization position angle of the source
would be observed. Thus changes in polarization position angle may be
particularly important for distinguishing non-thermal flares from
thermal flares.
4.1 Introduction
The 1983.0 optical outburst is an instructive event for understanding
the nature of the periodic outbursts and distinguishing different models.
The multi-waveband observations from IR (JHK) to optical (RVU) carried
out by Holmes et al. (1984 1984, also Smith et al. 1987 1987)
have provided full information about the flux density, polarization degree
and polarization position angle during a 4-day period (7, 8, 9 and 10
January, 1983), which
was just coincided with the peaking period of the outburst. A model
simulation of its flux density light curve (V-band) is shown in
Figure 2 (left panel), and the right panel shows the fits to the
data-points obtained during the 4-day peaking period (at V- and R-bands).
Some distinct features can be recapitulated : (1) The outburst peaked on
8 January, with very low polarization degrees of 0.4% and 0.8% at
R- and V-bands, respectively; (2) The minimum polarization degrees at R-
and V-band are concurrent with the peaks of flux density (see
left panels of Figure 3);
(3) position angles at R- and V-band
rotated, especially at V-band: during the 3 day period (7, 8
and 9 Jan.) its polarization position angle rotated clockwise by
and then rotated counter-clockwise by
(see left/bottom panel of Figure 3); (4)
The multi-frequency observations showed that the outburst had convex
spectra with a change in spectral index 0.4
from infrared (0.9) to optical (1.3).
Interestingly, the observed features-1 and -2 are just the
characteristics of a thermal outburst required by the impact-disk
model. But feature-3 (polarization position angle swing) does not support
the model, because a thermal outburst can not cause large position angle
swing. Feature-4 indicates that the observed spectra
are more complex than that of a thermal outburst as predicted by
the impact-disk model and very much like that of a synchrotron source
with high-frequency steepening due to radiation losses.
Therefore, as a whole, the multi-wavelength light curves observed
for the 1983.0 outburst (including
flux density, polarization degree and polarization position angle)
can not be explained
in terms of the appearance of a strong thermal outburst.


Holmes et al. (1984 1984) proposed a two component model to explain
the observed multi-wavelength light curves of flux density,
polarization degree and position angle as a whole.
They suggested that the two variable synchrotron (polarized)
components are optically thin, having similar fluxes and polarization
degrees (or similar polarized fluxes),
but their position angles are different by near ,
thus the superposition of the two components leads to the resultant
very low polarization degrees. More interestingly, they found that
the two components
are physically connected in the jet: one had a stable position angle
while the other exhibited a gradual rotation in position angle.
They argued that the observed behavior of position angle rotation
may be due to the physical rotation of the magnetic field.
The detailed modeling of the multi-wavelength light curves (especially
the wavelength-dependent polarization) performed by Holmes et al.
demonstrates that the 1983.0 periodic optical outburst
is synchrotron in origin, consistent with the assumptions of our
precessing nozzle scenario (Qian 2019a, 2018b).
Although Holmes et al. used a two-component model to simulate the
integrated light curves of flux density, polarization degree and
position angle, they did not give the modeled light curves specifically
for the variable polarized component (or the flare component). In
addition, the rotation rate obtained for the component with variable
position angle was less than /day, which is much
smaller than the values observed for the integrated polarization position
angle. This result seems inappropriately describing the polarization
behavior of the component with variable position angle.
In the following we will propose an
alternative two-component model to explain the observed features of
the 1983.0 outburst, concretely showing the position angle rotation
and the Stokes Q-U plot of the flare component.
4.2 An alternative model
We suggest an alternative two-component model as follows.
We assume that the outburst consists of two polarized components defined
by () and () respectively (see
Section 3). The vector combination of the two components forms the
observed (integrated)
polarized outburst described by (). Since polarization
observations in blazars usually show that just before the beginning
or/and just after the end of outbursts the position angle keeps to be
very near their preferred directions (e.g. in BL Lacertae,
Sillanpää et al. 1993 1993), we will choose the steady component
to be the underlying quiescent jet component before the
outburst. According to Holmes et al. component-1
has a stable position angle . Its polarization
degree is constrained by the very low polarization
degrees observed at R-band (0.4%) and V-band (0.8%). Its intensity
is chosen according to the model simulation
of the V-band light curve and the spectral index =0.8
(Qian 2019a). Thus we take:
R-band: =5.7mJy, =0.58%,
V-band: =5.0mJy, =1.0 %,
Having these values for the component-1, the values of
()
for the component-2 (the outburst component) can be determined
from solving the equations (1) and (2) given in Section 3.
The left panels of Figure 3 show the light curves of integrated flux
density, polarization degree and polarization position angle. The
modeled light curves for the flare component are shown in the right
panels. Note that the flare component has similar rotation rates
(/day clockwise) at R- and V-bands during
the 4 day period.
It is instructive that the flare
component has minimal polarization degrees corresponding to its flux
peaks in R- and V-bands (Figure 3, right/middle panel),
having large position angle rotations during the peaking period. This
behavior is similar to that of a superluminal knot moving along a
force-free helical field (m=1 mode) proposed by Königl & Choudhuri
(e.g. for the PA swing in radio
wavebands observed in 0727-115,1985a, 1985b; Aller et al.
1981 1981; also Qian & Zhang 2003 2003, Qian 1992 1992),
in which relativistic aberration leads to position angle swings
(of and more) for a single flaring component
(a relativistic shock). In addition, in the present case, there
should exist a dominated random field component and the observer’s
direction in the shock frame should be nearly perpendicular to the
shock front to produce its very low polarization degrees
at R- and V-bands (Laing 1980 1980).
For comparison we note that similar polarization behaviors
in optical regime have been
observed in BL Lac: Sillanpää et al. (1993 1993) observed
an event of large polarization position angle swing during
26 September - 1 October 1989, having a minimal polarization degree of
3.6% (V-band), while Marscher et al. (2008 2008)
observed a large position angle swing of
during 2005.81-2005.83,
having minimal polarization degrees of 2-3%. The very low
polarization degrees revealed in both events combined with the
position angle swings were interpreted in terms of relativistic
shocks propagating along helical magnetic fields. In particular,
Marscher et al. found that the
large position angle swing occurred when a superluminal knot moving
through the VLBI core. This association indisputably demonstrates that
the low polarization degree and position angle swing are produced in
the jet.
Finally, we would like to point out that the assumed and resultant
values obtained in the model simulation are by no means unique and more
elaborate models are still required for explaining the entire event,
especially taking its multi-wavelength spectral properties into
consideration.
4.3 Stokes QU-plots
Tracks of the Stokes parameters Q and U for the 1983.0 outburst
are shown in Figure 4. Q-U tracks for the integrated polarization
and the flare component are shown in the left and right
panels, respectively. It can be seen that after reducing the background
component, the Q-U track of the flare component reveals its position
angle rotation more clearly.
5 Simulation of polarization behavior for 2007.8 outburst
5.1 Introduction
Villforth et al. (2010 2010) have made optical observations to study
the polarization behavior of the periodic optical outburst in 2007.8.
This outburst showed a very low polarization degree (2.4%, R-band
at JD2454356.75, near the peak of the outburst) and was thus
claimed to be the impact thermal flare predicted by the disk-impact
model.
We have collected the data given in Villforth et al. (2010 2010)
to investigate its polarization behavior. A model-fit to its
light curve in terms of the precessing nozzle model is shown in Figure 5
(left panel), which is reproduced from Qian (2019a). The right
panel represents part of the observed light curve where only the
flux densities corresponding to the polarization measurements are shown.
The observed (integrated) light curves (during JD2454353.5-366) of
flux density, polarization degree and polarization
position angle are presented in the left panels of Figure 6. It can be
seen that during the peaking stage of the outburst
(JD2454356.5-361.5)
a large position angle swing was clearly revealed: first a clockwise
rotation of and then a counter-clockwise rotation
of , forming a ”trough” in the light curve of
position angle. Obviously, this large position angle swing is a distinct
feature of the 2007.8 outburst as for the 1983.0 outburst, which should
not be neglected and certainly demonstrate the outburst being
synchrotron in origin.
It worths noting that the very low polarization degree (2.4%, at
JD2454356.75) occurred earlier than the flux density peak
(JD2454357.5) by a day, where the position angle only slightly
changed. Thus the relations between the variation in flux density and
polarization degree or position angle are quite complex, which can not
be explained in terms of the disk-impact model.
Here we suggest a two-component model to simulate the observed
light curves of flux density, polarization degree and position angle
as a whole.
5.2 A two-component model for 2007.8 outburst
We assume that the outburst in 2007.7 consists of two polarized
components: one steady component-1 defined by the underlying quiescent
jet background before the outburst and a variable flare
component-2, which are described by parameters () and
(), respectively. the values for ()
are chosen as
=7.5 mJy, =8.5%,
The value of is constrained by the low polarization degree (2.4%)
observed at JD2454356.75, when the position angle only
slightly changed. The value of is chosen
from the model simulation of the light curve (Qian 2019a).
Having given the values of , we can derive the modeled
light curves of flux density, polarization degree and position angle for
the flaring component () from solving the
equations (1) and (2) given in Section 3.
The model simulation results are shown in Figure 6 (right column). It can
be seen that the model-derived polarization degree of the flare component
(component-2) is quite moderlate during the peaking stage
(JD2454356-2454361), reaching 10% (middle panel).
The rotation of the polarization position angle
during this period is not uniform with a mean rate of
/day. The maximum rate of /day
occurred at the beginning of the outburst (bottom panel).


5.3 QU-plots
The QU-plot during the period of JD2454354.5-360.5 for the integrated outburst is shown in Figure 7 (left panel). The QU-track derived for the flare-component (right panel) is similar to that of the integrated outburst. Both QU-tracks reveal large position angle rotations, showing the nature of synchrotron emission of the 2007.8 outburst.
6 Model simulation of the light curves of periodic optical outburst in December/2015
6.1 Introduction
The first flare of the quasi-periodic optical outburst observed
in December/2015 (during the period of 2015.88-2015.96 with
its peak at 2015.926) was identified as an unpolarized thermal
flare predicted by the disk-impact model (Lehto & Valtonen 1996 1996,
Valtonen et al. 2019 2019, Dey et al. 2019 2019).
This interpretation is mainly based on the accurate timing of the
orbital motion of the putative black-hole binary in the nucleus of OJ287,
where the secondary black-hole penetrates the disk of the primary hole
twice per one orbital cycle, causing the quasi-periodic optical outbursts
with double structure through the bubble-production mechanism.
The low polarization degrees observed in the first flares of
a few periodic outbursts were regarded as firm evidence for
their thermal origin.
However, there are some distinct features observed in the December/2015
outburst and in other periodic outbursts could not be explained
in terms of the impact-disk model. Relativistic jet models may be
required, suggesting that these periodic outbursts could be
synchrotron in origin. For example,
- •
(1) For the December/2015 outburst, Kushwaha et al. (2018a) observed that a GeV -ray flare was simultaneous with the optical flares at R- and V-bands, peaking concurrently at 2015.96 (JD2457361.5). Obviously, the -ray flare could not be co-spatial and associated with the thermal flare produced by the bubble torn off the disk of the primary hole. Both the -ray and optical flares should be produced in the relativistic jet through synchrotron/inverse-Compton mechanism as in generic blazars.
- •
(2) The multi-wavelength (J, I, R, V, UV) light curves of the December/2015 outburst are very similar to that of the strongly polarized synchrotron flare occurred in March/2016 (peaking at JD2457450). This similarity might imply that the December/2015 optical outburst is synchrotron in origin and this pair of outbursts could be interpreted in terms of the helical motion of a superluminal optical knot through two helical cycles via lighthouse effect, having a period of 90 days (see right/upper panel of Fig.1; Qian 2019a);
- •
(3) Generally, the light curves of the periodic optical outbursts consist of a number of subbursts or elementary flares, each having a symmetric profile, similar to the individual (isolated) non-periodic synchrotron flares occurred during the intervening periods (e.g., Valtaoja et al. 2000 2000, Qian 2019b). Symmetry in the outburst profiles seems a significant feature (Sillanpää et al. 1996a, 1996b) different from the standard non-symmetric profiles of the thermal outbursts predicted by the disk-impact model (Valtonen et al. 2011 2011 ). Symmetric profiles are suggested to be explained in terms of the lighthouse model under the precessing jet-nozzle scenario proposed by Qian et al. (2019a).
- •
(4) The variability behavior of optical polarization (especially polarization position angle) of the periodic optical outbursts seems particularly important for determining the origin of the emission from the outbursts. For example, a low-polarization degree can be due to the appearance of a thermal outburst, but can also be caused by the appearance of a synchrotron flare which has its polarization perpendicular to that of the preexisting steady synchrotron component with a similar polarized flux. In this case large changes in polarization position angle should occur. The studies of the polarization behavior for the optical outbursts in 1983.0 and 2007.8 (Holmes et al. 1984 1984, D’Arcangelo et al. 2009 2009, Qian 2019b, and this paper (Sections 4 and 5) indicate that these outbursts may be synchrotron flares. In section 6 we will investigate the polarization behavior of the first flare of the December/2015 outburst in detail.
- •
(5) Some periodic optical outbursts have been observed to exhibit simultaneous radio variations. The 1995.9 optical flare is the best example: Valtaoja et al. (2000 2000) observed the simultaneous optical and radio (at 22 and 37GHz) flares, having similar substructures and envelopes. Obviously, at least this periodic optical outburst must be synchrotron in origin and related to the relativistic jet (Qian 2019b). In general, both the connection between the optical and radio variations and the close correlation between the optical outbursts and the ejection of superluminal radio components from the core may indicate that the optical flares (both periodic and non-periodic) are synchrotron flares (Tateyama et al. 1999 1999, Kikuchi et al. 1988 1988, Britzen et al. 2018 2018, Qian 2018b).
- •
(6) The multi-wavelength optical observations of the December/2015 outburst show its color stability (Gupta et al. 2016 2016), which is consistent with the monitoring results of OJ-94 project during the period 1993.8-1996.1 (Takalo 1996a, Takalo et al. 1996b, Sillanpää et al. 1996a, 1996b). During the OJ-94 project of 2.5yr time-range both periodic outbursts (the pair of flares in 1994.59 and 1995.81) and a large number of non-periodic synchrotron flares were observed, indicating that the periodic and non-periodic outbursts may originate from similar emission process. Otherwise how could we explain the periodic and non-periodic outbursts having similar optical spectrum (Sillanpää 1996a, 1996b). Obviously, the color stability is difficult to be explained in the impact-disk model.
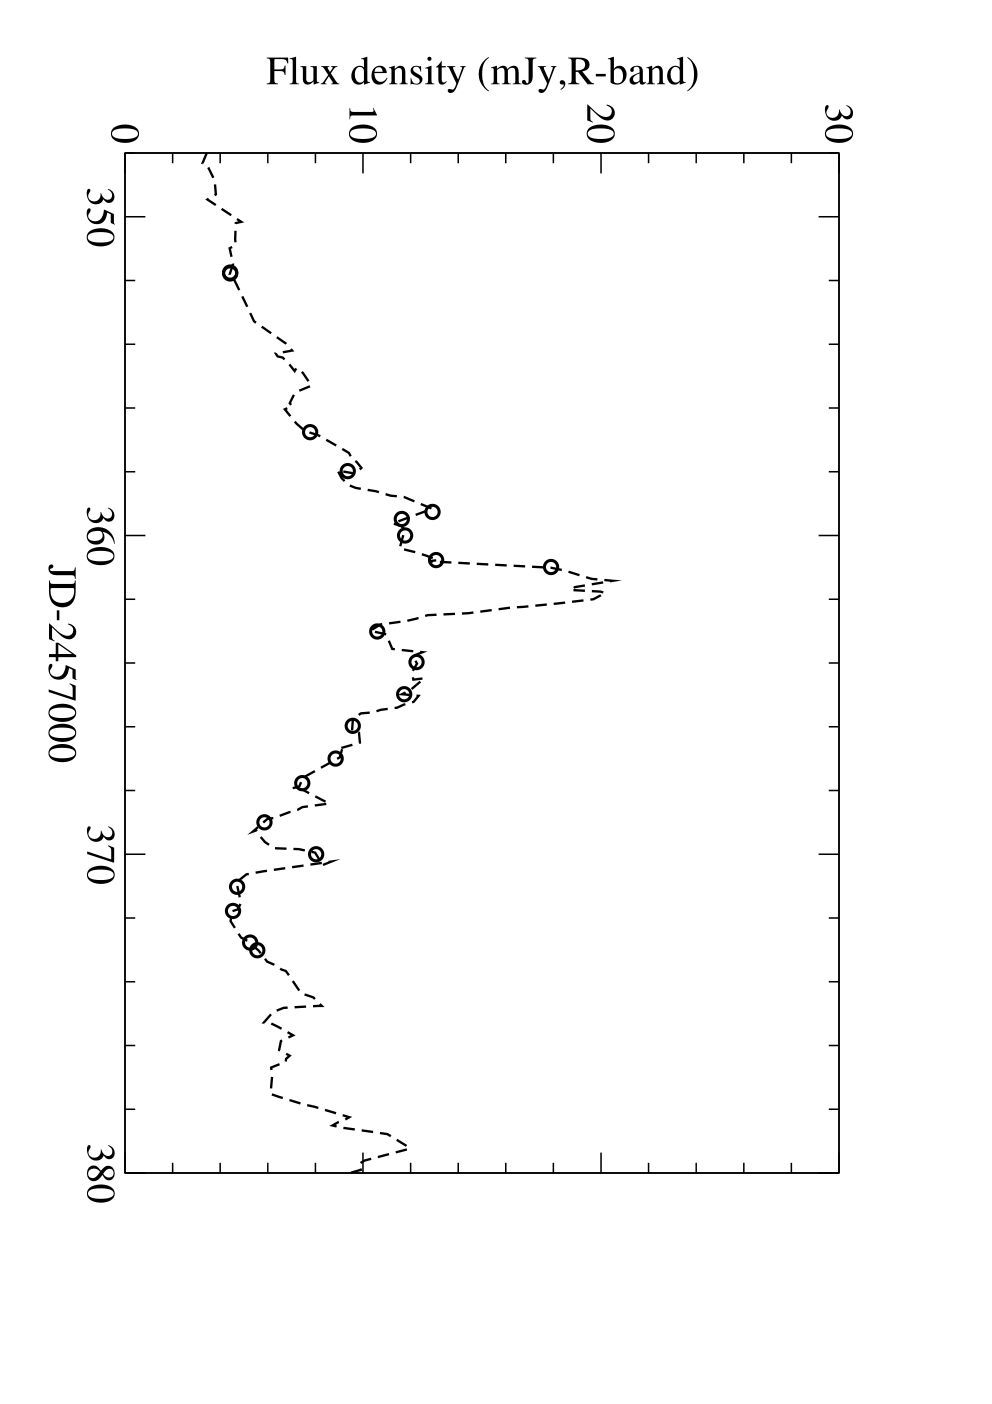
In order to clarify the nature of the quasi-periodic optical outburst observed in December/2015, we have collected some polarization data from the literature (Myserlis et al. 2018 2018, Kushwaha et al. 2018a, Valtonen et al. 2016 2016, 2017 2017, 2019 2019) for investigating its polarization behavior (especially the rotation in polarization position angle of the flaring component) and showing that the helical-motion model proposed by Qian (2019a) may be appropriate to interpret its light curves of flux density, polarization degree and polarization position angle as a whole.


6.2 Internal structure and symmetry in flare-profiles
It has been proposed that the optical outbursts observed in blazar
OJ287 may consist of a number of elementary-flares with symmetric
profiles (Qian 2019a). The light curves of the
December/2015 outburst observed at V- and R-bands are shown in Figures
8 and 9.
By visual inspection of the light curves some characteristic features
can be seen:
- •
(1) The December/2015 outburst consists of two flares: the first flare (during JD2457350-372) and the second flare (during JD2457372-385). Both have internal substructures. The first flare has a central strong spike between JD2457360.5 and JD2457362.5 (peaking at JD2457361.5) with weaker wing bursts on its either side. Although the lower portion of the spike blends with the wing bursts, the smooth and almost completely-recorded light curve of its upper portion seems demonstrating that this spike flare is an individual elementary flare with a timescale of 6 days (see below). Moreover, this strong spike-flare clearly has a symmetric profile relative to its peaking time (see the red lines in Figures 8 and 9: flux density ).
- •
(2) In Figures 8 and 9 the modeled curves for the wing flares are shown in green (for both the rising and declining portions), which are also symmetric relative to the peaking time of the central spike: flux density . It is quite clear that the wing flares are individual flares independent of the spike flare, because their slopes of the respective rising and declining portions (during JD2457348.0-360.5 and during JD2457363.9-375.1, respectively) are much smaller than the rising and declining slopes of the spike flare (during JD2457360.5-362.5).
- •
(3) The second flare peaking at JD2457379.2 has an internal substructures similar to that of the first flare: a strong central spike with weaker wing flares on its either side, but having a longer time scale. The sipke flare also has a symmetric profile relative to the peaking epoch. The smooth and almost fully-observed light curve pattern also demonstrates that this central relatively strong spike is an individual elementary flare with a timescale of 7 days, independent from the wing flares. The model-simulation results for the second flare and its characteristic features can be seen in Figure 10.
The detailed analysis of the structure of the observed light curves
for the December/2015 outburst given above may have provided
more evidence than before that this optical outburst actually
comprise a number of elementary flares.
It is particularly important that these elementary flares have
symmetric profiles as clearly seen in the strong central spike flares
(peaking at JD2457361.5 and JD2457379.2) which have been
fully recorded at both R- and V-bands (Valtonen et al. 2019 2019,
Kushwaha et al. 2018a). It is known that some single
(or individual) non-periodic (synchrotron) flares also exhibit
symmetric profiles (Qian 2019a). These investigations lead us to
the conclusion that symmetry in the elementary flare profiles
is a general property of the outbursts (both periodic and non-periodic)
observed in OJ287.
In the precessing jet-nozzle scenario proposed by Qian (2019a)
to model-simulate the light curves of the December/2015 optical outburst,
its structure consisting of elementary flares and
their symmetric profiles are the two basic ingredients, which ensure
the observed flux-density light curves to be explained in terms of the
helical motion of discrete superluminal
optical knots (shocks or blobs) in the relativistic jet via
lighthouse effect. In Subsection 6.4 below, we will further investigate
the optical polarization behavior of the first flare (during
JD2457350-370) of the December/2015 outburst for trying to find
out the true nature of its optical emission.


Moreover, the first and secondary flares of the
December/2015 outburst have similar internal structures:
a central strong spike-like flare with a symmetric profile and
weaker wing flares on either side. Two kind of explanations might be
proposed: (1) If the first and second flares are independent, then they
could be discrete relativistic shocks produced in the jet consisting of
a shock-front component (causing the strong spike-like flare)
and a weaker wake component (causing the wing flares); (2) If the
first and second flares are physically related, they could be a pair
of relativistic shocks (both forward and reverse) formed in the collision
of relativistic flows in the jet, leading to concurrent outbursts.
In this case there would be four emitting regions naturally formed:
two shock fronts and two (weaker) wake regions
(Bell 1978a, 1978b, Rees 1978 1978, Kong et al.
1982 1982, Hughes et al. 1985 1985, 2011 2011, Lind & Blandford
1985 1985, Carilli et al. 1988 1988, Cawthorne & Wardle 1988 1988,
Gmez et al. 1994a, 1994b, Cohen et al.
2018 2018). This structure of a pair
of shocks might be just sufficient to explain the structure of the
December/2015: the two shock fronts produce the two strong spike-like
flares, while the two wakes produce the wing
flares between the two spikes (during JD2457363-377).
In both the cases suggested above, the December/2015 outburst would be
produced via lighthouse effect, when the multiple emitting regions
tend to form a stable structure moving along a helical trajectory in the
acceleration-collimation zone of the relativistic jet in OJ287
(Camenzind 1993 1993, Camenzind & Krockenberger 1992 1992,
Schramm et al. 1993 1993, Wagner et al. 1995 1995, Dreissigacker
1996a, Dreissigacker & Camenzind 1996b). In addition,
there might be also emitting regions formed in front of
the forward shocks and/or the reverse shocks due to some kind of
flow instabilities, which might be required to help explain the formation
of the wing flares at the beginning and at the end of the December/2015
outburst.
The proposed interpretation is only a speculative scenario, detailed
theoretical models are required to specifically investigate the model
parameters involved for the formation of a pair of
shock-wake structures in the
collision of relativistic flows in OJ287 (e.g., Kong et al. 1982 1982).
We would like to note that
the Lorentz factors =14 and 13 adopted in the simulation
of the flux light curves respectively for the first and second flares
are quite close to those derived from centimeter/millimeter variability
and VLBI-imaging studies for OJ287: =15.3 (Aller et al.
2014 2014) , 15.1 (Lister et al. 2013 2013),
16.3 (Jorstad et al. 2005 2005).
| epoch | |||||
|---|---|---|---|---|---|
| 353.55 | 14.0 | 1.20 | 1.53 | 3.84(-7) | 4.92(-7) |
| 355.07 | 14.0 | 3.04 | 3.90 | 9.78(-7) | 1.25(-6) |
| 357.27 | 14.0 | 4.02 | 5.16 | 1.29(-6) | 1.66(-6) |
| 359.17 | 14.0 | 5.51 | 7.06 | 1.77(-6) | 2.27(-6) |
| 361.55 | 14.0 | 12.5 | 16.0 | 4.02(-6) | 5.15(-6) |
| 363.84 | 14.0 | 7.07 | 9.06 | 2.27(-6) | 2.91(-6) |
| 365.44 | 14.9 | 5.06 | 6.48 | 1.63(-6) | 2.09(-6) |
| 367.18 | 14.0 | 3.38 | 4.33 | 1.09(-6) | 1.39(-6) |
| 368.33 | 14.0 | 1.41 | 1.81 | 4.54(-7) | 5.81(-7) |
| 370.08 | 14.0 | 3.26 | 4.18 | 1.05(-6) | 1.34(-6) |
| 373.97 | 13.0 | 2.64 | 3.38 | 1.18(-6) | 1.51(-6) |
| 376.07 | 13.0 | 1.98 | 2.53 | 8.84(-7) | 1.13(-6) |
| 379.17 | 13.0 | 6.35 | 8.14 | 2.84(-6) | 3.63(-6) |
| 382.67 | 13.0 | 1.32 | 1.69 | 5.91(-7) | 7.56(-7) |
6.3 Model simulation of flux density light curves
We first discuss the model-simulation results of the flux light curves
observed at V- and R-bands in terms of the precessing nozzle model.
In comparison with the previous simulation (Qian2019a), here
we have taken into account of the internal structure of the
December/2015 outburst.
The modeling results are shown in Figures 10 and 11, and Table 1.
The December/2015 optical outburst has been assumed to comprise
a number of elementary flares, each of which is produced by a superluminal
optical knot moving along a helical trajectory via lighthouse effect.
14 elementary flares are used to simulate the observed light curves
at V- and R-bands (see Figure 10 and Table 1). The modeled flux density
profile, Lorentz/Doppler factor, apparent velocity and viewing angle
versus time for the central strong spike-like flares are given in
Figure 11. We emphasize that the two spike flares (during
JD2457359-364 and JD2457376-384) are very well fitted by
the model-simulated symmetric profiles (see Figure 10).
The similarity in structure (strong spike with wing bursts) of
the first flare and the second flare for the
December/2015 outburst may be also in favor of the suggestion that
the first flare is also a synchrotron flare as like the second flare,
which was observed to have a very high polarization degree (40%).
The low polarization degree of 5-6% during the first flare
may be a result due to composition of two or more polarized components
(see below).


6.4 Polarization behavior of the December/2015 outburst
Investigating the polarization behavior of the periodic optical outbursts
in 1983.0 and 2007.8 in Sections 4 and 5, we argued that the
polarization behavior (including the light curves of flux density,
polarization degree and position angle) of the
periodic optical outbursts may be most important for identifying
the nature of their optical emission (thermal or nonthermal), and
the rapid large position angle swings during the outbursts
may become the decisive factor.
In order to clarify the nature of optical emission of the December/2015
outburst, we shall use a two-component model to study the light curves of
flux, polarization degree and position angle of its first flare
(during JD2457350-374) as a whole.
It will be shown that its polarization behavior (especially the
rotation of the position angle) demonstrates its synchrotron in origin.
6.4.1 Measurements of polarization position angle from different authors
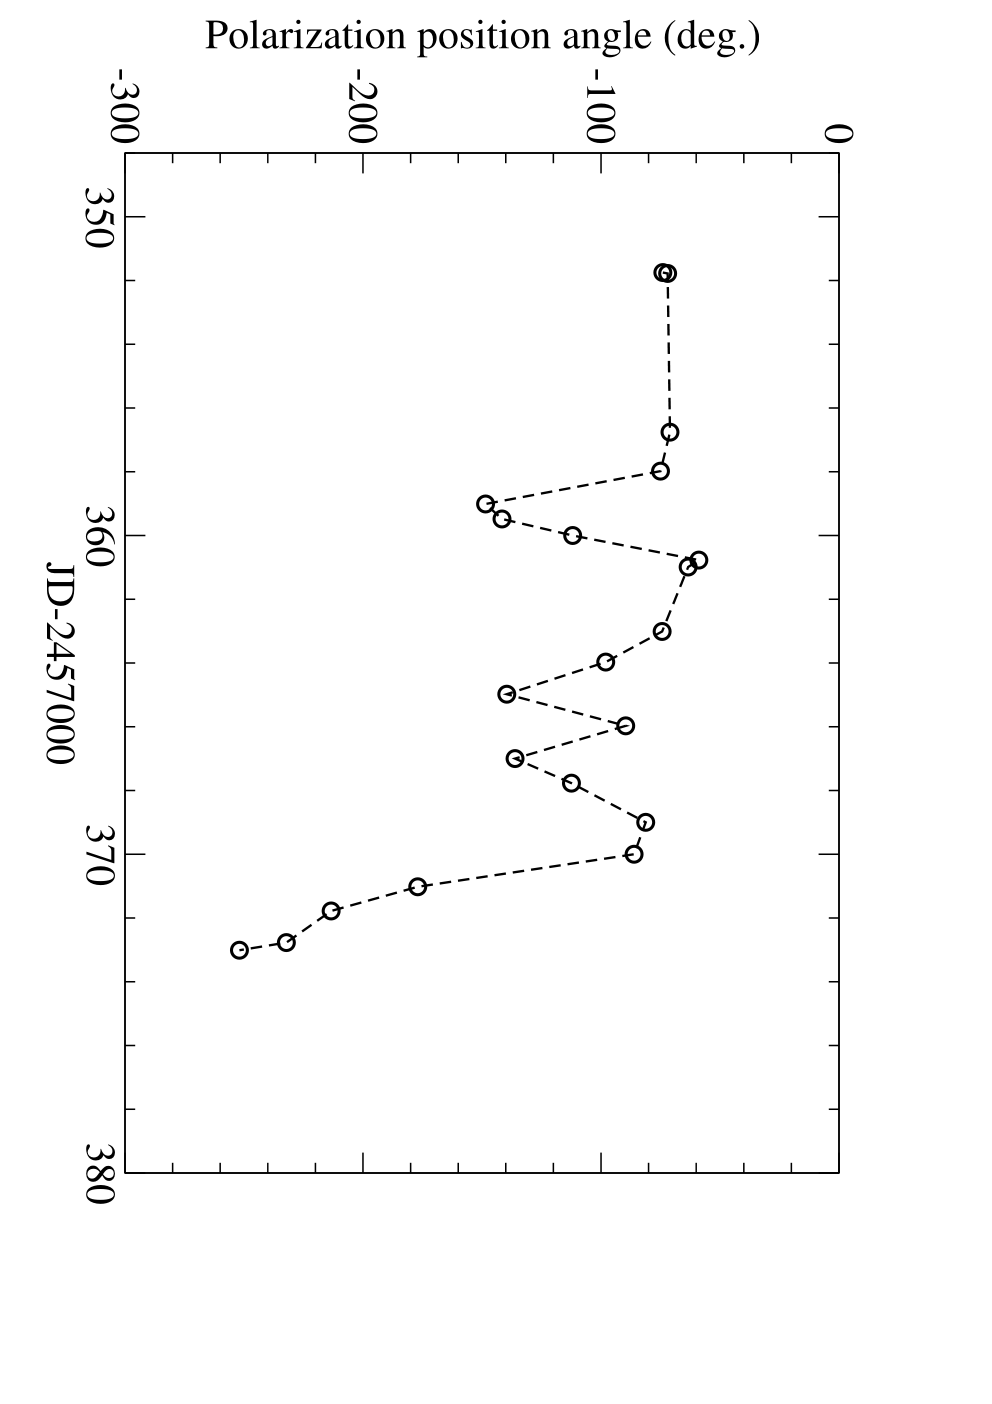
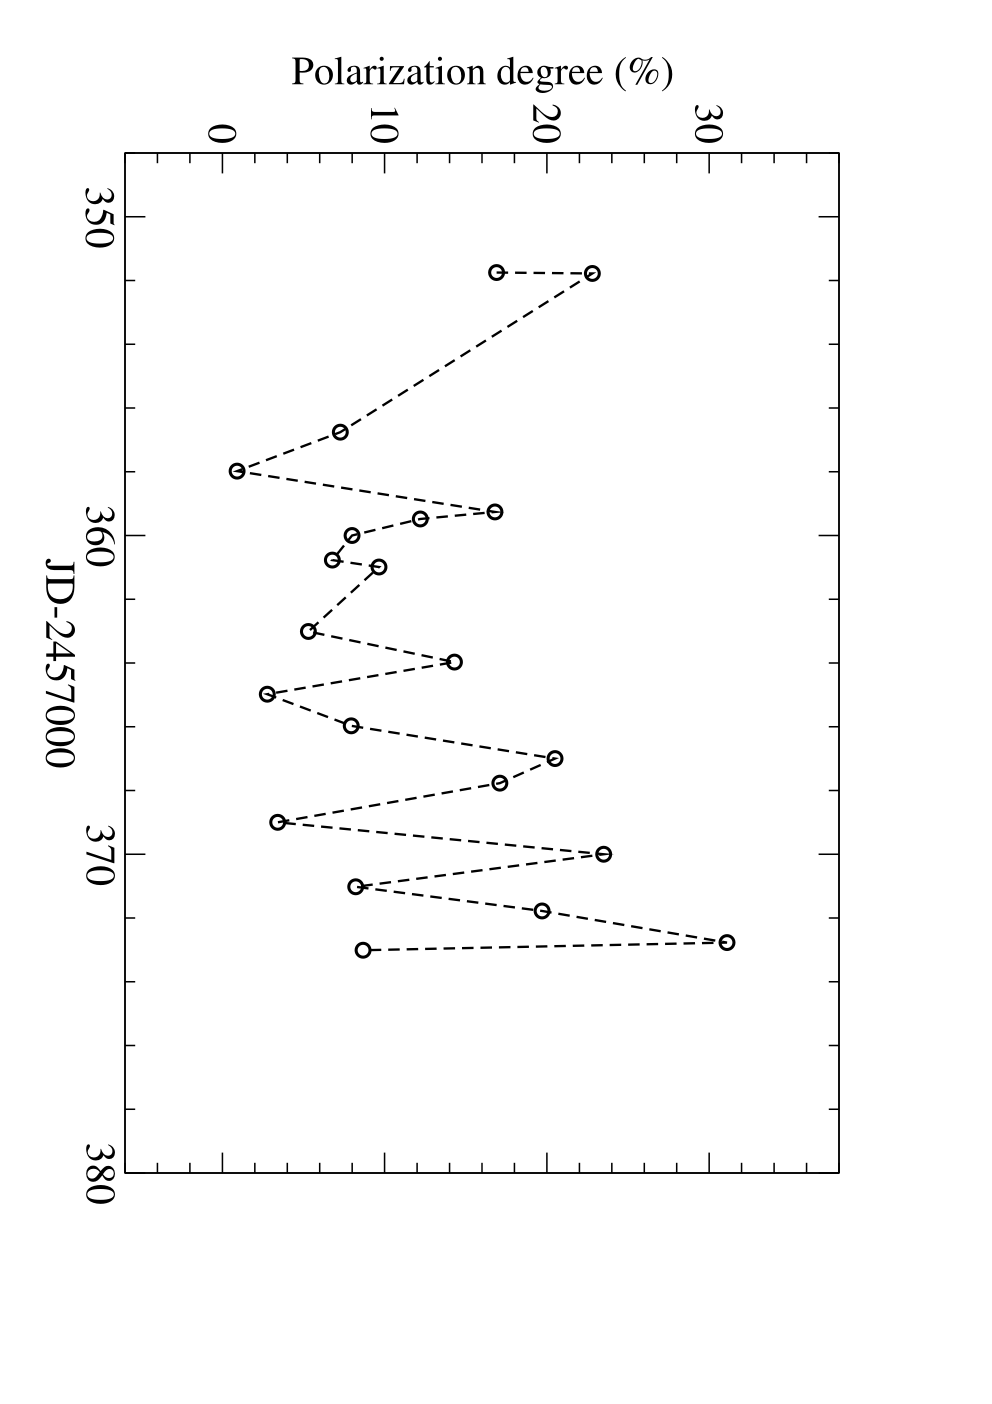
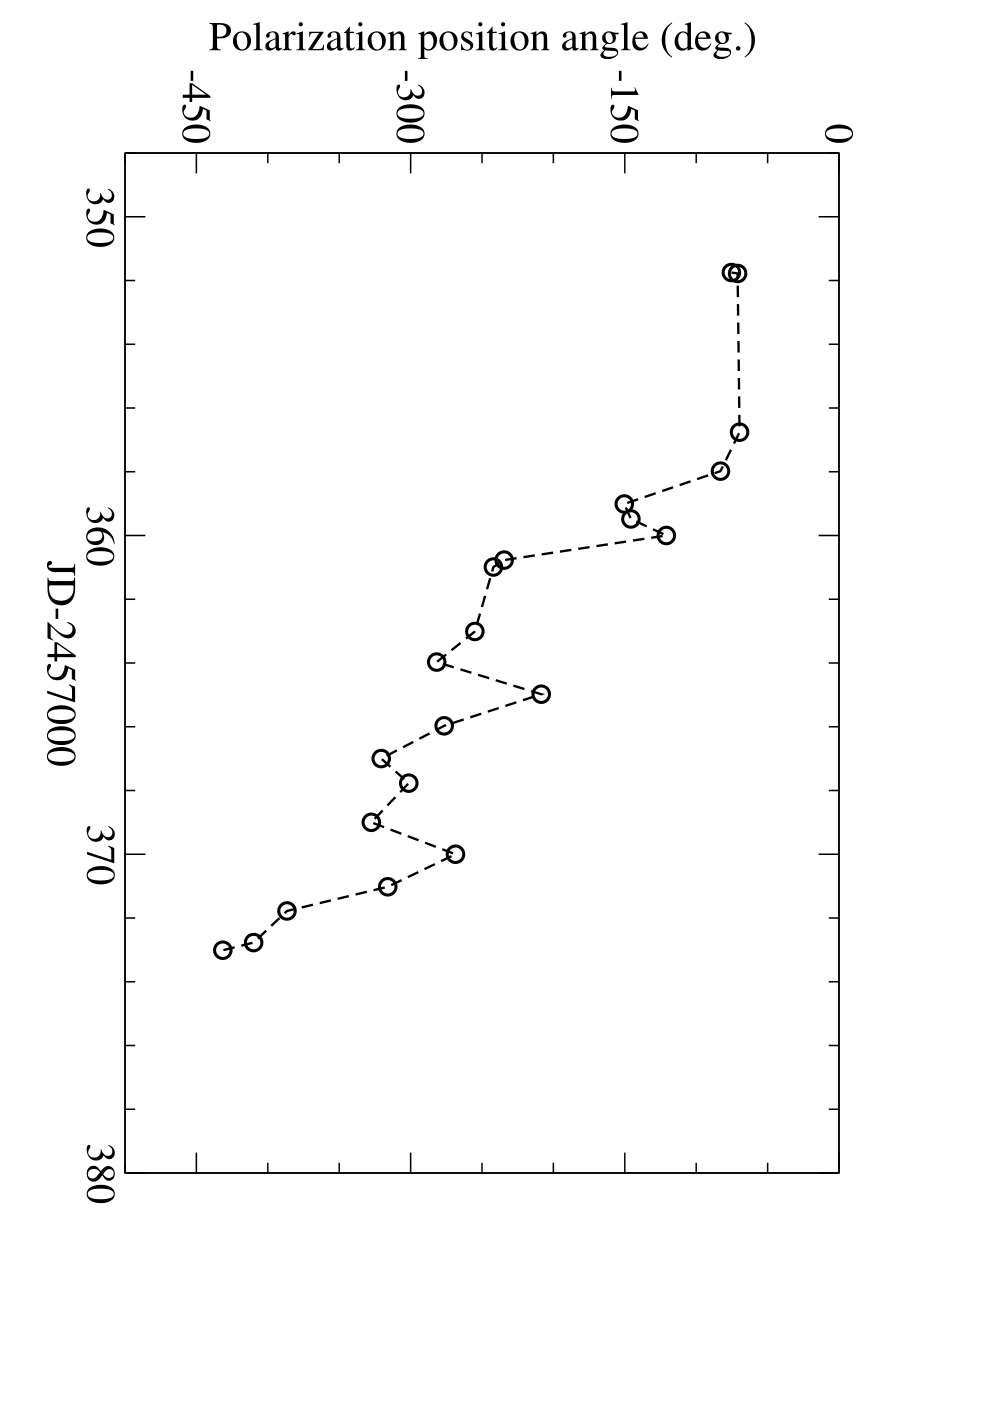
We have collected some observational data on the polarization position angle (during JD2457336-374; the first flare of the December/2015 outburst), which are shown in Figure 12. The upper panel shows the comparison between the measurements by Kushwaha et al. (2018a; R-band) and Valtonen et al. (2017 2017; R-band). The lower panel shows the comparison between the measurements by Myserlis et al. (2018 2018; V-band) and Valtonen et al. (2017 2017; R-band). These measurements at R- and V-bands are well consistent: especially the large position angle swing during the period JD2457370-374. Additionally, there is a large position angle swing clockwise () first (during JD2457358-359) and then counter-clockwise () during JD2457359-362. Note that this CCW position angle rotation appeared near the peak of the first spike-flare. 55 5 The pair of clockwise and counter-clockwise rotations will be alternatively interpreted as a continuous clockwise rotation by introducing an ambiguity of (see Figure 14: left column/bottom panel). The measured values of position angle at JD2457371.8, JD2457372.8 and 2457373.0 from Valtonen et al. also have been added by for matching with the measurements by Kushwaha et al. and Myserlis et al.









6.4.2 A two component model
Now we turn to make model simulation of the light-curves for the first
flare of the December/2015 outburst.
We have already seen in the last subsection that large swings in
position angle were observed in this flare. Its integrated polarization
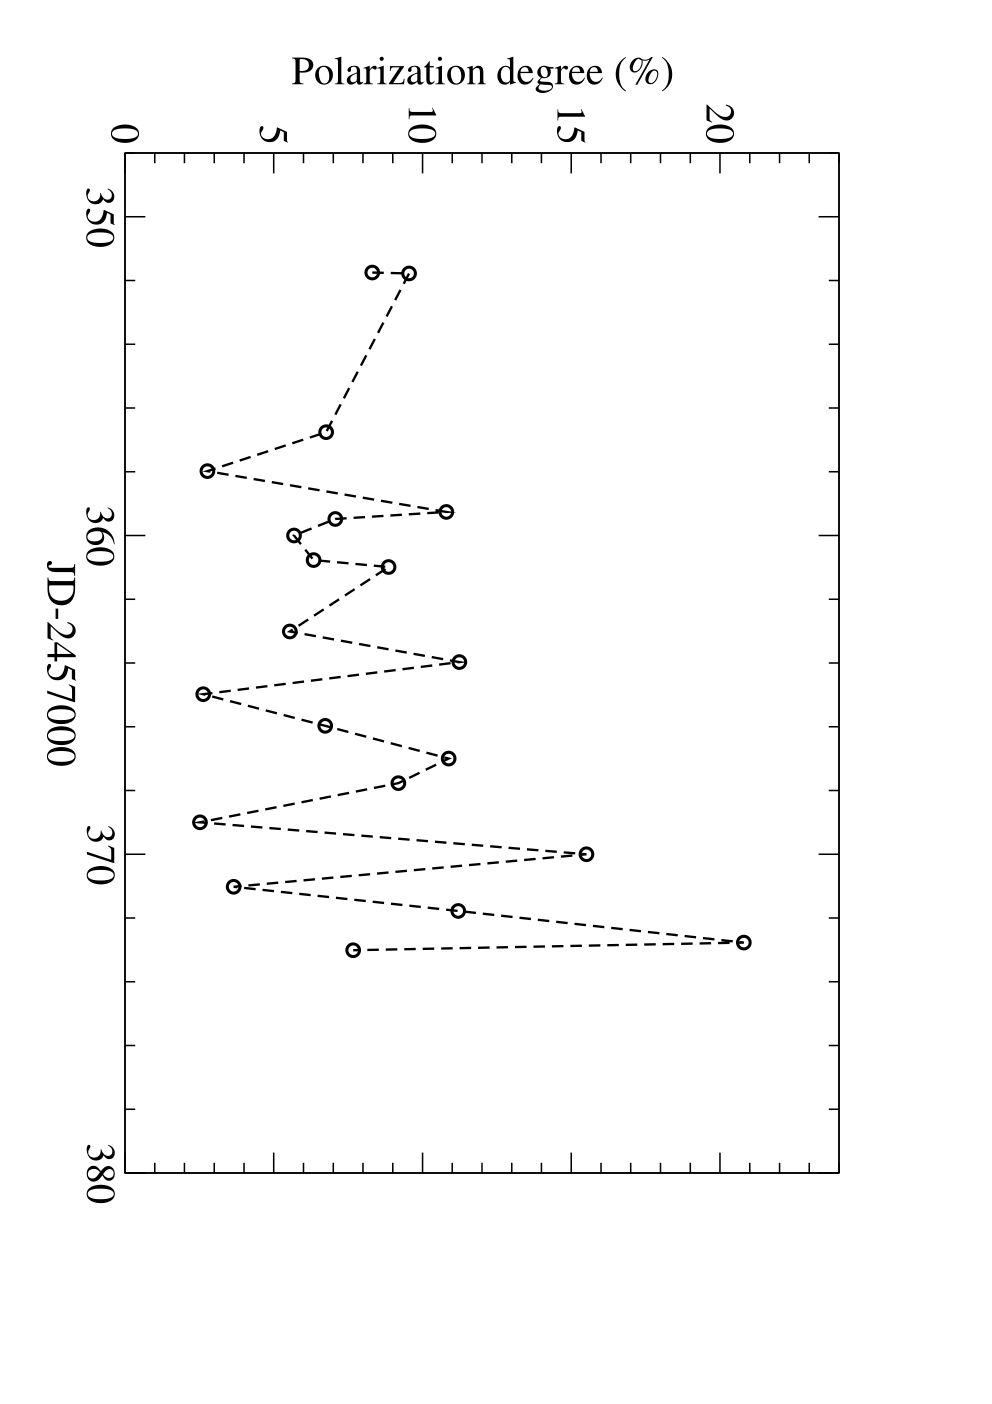
degree was also highly variable as shown in Figure 13 (left column/middle
panel). During the period JD2457350-372 it varied between 3%
and 15%. The distinct features are:
(1) The flux peak (at JD2457361.5) of the strong central spike flare
is not concurrent with the minimal polarization degree (
at JD2457359). There are other three epochs when the
polarization degree was observed to be between 2% and 4%,
but all occurred during the declining stage;
(2) the light curve of polarization degree does not reveal an
inverse-proportion relation with the flux density
(right column/middle panel in Figure 13),as expected if the outburst
is purely thermal, where the polarization degree should decrease when
its flux density increases and vice versa.
As for the 1983.0 and 2007.8 outbursts discussed in Sections 4 and 5,
we have applied a two-component model to simulate the light curves of
the observed (integrated) flux density, polarization degree and position
angle as a whole. We assume that the first flare of the December/2015
outburst consists of two polarized components: one is a stable polarized
component (or the steady underlying jet component before the
outburst; component-1) and the other is a flaring component with variable
polarization (component-2), respectively defined by ()
and (). We choose the following values for component-1:
=3.5 mJy (R-band), =6.0%,
The value for is constrained by the drop of polarization degree from
6.8% to 2.8% during the period 2457356.5-2457358.5
with slight change in position angle (Fig. 13; left column: middle and
bottom panels).
With the values of () chosen, the values
of can then be uniquely determined from solving
the combined equations (1) and (2). The modeling results of the
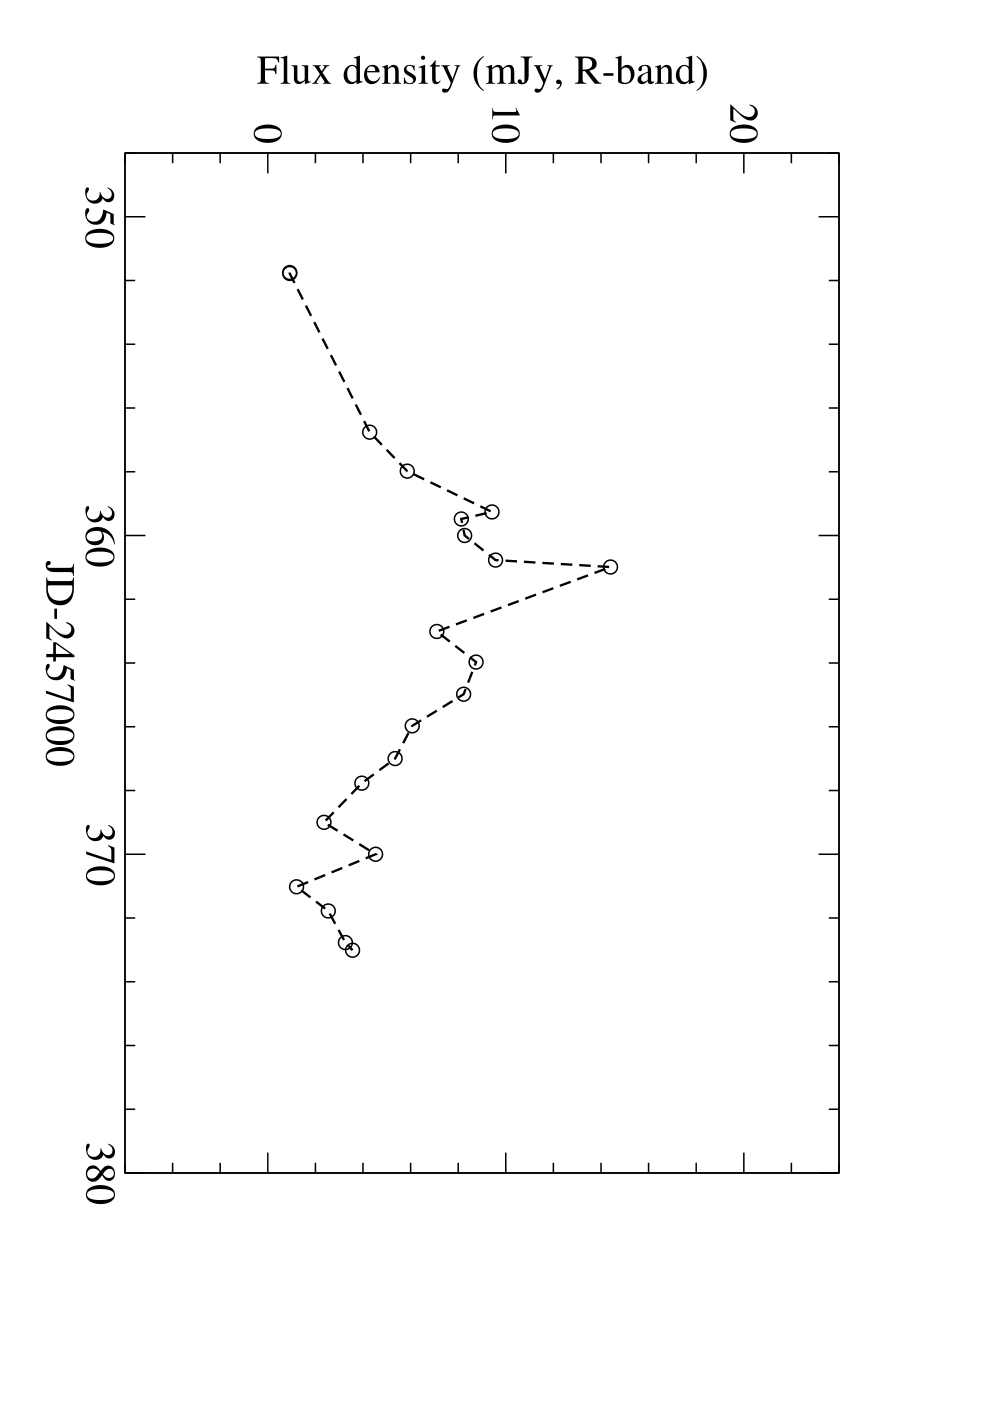
flaring component (component-2) are shown in
the left column of Figure 14. It can be seen that during the first
flare (JD2457358.0-369.0) the derived polarization degree
changes between 0.9% and 20%. The minimum degree occur
at JD2457358, not coincided with the flux peaking epoch
(JD2457361.5).
The modeling results in terms of the two-component model clearly exhibit
a rapid rotation of polarization position angle of the first flare
during the period (JD2457358-373), as shown in Figure 14
(left column/bottom panel). The position angle of the flaring component
changes by : from
to . Its average clockwise rotation rate is
approximately /day. Interestingly, the fastest
rotation rate of /day derived
during JD2457360-361 is
coincident with the peak of the strong spike flare. The derived
polarization position angle rotates clockwise with rapid fluctuations,
which could be due to the superposition of more than two polarized
components (e.g., a spike flare plus a wing flare and the stable
component), as the modeled flux density light curve for the flaring
component demonstrates.
The position angle rotations in optical wavebands are much faster
(by a factor of 20) than that observed at radio wavelengths
(Myserlis et al. 2018 2018) and the optical PA rotations precede
the radio PA rotations. This phenomenon could well be explained in terms
of the precessing nozzle scenario with helical motion: (1) both optical
and radio PA rotations are produced by superluminal optical and radio
knots moving along helical trajectory via lighthouse effect;(2)
radio knots may evolve from optical knots, and due to opacity effects in
radio-bands radio PA rotations should appear in regions further out
in the jet, thus having a time delay relative to the optical PA
rotations; (3) the pitch angle of the helical magnetic field may increase
further out along the jet, causing the PA rotation rate in radio-bands
much smaller than the rotation rate in optical bands; (4) combination
of polarized synchrotron radio/optical
flares can create various types of polarization behavior as observed
in generic blazars.
It seems that the rotation of polarization position angle derived
for the first flare of the December/2015 outburst could not be
interpreted in terms of the impact-disk model, where the first flare
of the December/2015 outburst was interpreted to be purely thermal,
because a thermal flare with zero polarization alone can not
cause rapid changes in position angle. Our model-simulation results
favor the suggestion that the first flare of the December/2015 outburst
is synchrotron flare according to its polarization behavior.
Polarization position angle swings have been observed in blazars for a
quite long time and interpreted by various authors, mostly invoking
superluminal knots moving along helical trajectory in helical magnetic
fields of jets or two-component model (Aller et al. 1981 1981,
Blandford & Königl
1979 1979, Holmes et al. 1984 1984,
Kikuchi et al. 1988 1988, Königl & Choudhuri
1985a, 1985b, D’Arcangelo et al. 2009 2009, Marscher
et al. 2008 2008, Myserlis et al. 2018 2018, Qian 1992 1992,
1993 1993, 2003 2003).
For interpreting the PA rotations observed in optical and radio regimes
in OJ287 the relativistic jet
models of superluminal knots moving along helical trajectory in magnetic
fields seem the most appropriate and consistent with
the processing nozzle scenario (Myserlis et al. 2018 2018,
Qian 2018b, 2019a).
6.4.3 QU-plots
The Stokes QU-plots for the integrated outburst is shown in Figure 15. And the QU-plots for the flaring-component (component-2) is shown in Figure 16. In the left panels are shown the entire Q-U tracks (during 20 days interval, JD2457352-371) which are very erratic, like a drunkards walk. This is because of the very rapid variations in its polarization and the considered time-interval is too long. However, for a shorter time-interval of 7 day during JD2457357-364 for the central strong spike flare, the QU-track clearly reveals its position angle rotation. Same behavior is for the flaring component (component-2) shown in Figure 16.
7 Discussion and conclusion
Based on the precessing jet nozzle scenario
previously proposed by Qian (2019a, 2019b, 2018b,
2016 2016) and Qian et al. (1991a, 2014 2014,
2017 2017, 2018a, 2019c), we have model-simulated
the flux light curve of the December/2015 periodic optical outburst
(during JD2457358-390; Figure 10). We have also analyzed the
polarization behavior of the periodic optical outbursts in 1983.0,
in 2007.8 and the first flare of the December/2015 outburst
(during period JD2457358-372) and showed that the
rapid and large rotations in their polarization position angles
(Figures 3-4, 6-7 and 13-15) associated with the appearance of
low polarization degrees.
A few conclusions can be made as follows.
- •
In order to determine the nature of emission (thermal or nonthermal) from the periodic optical outbursts, the light curves of flux density, polarization degree and polarization position angle () should be investigated and consistently interpreted as a whole. Low polarization degrees alone seem not appropriate to be used as a unique factor to recognize the emission from the outbursts being thermal;
- •
The model-simulations for the three outbursts have revealed that they all show large position angle rotations during the outbursts, implying that the three outbursts should be all synchrotron in origin and produced in the relativistic jets;
- •
The precessing jet-nozzle scenario may be helpful for understanding the phenomena observed in OJ287. The simulation of the flux density light curve for the first flare of the December/2015 shows that this flare may comprise a number of elementary synchrotron flares, which are produced through a succession of superluminal optical knots moving along helical trajectory via lighthouse effect. Most of the optical/radio emission features observed in OJ287 can be understood in terms of the precessing nozzle model. However, this scenario has been suggested only deal with the emission features. The solution to the mechanism(s) for the quasi-periodicity and double-peaked structure in the optical light curve requires different approaches to work out (e.g., the disk-impact mechanism suggested in Lehto & Valtonen 1996 1996, Sundelius et al. 1997 1997).
The relativistic jet models under the precessing nozzle scenario suggested for OJ287 by Qian (2019a, 2019b, 2018b) may be useful to interpret the basic phenomena of its electromagnetic radiation and its nature of emission, including the following observational aspects.
- •
(1) The simultaneous -ray and optical outbursts observed in the December/2015 flaring event (Kushwaha et al. 2018a) can be interpreted, because both -ray and optical outbursts are suggested to be originated within the relativistic jet;
- •
(2) The quasi-periodic optical outbursts are composed of elementary flares with timescales of 5 -10 days. Each of the elementary flares has a symmetric profile and they blend together to form the very complex light curves of the flux, polarization and position angle. We have well model-simulated the flux light curves for the periodic outbursts in 1983.0, 1984.12, 1994.59 ,1995.84, 2005.74, 2007.69 and the 2015.87 optical outburst (Qian 2019a). The symmetric profiles of elementary flares may be caused by the helical motion of the individual superluminal optical knots via lighthouse effect. This mechanism is applicable to both periodic and non-periodic outbursts.
- •
(3) The simultaneous variations in radio/mm and optical bands (Qian 2019b) can be interpreted: we have suggested that the superluminal optical and radio knots might have a core-envelope structure with its synchrotron radiation distributed in the direction perpendicular to the direction of the helical motion. In this case the core-region dominates the optical radiation and its envelope dominates the radio/mm radiation, and the motion of this core-envelope structure can produce instantaneous optical and radio/mm flux variations (Qian 2019b). This optical-radio/mm radiation pattern is consistent with the stratification of the magnetic surface predicted by MHD theories for the magnetospheres produced by the black-hole/accretion disk systems ( e.g. Camenzind 1990 1990).
- •
(4) The connection between the optical outbursts and the delayed radio outbursts and ejection of superluminal radio knots can be understood , because the superluminal optical knots evolve into time-delayed radio knots when they move outward to large distances from the core.
- •
(5) The large-amplitude rotations in polarization position angle of the outbursts can be explained. The helical motion of the superluminal optical knots through the surrounding helical magnetic fields would result in large-amplitude rotations of polarization position angle of the outbursts. This phenomenon has been discovered and studied: e.g, for BL Lacertae and OJ287 (Sillanpää 1993 1993, Marscher 2008 2008, Holmes et al. 1984 1984). In this paper we have also demonstrated the large-amplitude position angle rotations for the 1983.0, 2007.8 and 2015.8 outbursts, providing strong evidence for the helical motion of superluminal optical knots in blazar OJ287.
Recently, Myserlis et al. (2018 2018) found the large-amplitude polarization position angle rotations in OJ287 at radio wavelengths (10.5, 8.4 and 4.8GHz), which are delayed with respect to the position angle rotations at optical wavelengths. This is fully consistent with the predictions of the precessing nozzle scenario (Qian 2019a, 2019c): during the optical outbursts the radiation at radio wavelengths can not escape due to opacity effects and radio emission can be observed only when the radio-emitting regions become transparent. At the same time the timescales of the PA rotations at radio wavelengths would be much longer than that at optical wavelengths, because the radio PA rotations occurred in outer jet regions where the pitch angle of the helical magnetic field may be much larger than those in the optical-emitting regions (with coiled magnetic fields ). This is just the case as observed in Myserlis et al. during December 2015 to January 2017. - •
(6) The analysis of the kinematics of the superluminal radio knots on VLBI-scale at 15GHz in OJ287 (Qian 2018b) has shown that the precessing nozzle model can be used to explain the VLBI-kinematics of the radio knots. The precession of the jet-nozzle is a key ingredient to understand the phenomena in OJ287. A tentative study indicates that OJ287 might have a double-jet structure, because only in this case the kinematics of its superluminal components C11 and C12 (having similar position angles but four-year separation in ejection epochs) can be well fitted (Qian 2018b).
Although the precessing nozzle model OJ287 (Qian 2018b,
2019a) can be used to
understand most of the emission properties of the optical/radio outbursts
observed in OJ287, its basic assumptions are still to be tested
and confirmed.
In addition, the precessing nozzle model (as a relativistic jet model)
is only
applied to interpret the emission properties of the outbursts in OJ287.
It does not deal with the mechanism of the quasi-periodicity and
double-peaked structure, because this subject mainly involves the physical
processes occurred in the course of binary orbital motion, e.g. as
suggested by the impact-disk scenario. These may include the
penetration of secondary hole into the primary disk,
interaction between the secondary hole and the magnetosphere of the
spinning primary hole, and the consequential effects from the
impact-disturbances
in mass accretion on the ejection of superluminal optical knots, etc.
Some HD and MHD simulations (e.g., Artymowicz & Lubow
1996 1996, Artymowicz 1998 1998, Hayasaki et al. 2008 2008,
Cuadra et al. 2009 2009, Farris et al. 2014 2014, Shi et al.
2012 2012, 2015 2015, D’Orazio et al.2013 2013) have suggested that
cavity-accretion models with two-stream accretion flows toward the binary
holes could interpret the production of the quasi-periodic pair-flares.
66
6
Note that there is some evidence for double-jets in OJ287 from
the analysis of the VLBI-kinematics of superluminal radio knots (Qian
2018b). However, cavity-accretion models, e.g., as proposed
for OJ287 by Tanaka et al. (2013 2013),
can only produce a pair of thermal flares which is contradictory
to the polarization behavior observed in the quasi-periodic outbursts
(Qian, this paper; Myserlis et al.2018 2018; Homles et al.1984 1984).
Moreover, this model is not able to provide an interpretation for
the quasi-periodicity and prediction of flaring times of the
impact-flares.
At present, only the impact-disk model (Lehto & Valtonen 1996 1996,
Sundelius et al. 1997 1997, Valtonen et al. 2019 2019) has been
proposed to explain the quasi-periodicity and double-peaked
structure in the
optical light curve. According to Laine et al. (2020 2020) this model
has successfully predicted the pair of quasi-periodic outbursts
in 2015/2019.
Based on the calculations of the precessing orbital motion under the
impact-disk scenario, the accurate timing of the quasi-periodic flares
can be applied to test general relativity (Einstein 1916 1916,
1918 1918; e.g., gravitational waves, precession of binary orbit,
no-hair theorem, etc.).
Based on the model simulation of the light curves of flux density,
polarization degree and polarization position angle as a whole and the
investigation on the nature of emission from the
optical outbursts in 1983.0, 2007.8 and 2015.8, we find that these
periodic outbursts may be all synchrotron in origin, inconsistent
with the predictions from the disk-impact scenario. This issue
might be helpful for understanding the entire phenomena observed in
blazar OJ287. More multi-wavelength observations (in -rays and
in optical/radio bands) and theoretical works are required
to find some solutions. As a
conjecture, for example, we would have to consider the possibility:
if the impact-disk scenario for explaining the quasi-periodicity with
double-peaked structure is unique
and if the suggestion of the periodic outbursts being synchrotron in
origin is correct, then there should exist some mechanism(s)
connecting the ejection of superluminal optical knots
with the disk-impacts without producing strong thermal optical outbursts.
References
- (1) Ackermann M., Ajello M., Allafort A., et al., 2011, ApJ 743, 171
- (2) Aller, H.D., Hodge, P.E., Aller, M.F., 1981, ApJ,248, L5
- (3) Aller, M.F., Hughes, P.A., Aller, H.D. 2010, in “Fermi Meets Jansky - AGN in Radio and Gamma-rays”, Eds.: Savolainen, T., Ros, E., Porcas, R.W. and Zensus, J.A., p65
- (4) Aller, M.F., Hughes, P.A., Aller, H.D., et al. 2014, ApJ, 791, 53
- (5) Aller, M.F., Hughes, P.A., Aller, H.D., et al. 2016, Galaxies, arXiv: 1609.06332v1
- (6) Angel, J.R.P, & Stockman, H.S. 1980, Ann.Rev.Astr.Ap., 18,321
- (7) Artymowicz, P., Lubow, S.H. 1996, ApJ, 467, L77
- (8) Artymowicz, P. 1998, in: Theory of Black Hole Accretion Disks, ed. M.A. Abramowicz, G. Björnsson, J.E. Pringle, p202
- (9) Bell, A.R. 1978a, MNRAS, 182, 147
- (10) Bell, A.R., 1978b, MNRAS, 182, 443
- (11) Beskin, V.C. 2010, Physics-Uspekhi, 53, 1199
- (12) Björnsson, C.I. 1982, ApJ, 260, 855
- (13) Blandford, R.D., & Znajek, R.L. 1977, MNRAS, 179, 433
- (14) Blandford, R.D., Königl A., 1979, ApJ 232, 34
- (15) Blandford, R.D., & Payne, D.G. 1982, MNRAS, 199, 883
- (16) Britzen, S., Fendt, C., Witzel, G., Qian, S.J., et al. 2018, 478, 3199
- (17) Camenzind, M. 1990, Reviews in Modern Astronomy, Vol.3, 234
- (18) Camenzind, M. & Krockenberger, M. 1992, A&A, 255, 59
- (19) Camenzind, M. 1993, in: Proc. 1st MEGAPHOT workshop: ”The Need for a Dedicated Optical Quasar Monitoring Telescope”, eds., U. Borgeast et al., p.12
- (20) Carilli, C.L., Perley, R.A., Dreher, J.H. 1988, ApJ, 334, L73
- (21) Cawthorne, T.V. & Wardle , J.F.C., 1988, ApJ 332, 696
- (22) Cohen, M.H. 2017, Galaxies, 5, 12
- (23) Cohen, M.H., Aller, H.D., Aller, M.F., et al. 2018, ApJ, 862, 1
- (24) Cuadra,J., Armitage, P.J., Alexander, R.D., Begelman, M.C., 2009, MNRAS 393, 1423
- (25) D’Arcangelo, F.D., Marscher, A.P., Jorstad, S.D., et al. 2009, ApJ 697, 985
- (26) Dey, L., Gopakumar, A., Valtonen, M., et al. 2019, arXiv:1905.02689
- (27) Dey, L., Valtonen, M.J., Gopakumar, A., et al. 2018, ApJ, 866, article id. 11D
- (28) D’Orazio, D.J., Haiman, Z., & Macfadyen A. 2013, MNRAS, 436, 2997
- (29) Dreissigacker, O. 1996a, in: Extragalactic Radio Sources, eds., R. Ekers et al., p421
- (30) Dreissigacker, O & Camenzind, M. 1996b, in: Blazar Continuum Variability (ASP Conference Series, eds. H.R. Miller, J.R. Webb, and J.C. Noble), Vol.110, p.377
- (31) Einstein, A. 1916, Sitzungberichte der Königlich Presssichen Akademie der Wissenshafte (SPAW, Berlin), 688
- (32) Einstein, A. 1918, Sitzungberichte der Königlich Presssichen Akademi der Wissenshafte (SPAW, Berlin), 154
- (33) Farris, B.D., Duffell,P., MacFadyen, A.I., Haiman, Z., 2014, ApJ 783, 134
- (34) Gabuzda, D.C. et al., 1999, in: “BL Lac Phenomenon”, ASP Conference Series,eds., L.O.Takalo and Sillanpää, Vol.159, p.447
- (35) Gabuzda, D.C., Gómez, J.L., 2001, MNRAS, 320, L49
- (36) Gabuzda, D.C.,Murray, É, Cronin, P. 2004, MNRAS, 351, L89
- (37) Gmez, J.L., Alberti, A., Marcaide, J.M., 1994a, A&A, 284, 51
- (38) G, J.L., Alberti, J.M., Marcaide, J.M., et al., 1994b, A&A, 292, 33
- (39) Gupta, A.C., Agarwal, A., Mishra, A., et al. 2016, MNRAS, 458, 1127
- (40) Hayasaki, K., Mineshige, S. & Ho, L.C. 2008, ApJ, 682, 1134
- (41) Hodgson, J.A., Krichbaum, T.P., Marscher, A.P., et al. 2017, A&A, 597, 80
- (42) Hogg, D.W. 1999, astro-ph/9905116
- (43) Holmes, P.A., Brand, P.W.J.L., Impey, C.D.,et al. 1984, MNRAS, 211, 497
- (44) Hughes, P.A., Aller, H.D., Aller, M.F. 1985, ApJ, 298, 301
- (45) Hughes, P.A., Aller,M.F., Aller, H.D.,2011, ApJ, 735, 81
- (46) Jorstad, S.G., Marscher, A.P., Lister, M.L., et al., 2005, AJ, 130, 1418
- (47) Katz, J.I., 1997, ApJ, 478, 527
- (48) Kikuchi, S., Inoue, M., Mikami, Y., et al. 1988, A&A, 190, L8
- (49) Kong, X.Y., Xu, Y. H., Zhong Z.X. 1982, Acta Astrophys. Sinica, 2, 81
- (50) Königl, A. & Choudhuri, A.R. 1985a, ApJ, 289, 173
- (51) Königl,A. & Choudhuri, A.R., 1985b, ApJ 289, 188
- (52) Komatsu, E., Dunkley, J., Nolta, M.R., et al. 2009, ApJS, 180, 330
- (53) Kushwaha, P., Gupta, A.C., Wiita, P.J., et al. 2018a, MNRAS, 473, 1145
- (54) Kushwaha, P., Gupta, A.C., Wiita, P.J., et al. 2018b, MNRAS, 479, 1672
- (55) Laine, S., Gopakumar, A., Valtonen, M., et al. 2020, AAS, 23530501L
- (56) Laing, R.P. 1980, MNRAS, 193, 439
- (57) Lehto, H.J., & Valtonen, M.J. 1996, ApJ, 460, 207
- (58) Li, Z.Y., Chiueh, T.H., Begelman, M.C. 1992, ApJ, 394, 459
- (59) Lind, K.R., Blanford, R.D. 1985, ApJ, 295, 358
- (60) Lister, M.L., Aller, M.F., Aller, H.D., et al., 2013, AJ, 146, 120
- (61) Marscher A.P., Jorstad s.G., D’Acangelo F.D., et al., 2008, Nature, Vol.452,doi:10.1038/06895, p.966
- (62) Meier, D.L., Koide, S., Uchida, Y. 2001, Science, Vol.291, 84
- (63) Meier, D.L. 2013, EPJ Web of Conference 61, 01001
- (64) Myserlis I., Komossa E., Angelakis E., et al., 2018, A&A 619, A88
- (65) Pen, U.L., ApJS, 120,49
- (66) Pihajoki, p., Valtonen, M., & Ciprini, S. 2013, MNRAS 434, 3122
- (67) Qian, S.J., Witzel, A., Krichbaum, T.P., et al. 1991a, Acta Astron. Sin., 32, 369 (english translation: in Chin. Astro. Astrophys., 16, 137 (1992))
- (68) Qian, S.J., Quirrenbach, A., Witzel, A., et al. 1991b, A&A, 241, 15
- (69) Qian, S.J. 1992, Chin. Astron. Astrophys., Vol.16, 266
- (70) Qian, S.J., 1993, Chin. Astron. Astrophys., 17, 229
- (71) Qian, S.J., Krichbaum, T.P., Zensus, J.A. et al., 1996, A&A,308,395
- (72) Qian, S.J. & Zhang X.Z., 2003, Chin.J. Astron. Astrophys., Vol.3, 75
- (73) Qian, S.J., Witzel, A., Zensus, J.A., et al. 2009, RAA, Vol.9, No.2, 137
- (74) Qian, S.J. 2013, Res. Astron. Astrophys., 13, 783
- (75) Qian, S.J., Britzen, S., Witzel,A., et al., 2014, RAA, Vol.14, No.3, 249
- (76) Qian, S.J. 2015, Res. Astron. Astrophy., 15, 687
- (77) Qian, S.J., 2016, RAA, Vol.16, No.1, 20 (15pp)
- (78) Qian, S.J., Britzen, S., Witzel, A., et al. 2017, A&A, 604, A90
- (79) Qian, S.J., Britzen, S., Witzel, A. et al., 2018a, A&A, 615, A123
- (80) Qian , S.J., Britzen, S.J., Krichbaum, T.P., Witzel, A., 2019c, A&A 621, A11
- (81) Qian, S.J. 2018b, arXiv-1811.11514
- (82) Qian, S.J., 2019a, arXiv-1906.09782
- (83) Qian, S.J. 2019b, arXiv-1904.03357
- (84) Rees, M.J., 1978, MNRAS, 184, 61p
- (85) Schramm K.-J., Borgeest U., Camenzind M.,et al., 1993, A&A 278,391
- (86) Shi, J.M., Krolik, J.H., Loubow, S.H., Hawley J.F. 2012, ApJ, 749, 118
- (87) Shi, J.M., Krolik, J.H., 2015, ApJ 807 131
- (88) Sillanpää, A., Haarala, S., Valtonen, M.J., et al. 1988, ApJ, 325, 628
- (89) Sillanpää, A., Takalo, L.O., Nilsson K., Kikuchi S., 1993, APSS, 206 55
- (90) Sillanpää, A., Takalo, L.O., Pursimo, T., et al. 1996a, A&A, 315, L13
- (91) Sillanpää, A., Takalo, L.O., Pursimo, T., et al. 1996b, ASP conference series, Vol. 110 (Blazar Continuum Variability), eds. H.R. Miller, J.R. Webb and J.C. Noble, p74
- (92) Smith, P.S., Balonek, T.J., Elston, R., & Heckert, P.A. 1987, ApJS, 64, 495
- (93) Spergel, D.N., Verde, L., Peiris, H.V., et al. 2003, ApJS, 148, 175
- (94) Sundelius, B., Wade, M., Lehto, H.J., et al. 1997, ApJ, 484, 180
- (95) Takalo, L.O. 1996a, ASP Conference Series, Vol.110 (Blazar Continuum Variability), eds., H.R. Miller, J.R. Webb and J.C. Noble, p70
- (96) Takalo, L.O., Sillanpää, A., Lehto, H.J. 1996b, Mem.S.A.It., 67, 545
- (97) Tanaka, T.L. 2013, MNRAS, 434, 2275
- (98) Tateyama, C.E., Kingham, K.A., Kayfmann, P., et al. 1999, ApJ, 520, 627
- (99) Usher, P.D. 1979, Astron. J., 84, 1253
- (100) Valtaoja, E., Terasranta, H., Tornikoski, M., et al. 2000, ApJ, 531, 744
- (101) Valtonen, M.J., Lehto, H.J., Nilsson, K., et al. 2008, Nature, 452, 851
- (102) Valtonen M.J., Mikkola S., Lehto H.J., et al. 2011, ApJ, 742, 22
- (103) Valtonen, M.J., Zola, S., Ciprini, S., et al. 2016, ApJ, 819, L37
- (104) Valtonen, M.J., Zola, S., Jermak, H., et al. 2017, Galaxies, 5, 83
- (105) Valtonen, M.J., Zola, S., Pihajoki, P. et al. 2019, ApJ, (arXiv:1907.11011v1[Astro-ph.HE])
- (106) Villata, M., Raiteri, C.M., Sillanpää, A., et al. 1998, MNRAS 293, L13
- (107) Villforth, C., Nilsson, K., Heidt, J., et al. 2010, MNRAS 402, 2087
- (108) Vlahakis, N., & Königl, A. 2004, ApJ, 605, 656
- (109) Wagner S.J., Camenzind M., D reissigacker O., et al., 1995, A&A 298, 688