Hunting for Runaways from the Orion Nebula Cluster
Abstract
We use Gaia DR2 to hunt for runaway stars from the Orion Nebula Cluster (ONC). We search a region extending 45 around the ONC and out to 1 kpc to find sources that overlapped in angular position with the cluster in the last 10 Myr. We find runaway/walkaway candidates satisfy this 2D traceback condition. Most of these are expected to be contaminants, e.g., caused by Galactic streaming motions of stars at different distances. We thus examine six further tests to help identify real runaways, namely: (1) possessing young stellar object (YSO) colors and magnitudes based on Gaia optical photometry; (2) having IR excess consistent with YSOs based on 2MASS and WISE photometry; (3) having a high degree of optical variability; (4) having closest approach distances well constrained to within the cluster half-mass radius; (5) having ejection directions that avoid the main Galactic streaming contamination zone; and (6) having a required radial velocity (RV) for 3D overlap of reasonable magnitude (or, for the 7% of candidates with measured RVs, satisfying 3D traceback). Thirteen sources, not previously noted as Orion members, pass all these tests, while another twelve are similarly promising, except they are in the main Galactic streaming contamination zone. Among these 25 ejection candidates, ten with measured RVs pass the most restrictive 3D traceback condition. We present full lists of runaway/walkaway candidates, estimate the high-velocity population ejected from the ONC and discuss its implications for cluster formation theories via comparison with numerical simulations.
Keywords:
astrometry – stars: kinematic and dynamics – open clusters and associations: individual (Orion Nebula Cluster)I Introduction
The formation of star clusters takes place inside and from dense molecular clouds and is the result of gravitational collapse and fragmentation. In these early stages, young stellar clusters can be dense and the number of stars per cubic parsec increases as more stars are formed. Strong interactions between stars are expected to take place relatively frequently, especially if a significant fraction of stars are formed as binaries or higher-order multiples (Blaauw 1961; Poveda et al. 1967; Perets & Šubr 2012, e.g.,). Such interactions can then lead to the ejection of stars from the cluster at a range of velocities (Fujii & Zwart 2011; Oh & Kroupa 2016, e.g.,).
The Orion Nebula Cluster (ONC) is the closest massive, dense stellar cluster that is still undergoing formation, which makes it a perfect laboratory for testing star cluster formation theories. The ONC’s distance is pc (Kuhn et al. 2019). The total stellar mass is estimated to be 3000 within a 3 pc radius, mixed together with an approximately similar mass of gas in this volume (Da Rio et al. 2014). However, the stars are more centrally concentrated, with their density dominating inside about 1.4 pc, having a density profile of extending down to 0.1 pc, where the stellar density reaches (Da Rio et al. 2014).
Relatively large age spreads have been claimed to be present in the ONC (Palla et al. 2005; Palla et al. 2007; Da Rio et al. 2010; Da Rio et al. 2016), suggesting that it has been forming for the last 4 Myr or perhaps even longer. Three different, relatively discrete sequences in the colour-magnitude diagram have also been identified (Beccari et al. 2017; Jerabkova et al. 2019), which have been interpreted as bursts of star formation interrupted by the formation and subsequent dynamical self ejection of a few massive stars (Kroupa et al. 2018; Wang et al. 2019). It is expected, however, that massive stars will also eject a number of lower-mass stars. It has also been shown that the frequency and velocity distribution of ejected stars is linked to the densest state in the history of the star cluster (Oh & Kroupa 2016), as well to the dynamical timescale of its formation (Farias et al. 2019). Therefore, characterising the unbound population of a forming star cluster can provide important constraints for star cluster formation theories, including helping characterise the formation history of the system (Tan 2006; Tan et al. 2006, see, e.g.,).
The core of the ONC, also known as the Trapezium, is the densest and most dynamically active region of the cluster. Several runaway stars have been suggested to have been launched from this region. Using proper motions from the Hipparcos mission, the seminal work of (Hoogerwerf et al. 2001) found it highly likely that the runaway O stars Col and AE Aur were ejected about 2.5 Myr ago from the ONC, confirming the hypothesis first made by Blaauw & Morgan 1954. Both of these stars remain as the oldest and furthest candidate runaways to have been ejected from the ONC. High proper motion sources have also been identified in the more immediate surroundings of the Trapezium. For example, the Becklin-Neugebauer (BN) object (Becklin & Neugebauer 1967) is moving at and has been proposed to be ejected either from the Ori C binary system in the Trapezium (Tan 2004; Chatterjee & Tan 2012), or as part of a multiple system decay involving radio sources I and a third member (Bally & Zinnecker 2005; Rodriguez et al. 2005) that is still in the Trapezium cluster region. Recent observations suggest that this other source is the nearby radio source x (Luhman 2018), which is moving at (Farias & Tan 2018; Bally et al. 2020, see also).
More recently, using the high astrometric precision of Gaia, McBride & Kounkel 2019 searched an ONC membership list and identified 9 high proper motion stars. All these would have been ejected relatively recently, within the last 0.4 Myr ago. However, given that the ONC has been actively forming stars for perhaps times longer, it is expected that many other high velocity runaway stars have been ejected and escaped to greater distances. However, finding such runaways becomes challenging as they mix with high proper motion field stars. Logically, most photometric efforts to identify ONC members have been focused close to the ONC. Therefore, fast runaway stars ejected more than 0.5 Myr ago and with velocities higher than 20 that are at least 10 pc away (i.e., 1.5) have likely been missed by such studies. Therefore, most of the identified ONC runaway stars are still close to the ONC region, with the notable exception of AE Aur and Col.
Just before submission of our paper, we have become aware of a preprint by Schoettler et al. 2020, who explored a wider area of 100 pc around the ONC, tracing back candidates using projected 2D trajectories classifying candidates by their ages which were estimated using the PARSEC isochrones from Bressan et al. 2012. They have found 31 runaways and 54 walkaway candidates. However, they were very strict on the constraints used, i.e., by assuming an upper limit of 4 Myr for the ONC and discarding sources with 2D traceback times longer than that. They also discarded sources for which PARSEC isochronal ages were shorter than their traceback times.
In this work, we attempt to identify potential ONC runaway candidates using the unprecedented accuracy and scope of the astrometric measurements of Gaia (Lindegren et al. 2018; Gaia Collaboration et al. 2016). We explore a large area of 45 degrees around the ONC, which contains million sources in the Gaia catalog. Selecting a subset that have more accurately determined proper motions and that are within 1 kpc distance of the Sun, we trace back the two dimensional trajectories of such stars. We also test candidates under different criteria, i.e., “flags”, in order to identify signatures of youth and astrometric reliability. We combine this flag system to obtain a smaller number of most probably runaway candidates. For the small fraction of the sources with radial velocity measurements, we also consider the more stringent three dimensional trace-back condition. In this way, we have produced a list of interesting sources that are prime targets for follow-up observations, e.g., to confirm if they have stellar properties consistent with ONC membership. We also discuss how the number of prime candidates that we have found compares to theoretical expectations from cluster formation simulations.
II ONC frame of reference
The starting point for our study is to estimate the proper motion of the ONC. A good hint of its proper motion is given by the already known runaway stars that most likely came from the ONC. Two well studied runaway stars are AE Aur and Col. They were first noted by Blaauw & Morgan 1954, who observed that they travel with similar velocities () in almost opposite directions. Later, Gies & Bolton 1986 suggested that both stars were ejected from an event that involved the binary star Ori (Bagnuolo Jr. et al. 2001; Gualandris et al. 2004; Ryu et al. 2017, see also). Hoogerwerf et al. 2001 performed a set of numerical simulations, tracing back the trajectories of AE Aur and Col taking into account the gravitational potential of the Galaxy. They found that the proper motion and coordinates of the star cluster that may have hosted the event are consistent with those of the ONC.
We now estimate the proper motion of the ONC from Gaia data and check how consistent it is with the results reported by Hoogerwerf et al. 2001. To do so, we make use of the membership compilation performed by Da Rio et al. 2016. We cross matched this membership list with the Gaia catalog using the best neighbor method with a 1″ cross match threshold, selecting stars within 9′ from the ONC center. This angular distance corresponds to the half mass radius (1 pc) of the ONC (Da Rio et al. 2014).
One of the main problems when estimating the proper motion of the ONC is the sampling. It would be tempting to use the accurate parallax measurements of Gaia to constrain the sample in the line of sight direction on an equivalent distance to the 9′ used as angular distance threshold. However, if we do so the number of selected stars from the membership list is only on the order of dozens. Such proper motion would be less reliable since it would be affected by incompleteness and sparse sampling, since the number of members of the ONC is (Da Rio et al. 2014; Da Rio et al. 2016). Therefore, we have opted to use all stars flagged as members within 9′ of the ONC center, which resulted in 458 member stars.
The membership list compiled by Da Rio et al. 2016 also includes mass estimates of the sources, and again, it is tempting to calculate the center of mass proper motion of the selected sample. However, this quantity can be sensitive to anomalous motions of small numbers of massive stars, e.g., the most massive star system , which has a relatively high motion within the ONC (Tan 2004, e.g.,). Thus we have also measured the ONC’s proper motion using a weighted median estimate. The weighted median is a robust central tendency estimator that allows the use of the individual uncertainties in proper motion. Weights are taken as 1/error2, and then normalized by the total sum of the weights. As in the median measurement, values are sorted by proper motion and weights are normalized by its sum. The proper motion at which the cumulative sum of the normalized weights is 0.5 is then the weighted median.
Figure 1 shows the weighted median proper motion of the ONC members (red circle, hereafter adopted as the best estimate of ONC proper motion). Errors were estimated using bootstrap analysis, following the method of Kuhn et al. 2019. The resulting measurements are: and . In the figure we also show, for reference, the proper motion of the center of mass of AE Aur, Col and Ori estimated by Hoogerwerf et al. 2001 (blue star). The three proper motions are in approximate agreement. Our measurement agrees well with the estimate of (Kuhn et al. 2019), who measured and using the same method, but based on a sample from the MYStIX (Broos et al. 2013) and SFiNCs (Getman et al. 2017) surveys.
Following the same methodology, we have measured the weighted median radial velocity of the ONC. For this purpose we have used radial velocity measurements from the INfrared Spectra of Young Nebulous Clusters (IN-SYNC) survey that covered the Orion A complex (Da Rio et al. 2017) obtaining radial velocities for 2691 sources with uncertainties in individual measurements often being . Using this catalog instead of Gaia we greatly increase the sample of sources with available radial velocities within 9′ of the ONC, from 15 sources in Gaia to 200 sources marked as members of the ONC by Da Rio et al. 2016. Computing the weighted median on this sample we have obtained a radial velocity of . This radial velocity is consistent with the one that Hoogerwerf et al. 2001 have estimated for the parent star cluster of AE Aur and Col of 27.6–28.3 . In the local standard rest, this radial velocity transforms into 9.2 . Such a radial velocity, although somewhat higher than overall average of stars in the Orion A complex of 8 in Da Rio et al. 2017, is very consistent with that estimated from 13CO(2-1) measurements (Nishimura et al. 2015) at the declination of the ONC (Da Rio et al. 2017, see Figure 4, 4th panel in), where a radial velocity gradient is shown increasing from low to higher declinations.
Using the above estimate for the proper motion of the ONC and tracing back the trajectories of AE Aur and Col using great circles trajectories and assuming constant proper motions, we find that their closest approaches to the ONC are 2228′ and 4442′ respectively. These two sources are the furthest known runaway stars from the ONC. The error estimation of their closest approach comes from the errors in the proper motions. Systematic errors, such as the neglect here of the Galactic potential, will also contribute. The effects of both of these types of error grow with the traceback distance. Therefore, for sources at similar (angular) distances of Col and AE Aur from the ONC, we expect that true runaways will also exhibit similar errors in their closest distance to the ONC. Below, we will design our trace-back thresholds in order to capture Col and AE Aur.
III Sample selection by 2D Traceback
We first select sources that are up to 45 from the center of the ONC. Within this region there are 122,531,450 sources in the Gaia DR2 catalog. We note that this surveyed region encloses a sphere of radius pc around the ONC, which contains AE Aur, Col (and most of the higher likelihood runaway candidates identified; see below). We then used the following constraints to clean the sample.
First, to limit ourselves to stars with well-behaved astrometric solutions, we select those sources with reference unit weight error (RUWE) parameter . This leaves 108,990,887 sources in the sample. Next, we select stars with parallax () errors that are , i.e., . This reduces the sample to 18,118,187 sources. To carry out a standard variability study (described later), we require sources to have visibility_periods_used . This makes only a minor difference to the sample size, leaving 18,113,350 sources. Finally, we restrict to sources up to 1 kpc distance (given the ONC’s distance of pc), which leaves a final sample of 6,760,924 sources. We note that we have deliberately avoided to impose a photometric condition to clean the sample using phot_bp_rp_excess_factor, given that there are many reasons why this factor may be high and would not directly affect the quality of astrometric solution. In any case, only a small fraction of the sample are affected by this parameter.

After defining our sample, we wish to select new runaway candidates using variables that are common for all stars in the Gaia DR2 database. This means that we must ignore radial velocities for now, since, in our final sample, only of stars have radial velocity measurements. We will do a further selection with this small subset at the end of the main analysis.
With the final sample of almost 7 million sources, we then select stars whose trajectories overlap with that of the ONC in space and time. We use the following procedure. We remove the Sun’s peculiar motion relative to the Local Standard Rest (LSR), using values from (Schönrich et al. 2010). We calculate the trajectory of each star and the ONC using assuming constant proper motion along great circle trajectories on the sky, i.e., ignoring effects of acceleration due to the Galactic potential. Each point on the trajectory has an associated trace-back time () and we use this to calculate the closest approach to the ONC () in space and time. We require that is smaller than a certain threshold condition given by
| (1) |
where is the current angular distance of the star from the ONC. Thus the threshold becomes larger for stars that are currently further away (in angular distance) from the ONC, which allows for the fact that the errors in estimating past positions grow with longer traceback distances, i.e., due to proper motion errors, the constant proper motion approximation (which is broken by projection effects) and the effects of the Galactic potential. The normalization of the threshold condition has been adjusted to make sure that Col and AE Aur are recovered by this method: in particular to capture Col which has a closest approach with . For sources currently close to the ONC, the threshold is , which is about 1.2 pc, i.e., similar to the half-mass radius of the cluster. This choice is motivated since runaways are expected to be produced by dynamical ejection events that are more frequent in the dense, inner regions of the cluster, and having a smaller threshold helps to minimize contamination from field stars. We note that our method will select all stars that are currently within 10′ of the ONC’s center.
Using this trace-back method we find there are 16,994 sources that meet this 2D projected overlap condition. We considered adopting a maximum traceback time, e.g., to 10 Myr, however, when we examine the distribution of traceback times of the selected sources (Figure 2), we see that most sources are already within this range. Given the caveats of the assumed linear trajectory, constant proper motion approximation and thus possible discrepancies between 2D and 3D traceback, the real traceback time may be very different especially for sources that are far from the ONC. Thus, we simply retain all the selected sources for further analysis and note that the value of the traceback time, especially if Myr, could weigh against the likelihood of a source being a genuine runaway from the ONC.
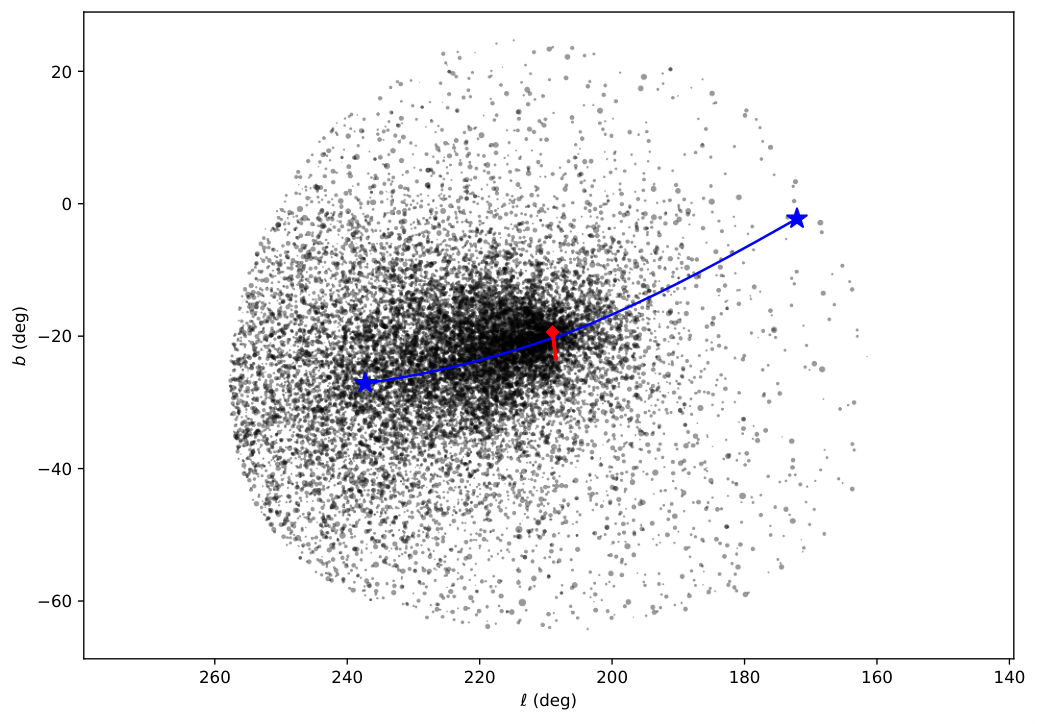

Figure 3 shows the overall distribution of the 17,000 sources that satisfy the 2D traceback condition, described in §III. Given the number of sources detected by this method and their asymmetric distribution in position angle () around the ONC, it is clear that the large majority are contaminants from Galactic field stars that have apparent past positional overlap with the ONC. It is expected that this occurs especially due to systematic differential rotation in Galactic orbits, which we will refer to as “Galactic streaming”, thus explaining the asymmetry of the distribution, preferentially in one direction from the ONC that is parallel to the Galactic plane.
IV Sample Refinement from Signatures of Youth and Kinematic Properties
Given the large number of sources found by 2D traceback, the next challenge is thus to find ways to filter out most of these contaminants to identify candidates that have a higher likelihood of being real runaways. These could be targets for spectroscopic follow-up, e.g., for radial velocity measurement and better stellar characterization. To do this filtering, we now carry out six further tests, focusing on aspects of stellar youth, via: 1) optical colors; 2) IR excess colors; 3) variability; and kinematic properties, via: 4) accuracy of coincidence with the ONC centre; 5) if PA is away from the main contamination zone due to Galactic streaming; 6) radial velocity considerations to achieve 3D traceback.
If a star passes a test, we say it is “flagged” as being of greater potential interest. However, some stars are not able to be examined for all the tests, and so we will generally pass or “flag” such a star in respect of that test to err on the side of inclusion. To distinguish such cases we use a numerical value for the three states of a source with respect to a given flag: pass the flag (+1); fails (-1); and could not be tested (0).
IV.1 Youth via optical color-magnitude (YSO flag)
We expect most lower-mass stars formed in the ONC to be in the pre-main sequence phase, which may be assessed from the HR diagram. In particular, we examine the position in the color-magnitude diagram (corrected by extinction and reddening) to remove contaminating lower-mass main-sequence stars, following conditions used previously by Kounkel et al. 2018; McBride & Kounkel 2019, i.e., the following cuts in colour-magnitude space in the Gaia color-magnitude system (see Fig. 4a):
| ; | ||||
| ; |
The extinction correction in this analysis was achieved following the method of Zari et al. 2018 for the studied region. It consists of making a 3D grid on the studied region and using the values for band extinction, , and color excess provided by Gaia. While the individual values for extinction and color excess are not especially accurate, it is possible to use an average for sources in each bin (Zari et al. 2018; Andrae et al. 2018). We download a special sample for this purpose from the same region of our original sample, using the following conditions (Zari et al. 2018):
- •
- •
mag
- •
We then grid the region in 3D using bins of 10 pc, and take the average on each bin for extinction and color excess, obtaining a 3D extinction map.
Using this method we found that 2,893 sources out of the 17,000 2D traceback main sample have properties consistent with YSOs (or higher-mass main sequence stars), of which only 10 sources have phot_bp_rp_excess_factor higher than 2 (and these are below 2.5).
IV.2 AllWISE IR classification (WYSO flag)
The recent study by Marton et al. 2019 performed a probabilistic classification of YSOs in the Gaia catalogue using the cross-matched table between Gaia and the AllWISE database by Marrese et al. 2019. The AllWISE source catalogue (Cutri & al. 2013) is an extension of the Wide-field Infrared Survey Explorer (WISE) survey (Wright et al. 2010) that contains 747 million sources with accurate infrared photometry. WISE scanned the whole sky using four near-infrared bands at 3.4, 4.6, 12 and 23 m, hereafter W1, W2, W3 and W4, respectively.
Marton et al. 2019 used a Machine Learning approach to classify sources in four categories, i.e., Main Sequence stars (MS), Extragalactic objects (EG), Evolved stars (E) and Young Stellar Objects (YSO). For the YSO classification, they used as training sample a collection of photometric and spectroscopic YSO catalogues listed by VizieR (see Appendix A, B and C in Marton et al. 2019, for references), Spitzer YSOs and YSO candidates from (Evans II et al. 2003). Applying a Random Forest classification, they were able to recover 93.9% of the training set correctly. Using this method they provided a probability, PLY, of a source being a YSO using the W1-4 bands (among other features).
However, most AllWISE sources had spurious photometry and point source identification in the longest bands (W3 and W4) that could lead to false classification. Therefore the whole classification was done also using only the W1 and W2 bands, providing a complementary probability, PSY, of being a YSO when discarding W3 and W4. Following Koenig & Leisawitz 2014 they also used random forest classification to characterize with a probability, PR, for W3 and W4 to be real.
Following their method, we used the Marton et al. 2019 catalog and flagged sources as Wise Young Stellar Object (WYSO) stars where:
| if | |||||
| if | (2) |
Unfortunately, only 4183 sources, i.e., 25%, 2D traceback sample have AllWISE photometry. Of these, we find 420 sources that fulfil the WYSO criteria (see Fig. 4b). We choose not to penalize sources that could not be evaluated using this method. This essentially means that we flag WYSO = 0 any source that was not in the Marton et al. 2019 catalog. We use WYSO = +1 for sources that do have AllWISE photometry and that fulfill Eq. IV.2.
IV.3 Variability (VAR flag)
The majority of YSOs exhibit variability (Cody & Hillenbrand 2014, e.g.,). Thus, we expect most true ONC members will do so also. In Gaia DR2, only average values for the photometry are published for all sources, although each source has been observed at several epochs (Evans et al. 2018). The reported value of the mean flux has an associated uncertainty related to it. Variability is assessed as proportional to the standard deviation of the magnitude measurements, which can be reconstructed from the mean quantity of the flux, the flux error and the number of measurements for a given source. In Gaia, the band is the most precise photometric measurement, thus we use it to construct a proxy for the amplitude of the variation (Eyer et al. 2019). As amplitude proxy on , hereafter , we use its fractional standard error, i.e., . This value is obtained from Gaia DR2 as:
| (3) | |||||
where phot_g_n_obs is the number of observations used to construct and phot_g_mean_flux_over_error is divided by its error divided by .
In Fig. 4c we plot against . A noise threshold function () is fit to the densest area of Figure 4c, shown with the green line, and having the form:
| (4) |
We quantify intrinsic variability () via:
| (5) |
This method is only well behaved for faint sources, since brighter sources suffer from other sources of photometric errors that are not well described as random noise. Thus, we only evaluate intrinsic variability for sources with phot_g_mean_mag .
Finally, we flag as VAR = +1 all sources with and . Sources with , which could not be evaluated using this method, are not penalized and are given a VAR = 0 flag. Overall 2,494 sources are flagged VAR 0, of which 676 are flagged VAR = 1.
IV.4 Close Approach (CA flag)
Even with the unprecedented improvement in proper motion accuracy provided by Gaia, many stars still have relatively large uncertainties in their astrometric solutions. For stars that are further from the ONC, these uncertainties, plus those associated with the effects of the Galactic potential that we have not accounted for, have a correspondingly larger effect on the predicted position when the star was near the ONC. So far we have been quite generous in the closest approach distance to the ONC that is needed to select stars, i.e., it could be as large as 68.5′ ( pc) for sources that are currently 45 away from the ONC, with this limit set to be able to recover Col and AE Aur (see above).
Now, we wish to flag those sources that do have more accurate estimates of their proper motions that bring them within 10′ of the ONC centre and with an uncertainty smaller than 10′. Most runaways are expected to be ejected from the dense central region of the ONC, so with this flagged subset we expect to have a higher likelihood of finding real runaways and reduce the level of contamination compared to the main sample. The sources selected by this method are shown in Figure 4d: there are 1,447 sources out of the main sample of . Thus we can see that even with this more restricted 2D traceback condition, the sample is still likely to be dominated by contaminants. We also remind that there could be true runaways, especially more distant ones like Col and AE Aur, that are not selected by this method.
IV.5 Position Angle (PA flag)
A large degree of contamination is present after the 2D traceback selection, due to streaming in the Galactic plane. This is evident from the asymmetric distribution of the sources around the ONC (see Fig. 3). We have thus added a flag based on the position angle () of a star’s current angular position relative to the ONC, where 0 is in the direction of the Galactic north pole. We flag sources that are outside the range with PA flag = 1, which is the main contamination zone. Sources within such range are flagged with PA = -1. Note that PA refers to the flag, while refers to the actual position angle in degrees.
IV.6 Radial Velocity Flag (RV flag)

IV.6.1 Stars with measured radial velocities
In the 2D traceback sample of sources, only about 7% have measured radial velocities, i.e., stars. However, for these sources, we are able to carry out a 3D traceback analysis, which is more restrictive than the 2D method.
Using simple vector algebra, we calculate the closest approach to the ONC in 3D, . Given the position and velocity of a star and the position and velocity of the origin, in this case the ONC, the time of the closest approach to is
| (6) |
Then, the closest approach distance is:
| (7) |
Following a similar approach to that used in the 2D traceback described in §III, we adopt a closest approach threshold that grows as a function of current distance of the source from the ONC:
| (8) |
where is the current 3D distance of a star to the ONC. The form of this equation was guided by consideration of AE Aur as can be seen in Figure 5, where we illustrate this threshold. While AE Aur and Col do not have measured radial velocities with Gaia, we made use of the values from Hipparcos used in the analysis of Hoogerwerf et al. 2001. With these central values for radial velocity and distance for AE Aur, the past trajectory misses the ONC by 100 pc. However, we note that there are significant spreads in the distributions of the properties of the stars used by Hoogerwerf et al. 2001, while the affect of accelerations induced by the Galactic potential and Orion’s giant molecular clouds’ potentials will also impart apparent discrepancies.
Using the criterion described in Eq. (8) selects 516 sources as ejection candidates out of the 1200 sources with radial velocities. However, for a small number, 25, of these selected sources the obtained is negative, i.e., their closest approach in 3D to the ONC is in the future. We discard such sources, leaving a final selected sample of 491 out of 1,200, i.e., 40%.
| YSO | WYSO | VAR | CA | PA | RV | Flag Combinations |
| 2893 | 420(13231) | 676(2494) | 1447 | 4755 | 6572 | |
| 205(1989) | 266(1588) | 464 | 906 | 833 | YSO | |
| 150(1923) | 191(894) | 151(2963) | 269(5280) | WYSO | ||
| 324(547) | 260(812) | 397(1076) | VAR | |||
| 540 | 480 | CA | ||||
| 2109 | PA | |||||
| 104(1198) | 97(278) | 63(498) | 146(637) | YSO WYSO | ||
| 149(307) | 101(495) | 207(650) | YSO VAR | |||
| 191 | 192 | YSO CA | ||||
| 308 | YSO PA | |||||
| 95(425) | 45(555) | 133(851) | WYSO VAR | |||
| 52(290) | 110(355) | WYSO CA | ||||
| 103(1446) | WYSO PA | |||||
| 138(233) | 213(290) | VAR CA | ||||
| 154(371) | VAR PA | |||||
| 193 | CA PA | |||||
| 60(224) | 32(328) | 95(495) | YSO WYSO VAR | |||
| 29(111) | 66(154) | YSO WYSO CA | ||||
| 50(212) | YSO WYSO PA | |||||
| 64(138) | 120(181) | YSO VAR CA | ||||
| 82(237) | YSO VAR PA | |||||
| 90 | YSO CA PA | |||||
| 31(178) | 79(246) | WYSO VAR CA | ||||
| 42(264) | WYSO VAR PA | |||||
| 36(130) | WYSO CA PA | |||||
| 93(128) | VAR CA PA | |||||
| 21(99) | 52(146) | YSO WYSO VAR CA | ||||
| 31(164) | YSO WYSO VAR PA | |||||
| 22(69) | YSO WYSO CA PA | |||||
| 54(86) | YSO VAR CA PA | |||||
| 28(107) | WYSO VAR CA PA | |||||
| 20(67) | YSO WYSO VAR CA PA |
| Score | Subclass | YSO | WYSO | VAR |
|---|---|---|---|---|
| a | I | 1 | 1 | 1 |
| II | 1 | |||
| III | 1 | 0 | 0 | |
| b | I | -1 | 1 | 1 |
| 1 | ||||
| II | -1 | |||
| 1 | ||||
| III | -1 | 0 | 0 | |
| c | I | -1 | ||
| 1 | -1 | -1 | ||
| II | -1 | |||
| d | I | -1 | -1 | -1 |
IV.6.2 Required radial velocity
In the 2D traceback selected sample 93% of sources do not have radial velocities. This is the final parameter from the 6-dimensional space needed to fully characterize the trajectory of a star. For the sources lacking radial velocity measurements, we have calculated the value of radial velocity, needed so that their past trajectory has the closest approach to the ONC center. To account for measurement errors, we carry out Monte Carlo sampling over the distributions of astrometric parameters, assuming Gaussian distributions for the uncertainties, to obtain not only a distribution of , but also of closest approach distances and traceback times. From these distributions we report the 16 and 84 percentiles for each source.
For sampling on , simple Gaussian sampling is not enough (Bailer-Jones 2015). Even though we have chosen to work with sources with small enough errors so we can use distances as , sampling distances using a Gaussian distribution around caused us to lose some sampling probability when . Instead, to infer the distribution of distances that a source with a given and would have, we use the posterior used in Bailer-Jones et al. 2018 assuming an exponentially decreasing space density prior (see Bailer-Jones 2015; Bailer-Jones et al. 2018, for further details).
Figure 6 shows distributions of and the minimum values (16th percentile) of the distributions for and . The first panel shows that the majority of sources need positive radial velocities to reach the ONC during their past trajectories, since most of them are at distances 410 pc. It is important to note that generally has large uncertainties. Most of this comes from parallax uncertainties, which can give a large range of possible distances, directly affecting the radial velocity needed to reach the ONC.
The second and third panels in Figure 6 show the 16th percentile of the distributions of and . An important point to note is that tracing back in 3D will not necessarily give the same result as 2D traceback. There are two reasons. First, in 2D traceback we assume the proper motion is constant along the trajectory, which is an approximation that becomes less valid for sources with relatively large current angular separations from the ONC. Second, the 2D traceback method does not consider the radial velocity of the ONC. For these reasons, the traceback time in 3D can be different from that in 2D.
A difference in the traceback time affects the final position in the sky of closest possible approach to the ONC. If the ONC radial velocity were zero, then the minimum closest approach from a source to the ONC would be given by the 2D closest approach in the plane of the sky. However since it moves, the closest distance may be different from its 2D counterpart. The result is that the best 3D closest approach of some sources is larger than the threshold used in the 2D traceback. We therefore exclude those sources where the minimum (16th percentile) closest approach does not satisfy the 3D traceback threshold.
Conditions on , and can thus be used as thresholds to exclude some sources from the candidate list. First, we consider the magnitude of . We do not expect that dynamically ejected stars are likely to have radial velocities greater than 1000 as the maximum ejection speed is approximately the escape speed from the location of ejection, which is limited by the escape speed from near the surface of the ejecting star. Indeed, known runaway stars with velocities are very rare. If this velocity were to be used as a threshold, then 7,231 sources would be excluded. An additional 3,267 sources can be discarded if we exclude any source has min pc, i.e., about twice the ONC half-mass radius. In principle, the revised traceback time could also be used to discard sources, however the range of values shown by are similar to those found earlier in the 2D traceback method, so we do not exclude any based on this quantity.
In summary, by assessing the conditions needed for 3D traceback in the sample of sources that do not have radial velocity measurements, we have excluded 6,496 sources out of 16,994. Thus every source is given an entry for the RV flag, but with the selection criteria depending on whether it is a source with a measured radial velocity or not.
V Results
We now discuss the results of applying the sample refinement criteria described in the last section.
V.1 Flag combinations
Table 1 shows the number of stars that satisfy the various possible combinations of flags. For the cases of WYSO and VAR flags, not all sources could be tested, either because the sources did not appear in the AllWISE catalog (see §IV.2) or were too bright (see §IV.3). As mentioned in §IV, we use a numerical value for each flag when passing (+1), failing (-1) or when it could not be tested (0). Effectively only WYSO and YSO flags have values equal to zero. The numbers in Table 1 show the combination of positive cases, while numbers in parentheses show the combinations of flags with +1 or 0 values.
In order to select the best candidates for high velocity runaways, we have developed a score system which gives an unique score to each source based on the number of flags that it meets and to the transverse velocity it has within the context of each group. There are four general scores given, as described below.
Sources that do not fail any young signature flag (i.e., YSO, WYSO and VAR) are given a score a. Sources that fail one signature of youth flag are scored with b. Sources that fail two signatures of youth are scored as c and sources that fail all three YSO, WYSO and VAR flags are scored as d. Within each score we added three subclasses depending on how many zeros are found in the signatures of youth flags. Subclass I means there is no zero in these flags, subclass II means there is one of the flags with a zero value, while subclass III means there are two flags with zero values. Therefore we have general scores as aI, aII, aIII, bI, bII, bIII, cI, cII and d. Table 2 summarizes this scoring system.
Three modifiers are added to the score label depending on the astrometric flags CA, PA and RV. A “+” character is added if a source passes the CA flag, i.e., is a particularly good candidate whose trajectory overlaps within 10′10′ with the ONC. A “*” character is given to sources that fail the PA flag. This reminds us of sources that are more likely to be contaminants due to Galactic streaming. Finally, a “!” character is added for sources that fail the RV flag, i.e., sources that are unlikely to come from the center of the ONC given their current astrometric parameters and uncertainties.
Finally, within each group of scores, e.g. aI+*!, an identifier is appended depending on its estimated transverse velocity on the frame of reference of the ONC, . Where, from the fastest to the slowest candidate, a sorted ordinal number is used as identifier. Since each score is unique, we will also use it as a label for each source in the catalog. For instance, the best candidate found in our catalog is source aI+1 corresponding to the source DR2 3209590577396377856 (see Table ). Another strong candidate, except that it happens to be in the contaminated zone, is source aI+*1 which corresponds to source DR2 3015321754828860928.
V.2 Already known ONC members
Before presenting the selection of sources based on the flag system, we first discuss how the sample of known ONC members are represented in our selection system. This is motivated by the fact that from the main sample of 2D traceback selected stars, i.e., totalling 16,994 sources, there are 67 a+ sources (i.e., that do not fail any flags), of which 20 are scored aI+ (i.e., pass all 6 flags), and of these samples of 67 (20) sources, 54 (17) are already known members of the Orion A complex.
| Gaia ID | Label | YSO | P(YSO) | |||||||||||
|---|---|---|---|---|---|---|---|---|---|---|---|---|---|---|
| Score | [J2015.5] | [J2015.5] | (pc) | (∘) | (km/s) | (Myr) | (km/s) | (km/s) | (’) | (∘) | ||||
| (u)3017373645390119040 | aIII+!4 | 208.8720 | -19.2685 | 38.77 | 0.18 | 39.04 | 0.03 | 9.960.22 | 310.20 | |||||
| (d)3209653627514662528 | bI+!4 | 207.9739 | -18.9000 | 34.13 | 1.14 | 26.90 | 0.30 | 0.40 | 2.25 | 1.612.56 | 295.07 | |||
| (h)3209624872711454976 | aI+2 | 208.2961 | -19.1976 | 16.83 | 0.73 | 18.56 | 0.25 | 0.87∗ | 4.78 | 0.042.10 | 284.66 | |||
| (i)3209497088842680704 | aI+3 | 208.3825 | -19.8859 | 18.51 | 0.81 | 16.35 | 0.36 | 0.99 | 4.25 | 4.143.10 | 231.29 | |||
| (f)3017166907140904320 | bI+*1 | 209.8430 | -19.6422 | 31.55 | 0.87 | 16.26 | 0.30 | 0.77 | 1.67 | 1.152.59 | 107.20 | |||
| (b)3209424108758593408 | bII+9 | 208.9286 | -19.5733 | 21.29 | 0.21 | 16.23 | 0.10 | 10.6711.93 | 0.80 | 1.010.86 | 202.93 | |||
| (g)3209531650444835840 | bII+!29 | 208.7476 | -19.3145 | 3.18 | 0.27 | 14.01 | 0.12 | 17.604.17 | 0.21 | 0.471.05 | 284.91 | |||
| (a)3209424108758593536 | bII+13 | 208.9254 | -19.5771 | 17.13 | 0.22 | 13.91 | 0.13 | 0.71 | 1.021.07 | 203.32 | ||||
| 3017367155707574784 | bII+!3 | 208.8952 | -19.3620 | 198.04 | 0.11 | 119.80 | 0.00 | 2.74 | 6.550.03 | 280.96 | ||||
| (Ae Aur)182071570715713024 | bII1 | 172.0812 | -2.2591 | 280.18 | 41.84 | 83.56 | 3.30 | 57.501.20aafrom the Hipparcos Input Catalogue (Turon et al. 1992). | 0.43 | 294.88 | ||||
| 3017166323025342336 | cII+*!65 | 209.8963 | -19.5461 | 186.80 | 0.89 | 72.26 | 0.04 | 0.67∗ | 6.500.36 | 100.35 | ||||
| 3015731254191486464 | bI+*!6 | 212.5260 | -18.8654 | 343.59 | 3.52 | 49.26 | 0.08 | 0.88 | 1.61 | 7.510.65 | 81.61 | |||
| ( Col)2901155648586891648 | aIII*80 | 237.2863 | -27.1021 | 211.65 | 28.31 | 48.36 | 3.91 | 109.002.50aafrom the Hipparcos Input Catalogue (Turon et al. 1992). | 105.27 | |||||
| 3017265794467742592 | cII+*!133 | 209.0880 | -19.5702 | 254.36 | 0.21 | 48.25 | 0.01 | 0.90 | 7.550.09 | 156.91 | ||||
| 3017363131310582016 | bII+!10 | 209.0102 | -19.2647 | 269.67 | 0.12 | 45.62 | 0.01 | 1.39 | 7.180.06 | 0.75 | ||||
| 3017246449935170304 | d+*!77 | 209.3468 | -19.4736 | 206.04 | 0.35 | 45.58 | 0.02 | 0.73∗ | 1.00 | 0.180.23 | 104.85 | |||
| 3017369217290106880 | aII+!2 | 208.9876 | -19.2373 | 118.14 | 0.16 | 31.86 | 0.04 | 1.65 | 6.900.35 | 351.86 | ||||
| 3017266516022225920 | bII+*!53 | 209.0669 | -19.4662 | 58.29 | 0.10 | 24.34 | 0.02 | 2.49 | 1.050.21 | 144.65 | ||||
| 3016867049702538368 | cI+*!78 | 210.7112 | -19.7078 | 112.38 | 1.71 | 23.44 | 0.33 | 0.82∗ | -0.29 | 5.442.76 | 100.77 | |||
| 3017248094906815488 | cII+*!198 | 209.3396 | -19.4200 | 240.96 | 0.33 | 22.26 | 0.04 | 0.62 | 4.420.63 | 96.21 | ||||
| 3017266172424849664 | bII+*!56 | 209.0835 | -19.4899 | 298.41 | 0.13 | 21.09 | 0.01 | 2.50 | 5.780.09 | 144.73 | ||||
| 3017242051888552704 | bII+*3 | 209.2926 | -19.7397 | 8.41 | 0.47 | 15.65 | 0.20 | 0.63∗ | 2.711.68 | 141.40 | ||||
| 3017240746218498176 | cI+*!86 | 209.3243 | -19.7989 | 90.63 | 0.53 | 15.41 | 0.32 | 0.23∗ | 0.46 | 9.202.83 | 142.73 | |||
| 3015625563635553024 | bI+*2 | 211.7370 | -19.6999 | 31.49 | 2.71 | 14.25 | 1.05 | 0.73 | 2.58 | 4.029.01 | 96.60 | |||
| 3017369217290105472 | bII+!28 | 208.9860 | -19.2301 | 177.85 | 0.16 | 14.25 | 0.11 | 33.200.48 | 0.30 | 9.341.01 | 351.62 | |||
| 3017147592669974144 | cII+*!211 | 209.7571 | -19.7405 | 246.93 | 0.83 | 13.58 | 0.16 | 7.572.87 | 0.45 | 5.791.38 | 115.46 | |||
| 3209520036854102912 | bII+!30 | 208.8184 | -19.5070 | 291.86 | 0.23 | 13.13 | 0.04 | 1.98 | 9.510.41 | 237.10 | ||||
| 3209570000209415168 | d+!112 | 208.5551 | -18.6792 | 235.24 | 0.86 | 12.52 | 0.18 | 0.78∗ | 0.44 | 5.471.72 | 327.24 | |||
| 3209519319595376512 | bII+!35 | 208.8678 | -19.4685 | 120.79 | 0.16 | 11.37 | 0.08 | 16.182.42 | 0.01∗ | 9.440.65 | 239.03 | |||
| 3017341385903759744 | bI+*3 | 209.3795 | -19.3238 | 11.17 | 0.37 | 10.85 | 0.19 | 0.70∗ | 4.71 | 2.251.59 | 80.78 | |||
| 3017270879709003520 | bII+15 | 208.9542 | -19.5277 | 13.25 | 0.16 | 10.20 | 0.14 | 0.15∗ | 1.251.19 | 200.75 | ||||
| 3015714967674577024 | aI*1 | 211.1998 | -19.7645 | 21.49 | 2.20 | 10.12 | 1.29 | 1.00 | 2.91 | 99.85 | ||||
| 3017359699643655552 | bIII+*!17 | 209.1160 | -19.3226 | 142.85 | 0.12 | 10.02 | 0.05 | 7.120.46 | 60.25 | |||||
| 3015334914608642688 | aI*2 | 212.5184 | -19.6520 | 30.79 | 3.48 | 9.79 | 2.09 | 0.90∗ | 2.61 | 94.37 | ||||
| 3017251913133545984 | bII+*!63 | 209.2630 | -19.4002 | 26.65 | 0.25 | 9.77 | 0.16 | 1.66 | 2.051.69 | 93.65 | ||||
| 3017260022031719040 | aII+1 | 209.1180 | -19.8014 | 15.04 | 0.45 | 9.67 | 0.36 | 3.76 | 3.703.11 | 165.32 | ||||
| 3209429503235627776 | cII+!81 | 208.7776 | -19.6471 | 183.18 | 0.36 | 9.23 | 0.19 | 0.64 | 4.612.54 | 221.29 | ||||
| 3017247240209309056 | cI+*!95 | 209.3667 | -19.4278 | 169.11 | 0.36 | 9.09 | 0.15 | 0.87∗ | -0.00 | 7.471.27 | 96.97 | |||
| 3215872396561733504 | aII4 | 207.4842 | -18.8537 | 16.02 | 1.61 | 8.31 | 1.23 | 20.633.20 | 0.90 | 289.18 | ||||
| 3017252600328207104 | aII+*!4 | 209.1973 | -19.5143 | 14.34 | 0.23 | 7.95 | 0.19 | 4.66 | 0.951.61 | 124.63 | ||||
| 3017360799155290368 | aIII+*!23 | 209.0703 | -19.3429 | 1.36 | 0.07 | 7.14 | 0.06 | 4.280.51 | 56.33 | |||||
| 3017367533662951936 | aII+!4 | 208.9002 | -19.3112 | 35.87 | 0.13 | 6.98 | 0.16 | 3.54 | 7.541.41 | 303.89 | ||||
| 3017346986540958208 | bII*!650 | 209.1877 | -19.3880 | 178.42 | 0.18 | 6.60 | 0.11 | 1.53 | 91.28 | |||||
| 3017364127743299328 | aIII+!14 | 209.0039 | -19.3738 | 1.96 | 0.01 | 6.60 | 0.01 | 0.130.08 | 334.86 | |||||
McBride & Kounkel 2019 compiled a list of 5988 known Orion A complex YSO members from the literature, with 4346 of these that are part of the Gaia DR2 catalog and therefore part of the initial 122 million sources around of the ONC. From these, 2598 pass the clean sample criteria defined on §III and 432 of these were found by our 2D trace-back condition. Note that the 5988 sources listed by McBride & Kounkel 2019 are members of the whole Orion A complex, while the 432 sources selected by the 2D trace-back method are sources that we estimate came from the ONC or are currently within 10′ of it.
We note that our 2D traceback method, in addition to finding outward moving sources, also identifies ONC members that are currently within 1.2 pc, i.e., 10′, of the ONC, but moving towards the ONC center. We have measured the radial component of the proper motion of individual stars as , where denotes the direction moving away from the ONC. After correcting for perspective expansion caused by the radial motion of the ONC with respect to the Sun (van Leeuwen 2009; Kuhn et al. 2019, see), the weighted median radial proper motion with respect to the ONC center for sources in this region is when using the membership list of Da Rio et al. 2016, This value is smaller than that measured by Kuhn et al. 2019 (). This may be due to the different membership list used, but also because we are only measuring within the half mass radius of the ONC, which should be mostly populated by bound stars. Including a wider area would also include a larger fraction of unbound stars moving outwards. Our estimated value and the distribution shown in the left panel of Figure 7 means there is no evidence for the expansion (or contraction) of the ONC center. We have checked that within this region, the ONC only shows an expansion signature when the sample is contaminated, i.e., rising to a maximum value of if all sources in this region are used.
We list the properties of highest ONC-frame velocity ONC member sources in Table 3, displaying down to 6 , which is estimated to be twice the 2D velocity dispersion of the ONC, i.e., , where (Da Rio et al. 2017).
The first section of Table 3 shows runaway candidates reported by McBride & Kounkel 2019. They found 9 sources coming from the center of the ONC, of which we recover 7. The two sources that we do not recover, V1916 Ori and 2MASS J05382070–0610007, were filtered out in §III because both have high RUWE. We also recovered Brun 711 (aIII+!4), which was reported as a visitor of the ONC. Given its trajectory and very high , we agree that it likely did not come from the ONC center. From the remaining group, 2MASS J05351295–0417499 (bI+!4), is the fastest candidate with in the ONC frame. However, it does require a quite high radial velocity to reach the ONC (158 ). The two sources that follow are aI+ sources, V1440 Ori (aI+2) and CRTS J053223.9–050523 (aI+3) which pass all flags, therefore are very likely true runaway stars. The next sources, Haro 4–379(bI+*1) and V1961 Ori (bII+9), are scored as b but are very close to passing the failed WYSO flag. Thus their chances to be true YSOs are still high, and anyway more evolved YSOs, and especially runaways, may have lost their infrared excess. Similar considerations apply to Brun 259 (bII+13), which has P(YSO) . The remaining source V1321 Ori (bII+!29) is too bright for the variability test, although it has been classified as variable by the All Sky Automated Survey (Pojmanski 1998), but has a low P(YSO)(0.21).
From the 432 ONC members selected by the 2D traceback method, 57 have a higher than the 100 threshold. This only means that they likely did not come from the 10′ search area used in this work, however it does not mean that they did not come from other regions of the ONC complex. The right panel of Figure 7 shows the proper motion distribution for all Orion members that were traced back to the ONC using the 2D traceback method. The source with the highest is 2MASS J05430583–0807574 (bI+*!6) which moves with , however it requires a very high radial velocity (-697 ) to reach the ONC, and does not pass the RV flag criterion. In fact, many Orion members do not pass the RV flag criterion, which means that they may not have come from the ONC, but rather from other regions of the Orion complex. We also show the distribution for traced back Orion members that pass the RV flag as a solid gray line of Fig. 7 right. The two fastest sources that likely came from the ONC are actually AE Aur and Col, that stand far from the next 3D traced back source with 9.6 , which is Haro 4–379 (McBride & Kounkel 2019, source f in).
V.3 New sources
In this section we preset runaway candidates that fulfil various flags and that were not flagged as members of the ONC in the literature. Table shows the best candidates from this group sectioned by score. The first three sections show sources with score aI+, aII+ and aIII+, sorted by their transverse velocity in the ONC frame within each section. The following three sections show best scored sources, but that fail the position angle flag, i.e., sources scored aI+*, aII+* and aIII+*. The trajectories of these sources are shown in Figure 8, color coded by their score.
We can see in Table that the best candidate in the catalog, i.e., source aI+1, aka 2MASS J05332200–0458321, has not been flagged as being a member of the ONC in the literature. This source moves with a transverse velocity of 25.29 in the ONC frame and was ejected 170,000 years ago. This source has been reported before by Rebull et al. 2000 as a M6 star, and very recently it was also reported as runaway candidate for Schoettler et al. 2020 who estimated an age of Myr using PARSEC isochrones. This source is at 388 parsec form the Sun and we can see from Table that its 3D distance from the ONC, , is 25 pc. While its transverse velocity is high, it is also quite close to the ONC in projection, i.e., currently at 40’.
The other candidates that fulfil all flags and have not previously been noted as members of the ONC are DR2 3017304105587577728 (aI+7), which has a transverse velocity of 4.55 , and DR2 3209532616814106112 (aI+17), which has . Both sources have small transverse velocities within the recent estimates of escape speed of 5.6 (Kim et al. 2019), so they are most likely still bound to the ONC.
As discussed in §IV.5, the PA flag shows candidates outside the zone in the sky that is most contaminated by Galactic streaming of stars. Next, we examine sources that are positive on all criteria, but that happen to be in this contaminated zone, and therefore there is a higher chance that they are false positives. There are 79 sources scored a+*, of which 32 are scored aI+*. Out of these 32 sources, only one of them is not already identified as an ONC member. This source is DR2 3015321754828860928 (aI+*1), which moves with a high transverse velocity 80.31 . Its current position is 3.65 degrees from the ONC and it was ejected 280,000 years ago. This source does not appear in other catalogs on Simbad, but given its luminosity is very likely to be a low-mass star. This source was also selected by the recent work of (Schoettler et al. 2020), who estimated an age of Myr.
V.4 Sources with measured radial velocities
About 7% of sources in our sample have measured radial velocities. None of them have been scored with the maximum score of aI+. The best source found with available radial velocity is source aII4 (2MASS J05343170–0351513), which is a known ONC YSO (Megeath et al. 2012), with a radial velocity of 20.63 , which is within the range of the estimated distribution to reach the ONC center, i.e., the range 19 – 27 . We note that this source is very close to passing the CA flag with and therefore it likely came from the ONC.
There are three previously unknown members of the ONC scored aIII+ and 7 in the contaminated zone with score aIII+*. Table 4 summarizes the properties of a+ candidates with available radial velocities. All these sources are too bright to be evaluated by variability and were not available on AllWISE. Source aIII+3 (TYC 4762–492–1), is the source with one of longest traceback time of the group with Myr. However, when tracing back in 3D space, we obtained a traceback time Myr. Its closest approach to the ONC in 3D is pc and is currently at 186.2 pc from the ONC. Other sources with long are sources aIII+*7 (HD 36343, Myr) and aIII+*3 (CD-23 2974, Myr). Both of these are already classified as high proper motion stars, but with the radial velocity measured by Gaia, we estimate their trajectories approach to the ONC as close as pc and pc respectively when using straight lines trajectories. A more comprehensive analysis, including allowance for the effects of nonuniform motion, would be needed to discard or confirm such sources.
Two sources in this list are also identified by Schoettler et al. 2020 as visitors of the ONC, given their isochronal age estimates ( Myr). These are sources aIII+1 and aIII+*4 (TYC 5354-1317-1). We confirm that the trajectories of these sources overlap with that of the ONC, and we estimate their closest approach distances are pc and pc, respectively. Source aIII+1 does not appear in other catalogs on Simbad.
V.5 Color-magnitude diagram
Valuable insight can be obtained by examining the position in the HR diagram of the best scored candidates discussed in the previous sections. Figure 9 shows the color-magnitude diagram using the Gaia photometry system, corrected by extinction and color excess as described in §IV.1. Black circles show the 17,000 sources selected by the 2D traceback method. We have highlighted the best scored candidates grouped in aI+, aII+ and aIII+, including sources that fail the PA flag and known members of the Orion A complex. We see that in general aI+ and aII+ new candidates (star symbols with labels) are consistent with the rest of ONC members with the same score, while the aIII+ group contains a group of new candidates that populate the bright end of the main sequence, which is not populated by Orion members in the same group. Most of this group of sources are currently at least several degrees away from the ONC (see Figure 8).
The brightest new source is HD 36343 (aIII+*7), a high proper motion star with available radial velocity not yet associated to any parent cluster. We estimated a closest approach to the ONC, using linear 3D traceback, of pc about 2.4 Myr ago. A more comprehensive method will be needed to confirm or discard this source. The next brightest new source is V* V566 Ori (aIII+9), a variable star not marked as member of the Orion A complex, but that is just 12′ away from the ONC, but 28.4 parsecs away in terms of 3D distance. While it moves at low speed (2.44 ) it could still have originated from the ONC given its distance and missing radial velocity. Source Brun 252 (aIII+5) is quite close to the main sequence, but has been classified as an irregular variable (Rodríguez-Ledesma et al. 2009).
VI High velocity distribution of the ONC
VI.1 Method of estimating the observed distribution
Farias et al. 2019 discussed how the statistics of the unbound stellar population created by dynamical ejection events can be an important constraint on star cluster formation models (Schoettler et al. 2019, see also). However, to obtain such constraints one needs to be careful about how models are compared to observational data. While masses and ages of individual stars are challenging to determine, individual velocities rely only on astrometric measurements, such as proper motion and parallax. Unfortunately we do not have radial velocities for most of the sources from Gaia. However, with the unprecedented accuracy of parallax and proper motion measurements, we can obtain reliable transverse velocities for the ONC members and candidate runaways. In this section, we construct the high-velocity distribution of the ONC. We start this analysis, by taking the membership list used in Da Rio et al. 2016. Since such a membership list contains sources from the whole Orion complex, we select sources within 20′ around the core of the ONC, which counts 740 sources flagged as members by Da Rio et al. 2016 and that are also observed by Gaia. Figure 10 shows the transverse velocity for these sources versus the different quality criteria described in §III. Most of these sources do not pass all quality criteria (shown as green areas), but the 336 sources that pass (green symbols) are part of the initial sample. From these 336 ONC members in the clean sample, 220 are captured by the 2D traceback method described in §III.
Since not all of these sources have reliable astrometry, we used the distance estimations of Bailer-Jones et al. 2018 in order to calculate transverse velocities. The resulting velocities do not change significantly for the sources that pass the quality cuts, but this step improves results considerably for sources with relatively low quality. As can be seen in Figure 10, most of the sources with have large errors in their parallax (), as well as large RUWE, which means that the observations are not consistent with the astrometric model used by Gaia. Therefore, most of the sources with high may be caused by uncertainties in astrometry and we exclude such sources from the sample.
Figure 11 shows the distribution of sources with high . The distribution obtained when using only known ONC members that were traced-back using the method described in §III is shown in red. There are 17 sources with velocities above 10 in this sample with a rapid decrease in numbers as the velocity cut increases, with the fastest source V* V1175 Ori .
| Gaia ID | Label | distance | ||||||||
|---|---|---|---|---|---|---|---|---|---|---|
| Score | [J2015.5] | [J2015.5] | (pc) | (pc) | (∘) | (Myr) | (km/s) | (Myr) | (pc) | |
| 2983790269606043648 | aIII+*2 | 218.7332 | -25.2234 | 85.11 | 11.23 | 67.83 | 16.611.40 | 14.4 7.9 | ||
| 2963542281945430400 | aIII+*3 | 227.4895 | -25.5259 | 229.65 | 18.98 | 79.76 | -12.910.62 | 97.2 4.7 | ||
| 3009308457018637824 | aIII+*4 | 216.0105 | -20.9758 | 66.18 | 7.08 | 91.72 | -43.860.87 | 15.010.4 | ||
| 3021115184676332288 | aIII+1 | 212.0112 | -12.5996 | 53.47 | 7.72 | 57.83 | 31.890.81 | 0.8 6.5 | ||
| 3008883530134150016 | aIII+*5 | 216.3451 | -21.7671 | 105.38 | 7.61 | 77.44 | -27.000.87 | 22.519.4 | ||
| 2969823139038651008 | aIII+*6 | 220.6746 | -25.7842 | 132.45 | 13.11 | 61.34 | 6.371.08 | 53.9 7.0 | ||
| 2984725369883664384 | aIII+*7 | 216.4166 | -23.9746 | 227.51 | 8.66 | 80.38 | -34.640.14 | 91.1 6.6 | ||
| 3184037106827136128 | aIII+3 | 207.1251 | -27.2355 | 186.25 | 8.42 | 63.01 | -26.5816.44 | 42.5 9.4 | ||
| 3209424795953358720 | aIII+5 | 208.8879 | -19.5649 | 26.23 | 0.22 | 6.18 | 22.203.81 | 8.2 8.1 | ||
| 3017364028971010432 | aIII+6 | 209.0086 | -19.4010 | 12.32 | 0.02 | 12.04 | 15.7712.22 | 0.511.7 | ||
| 3017367391918532992 | aIII+7 | 208.9169 | -19.2701 | 37.61 | 0.15 | 10.02 | 17.289.08 | 4.711.2 | ||
| 3017359871442791168 | aIII+*11 | 209.0968 | -19.3799 | 24.31 | 0.09 | 3.54 | 25.987.39 | 12.512.6 | ||
| 3017358978089804672 | aIII+*12 | 209.1422 | -19.4126 | 17.28 | 0.14 | 5.01 | 23.1414.82 | 3.213.6 | ||
| 3017364544367271936 | aIII+10 | 208.9696 | -19.4842 | 18.35 | 0.11 | 5.11 | 22.3810.35 | 3.6 6.2 | ||
| 3209521037582290304 | aIII+13 | 208.8633 | -19.3789 | 21.52 | 0.14 | 22.97 | 4.169.09 | 1.211.8 | ||
| 3017360554330360320 | aIII+*13 | 209.0450 | -19.4281 | 25.61 | 0.06 | 7.03 | 20.3313.98 | 3.920.7 | ||


We have also included the corresponding distributions using the best-scored candidate runaways from this work. However, before describing such distributions, we first discuss some possible systematic uncertainties due to contaminants in our sample. As mentioned in previous sections, there is a region in the sky, which we have characterized as being from PA = 50∘ to 160∘, i.e., pointing approximately parallel to the Galactic plane, where most projected Galactic orbits appear to move away from the ONC, causing an asymmetry on traceback selection and increased levels of contamination of the sample with false positives. In order to see how this contamination affects the constructed velocity distributions, we proceed with the following analysis using two approaches: Method 1: construct the velocity distribution ignoring the effects of this higher contamination zone; Method 2: construct the velocity distribution by using only the region of the sky outside this contamination zone, i.e., using only sources that pass the PA flag. Then final numbers are boosted by a statistical correction factor of 1.44 that accounts for the missing region of the sky that was not considered. During the following description, the left column of panels in Figure 11 shows results using Method 1, while the right column shows results using Method 2.
Starting with Method 1, in order to include the best candidates in the sample, we first examine all a scored candidates that pass the RV flag, i.e., with scores aI(*), aII(*), aIII(*), which includes sources that fail the PA flag. We can see from this distribution that even this sample is still likely to be highly contaminated with false positives (see top left panel in Figure 11). We consider that this distribution is unreliable for representing the true ONC high velocity population.
We next constructed another velocity distribution using only the best candidates from our sample, i.e., the sources with scores aI, but still also including sources that fail the PA flag that pass the RV criteria. This method selects a smaller fraction of candidates (black filled circles on Figure 11), which are more likely to be true runaways.
Then, the Method 1 estimate for the sample for the high velocity tail is composed by a combination of our best candidates (95 sources), 272 traced back members from Da Rio et al. 2016 that pass all the astrometric quality criteria (red filled circles on Figure 10) and we have also added AE Aur and Col to the final sample, that, given some overlap, has 314 sources. We show this profile as a solid line in the top left panel of Figure 11, which is the combination of the open red and black filled circles with the addition of Col and AE Aur that are not part of either sample.
The Method 2 estimate follows the same procedure as Method 1, described above, except excluding sources from the Galactic streaming contaminated zone. With this removal of sources that fail the PA flag, the total number of sources drops to 126. Once boosted by the correction factor of 1.44, the estimated number of sources in the high velocity distribution is 181.
VI.2 Comparison with theoretical models
Farias et al. 2019 conducted a series of numerical simulations of star cluster formation, which have some properties that are similar to those expected of the ONC. Idealised molecular clumps bounded by environments with different mass surface densities were evolved from the earliest, gas-dominated stages, via gradual formation of stars at various rates, until the systems were completely gas-free. Modeling was conducted until 20 Myr after the exhaustion of their natal gas. We have considered various examples of these models and compared their velocity distributions to that derived for the ONC.
The selected set of models are 3000 molecular clumps, approximated as singular polytropic spheres (McKee & Tan 2003), with a constant overall star formation efficiency of and different star formation efficiencies per global average free-fall time (). Models include 50% primordial binaries. Stellar evolution, including supernovae velocity kicks, is included. Simulations were performed using Nbody6++ (Aarseth 2003; Wang et al. 2015), but modified to allow the gradual assembly of star clusters including primordial binaries and a custom background potential to emulate the influence of the background gas. Depending on the model parameters, i.e., molecular cloud mass (), overall star formation efficiency, surrounding cloud mass surface density () and , star cluster formation spans over a wide range of timescales. We have selected three sets of models that are are finished with their star formation at 1, 3 and 6 Myr. First, a low density model with , and in which the cluster forms over 6.5 Myr. Second, a model in which the surface density is increased 10 times, , but with the same . In this case the star formation takes 1.2 Myr. For the third model, the mass surface density is also , but is smaller, i.e., , so that star cluster formation takes place over 3.35 Myr (see Farias et al. 2019, for further details).
Using these models we have constructed a 2D velocity distribution in order to compare with the ONC. We have constructed this 2D velocity distribution by discarding one of the velocity components in the simulations using snapshots at 1, 3 and 4 Myr. In general, we expect the high velocity population to grow as time evolves, i.e., after there has been more time for close stellar encounters leading to dynamical ejections. The bottom panel of Figure 11 shows the obtained distributions for these models. Distributions are medians of 20 realizations for each model, normalized by the current total number of member stars. The 16th and 84th percentiles are shown as the corresponding dashed lines. Note that these simulations have 50% primordial binaries and the binary fraction does not change significantly during the evolution of the cluster. For our comparison, each binary pair is counted as one single star, as it would be if such systems are not resolved, and velocities shown in the distribution are obtained from the center of mass velocities from each pair.
We compare these results with the obtained observational distributions in the previous section (solid black lines in the top panels). The total number of members of the ONC is uncertain. However for this comparison we use the total stellar mass within 3 pc estimated by Da Rio et al. 2014, of 3000 . Using a canonical mass function (Kroupa 2001) within a range between 0.01 to 100 , the mean stellar mass is . However, if we assume a binary fraction and ignore higher order multiples, the mean mass per system is (Farias et al. 2017, see) . Then the number of stars including unresolved binaries in the ONC with an estimated stellar mass of 3000 is . We normalize the observed distribution by the obtained assuming a total stellar mass between 2000 to 4500 , i.e., with . In order to reach such numbers from the samples of 316 and 181 members and candidates, we complement such samples with transverse velocities drawn from a Maxwell-Boltzmann distribution with as it has been estimated in the ONC by various authors (Jones & Walker 1988; Da Rio et al. 2016; Kim et al. 2019). We show the complementary distributions used in the top panels of Figure 11, which yields the grey shaded area in the lower panels of Figure 11. Note that since our sample has been initially cleaned using the RUWE parameter, it could potentially be missing a fraction of unresolved binaries that are ONC members. In the simulations we have included unresolved binaries in the distributions. However we have checked that in the ejected population above 10 the fraction of binaries is below 5%, and therefore we expect that any potential discrepancy due to this method has a small effect.
The second row panels in Figure 11 show the comparison with the low density cluster models (), where we can see that they are not able to produce enough high velocity runaways during such early phases. Also, the velocity dispersion of these simulated clusters is much smaller than that of the ONC.
In the third row of panels we see that these denser clusters are able to produce a similar number of high velocity stars, i.e., above 10 , as inferred in the ONC. However, given the shorter dynamical times of these models, star formation is exhausted at 1.2 Myr. During this phase, when background gas is still present, the velocity dispersions of the simulated clusters are quite constant. However, as soon as the gas is depleted, the star cluster expands and the velocity dispersion drops, as can be seen in the low velocity end of the distribution. However, at these later times most of the strongest dynamical processing has already taken place and so the high velocity tail does not change too much after this. In the final set of models shown in the bottom row panels, star formation is less efficient and star cluster formation takes longer. While these models have a similar velocity distribution as the previous case, they are still forming stars at 3 Myr. In this respect they are a better fit to the proposed age of the ONC. However, we note that these clusters have half-mass radii of pc at 3 to 4 Myr, which is a few times smaller than that of the ONC.
In this third set of simulations at 3 Myr the median velocity distribution is quite similar to the one estimated for the ONC, especially via Method 2, although the simulated distributions on average tend to be less populated at the highest velocities above 45 . Still, even here the discrepancy is minor, considering the distribution in the simulations (i.e., the line of the 84th percentile) and the Poisson sampling uncertainties in the observed distribution.
Considering the global average number densities of systems inside the half-mass radius, these last set of high density simulations have a few 1000 stars pc3 during the first Myr, rising to by 2.5 Myr and then declining significantly during the next few Myr, i.e., once the gas is exhausted and the cluster expands (Farias et al. 2019, see Figure 7 at). Such properties may be quite similar to those expected during the formation and evolution of the ONC. However, it should be emphasized that these simulations have not been designed to match properties of the ONC. We expect within the possible parameter space of the models there will be clusters that can be a better match. The models are also relatively simple in that they so far do not assume any global elongation or spatial or kinematic subclustering of stars when they are born. Other assumptions to be investigated include effects of different initial dynamical states (currently the initial clump is in approximate virial equilibrium, including near equipartition magnetic fields), different degrees of primordial mass segregation (currently none is assumed) and the effects of primordial triples and higher order multiples (currently there are none). Overall, these observational measurements and comparisons provide a baseline to help develop and study the influence of these new ingredients in the star cluster models.
VII Discussion & Conclusions
Using the unprecedented astrometric accuracy of Gaia DR2, we examined a wide region extending out to 45 around the ONC to search for runaway (or walkaway) stars it may have produced. Within this area we have selected 16,994 sources that have a 2D trajectory in the sky that brings them back to the ONC in the recent past. Most of these are expected to be contaminants. Thus, using different criteria based on signatures of youth and astrometric accuracy, we have developed a scoring system that allowed us to filter and select the most likely runaway candidates. In particular, we have selected a set of 25 candidates that do not fail any of the tests, except for being in the zone of most contamination from Galactic streaming. These have not been associated with the Orion A complex or the ONC previously. Six of these sources pass all the signatures of youth tested in this work, i.e., variability, color-magnitude selection and IR YSO classification, and the fastest is escaping with a transverse velocity of 65 in the frame of reference of the ONC. From the 1200 sources in the sample with available radial velocities 491 pass the most stringent radial velocity criterion to achieve 3D traceback, from which a small sample of 10 new sources (a subset of the 25 found above) do not fail any signature of youth flag, and therefore are strong runaway candidates.
Within the traceback sources, we have examined already known members of the Orion A complex. Since the traceback method selected sources whose trajectories were consistent with the one of the ONC within its half mass radius as a threshold, current sources within this limit were all selected. We have examined the outward proper motions within this area and found no signatures of radial expansion of the cluster center, with an outward median proper motion of (), when using only literature members in the measurement. While membership classification is somewhat challenging and a fraction of these sources may be non-member contaminants, we have shown that even if we use the whole sample, with reliable astrometric measurements, outward motions can only rise to a value of , which is still not a clear sign of cluster expansion. This result suggests that the ONC center may have already reached dynamical equilibrium supporting the idea of a dynamically old system, even though it is still in the process of forming stars (Da Rio et al. 2016; Da Rio et al. 2017, see also).
Since the vast majority of sources in our traceback sample do not have measured radial velocities, we have computed the distributions of radial velocities that minimize the closest 3D trajectory to the ONC. We have obtained these distributions by sampling each astrometric quantity within their errors using a Monte Carlo approach. This derived sub-product of this work can be very useful for quickly distinguishing good candidate runaways when new RV measurements are obtained in the future. However, even though we have only used sources with the best astrometry, there are still a considerable group of sources whose range of optimal velocities are extremely large, and for which this metric does not provide very strong constraints on an ejection scenario. The selection criterion we used with this quantity was then rather restrictive, since we marked as negative sources with required radial velocity above 100 . Such a restrictive threshold was designed to eliminate most false positives, however some runaway stars with larger velocities are still possible and may still be hidden in our sample.
We have also estimated the total high velocity distribution of the ONC using the known and new members with the best astrometry and membership probability, selecting a sample of about 200 to 300 sources, depending on the method. While there are still significant systematic uncertainties in the estimation of this distribution, we have compared it with theoretical models based on simulations that include realistic fractions of primordial binaries and gradual formation of stars, which are necessary components for accurately capturing rates of dynamical ejections. These simulations can successfully reproduce the normalization and shape of the estimated velocity distribution of the ONC, however only when using higher density models () with relatively slow star formation (). A more general exploration of simulation parameter space for clusters specifically designed to match the ONC is the next step to be conducted.
Very recently we have become aware of a parallel work from (Schoettler et al. 2020), who have performed a similar observational search for runaway stars from the ONC, but restricting to a smaller region extending only 100 pc away, i.e., up to 14from the cluster. They also performed N-body simulations of clusters, which in their case were initialised with sub-virial, fractal distributions of stars with a primordial binary fraction that depends on primary mass (50% on average). While the ultimate goal of their study is similar to this work, their methods of selection and classification of sources are very different. Some of the main differences are that they base the classification in the comparison with the traceback time and the estimated ages for their sources using isochrone fitting from PARSEC (Bressan et al. 2012). They were quite restrictive on the age of the ONC, excluding from the runaway lists sources with ages larger than 4 Myr. While this is a reasonable limit for most ONC stars (Da Rio et al. 2016), we consider that it may be too restrictive a choice given the uncertainties in age estimates of individual stars from isochrone fitting. Schoettler et al. 2020 have reported 54 walkaway candidates with velocities between 10–30 and 31 runaway candidates with velocities above 30 . From their sources, we recovered 22 out of 31 runaways and 32 out of their 54 walkaways, but give them varying degrees of likelihood of being true runaways. On the other side, from our 25 best candidates they have listed 4 as being ejected from the ONC and 2 as visitors. These differences in the number of selected sources, given that we observed a wider area, likely arise from the fact that we do a more restrictive initial astrometric cleaning and that we also use a more restrictive baseline boundary for the traceback method, i.e., the half mass radius of the ONC (1.2 pc) compared to the 2.5 pc boundary used in their work. Two of their walkaway and two of their runaway stars are among our top ranked candidates. These walkaways are sources aI+1, which is our fastest source that passes all the flags (their estimated age for this source is Myr), and aIII+4 that we could not evaluate on variability or YSO probability (their estimated age for this source is Myr). The coinciding runaway candidates are sources aI+*1 and aII+*1, that fulfill all quality criteria, but that we note are in a zone contaminated by Galactic streaming. Based on age, they have flagged as candidates two sources that we confirm likely come from the ONC based on 3D traceback, these are sources aIII+1 and aIII+*4, for which they have estimated ages larger than 20 Myr.
The majority of the sources presented here, together with most of the candidates presented by Schoettler et al. 2020, have missing radial velocities. One of the most important follow-up observations stimulated by this work thus involves radial velocity measurements of our candidate runaways to confirm their ejection with the more restrictive 3D traceback criterion.
We remark that one important goal of finding the oldest ejected runaways, which may be currently hidden among a cloud of Galactic field contaminants, is to constrain the star formation history of clusters, i.e., the timescale of star cluster formation. For the ONC, this runaway age constraint is still set by Col and AE Aur, ejected about 2.5 Myr ago (Hoogerwerf et al. 2001). The formation time is obviously a basic parameter for cluster formation theories (Tan 2006; Nakamura & Li 2007, e.g.) and also influences estimates of fundamental star formation properties, such as the efficiency per freefall time (Da Rio et al. 2014, e.g., ). The cluster formation time is also directly related to the formation timescale of massive star formation in competitive accretion models (Wang et al. 2010) as discussed by Tan et al. 2014. Thus a dedicated search to find relatively old, likely lower-mass runaways from the ONC should be attempted, with a starting point from our main 2D traceback sample.
References
- Aarseth (2003) Aarseth, S. 2003, Gravitational N-Body Simulations, ed. Aarseth, S.˜J. (Cambridge University Press)
- Andrae et al. (2018) Andrae, R., Fouesneau, M., Creevey, O., et al. 2018, A&A, 616, doi: 10.1051/0004-6361/201732516
- Bagnuolo Jr. et al. (2001) Bagnuolo Jr., W. G., Riddle, R. L., Gies, D. R., & Barry, D. J. 2001, ApJ, 554, 362, doi: 10.1086/321367
- Bailer-Jones (2015) Bailer-Jones, C. A. L. 2015, Publ. Astron. Soc. Pacific, 127, 994, doi: 10.1086/683116
- Bailer-Jones et al. (2018) Bailer-Jones, C. A. L., Rybizki, J., Fouesneau, M., Mantelet, G., & Andrae, R. 2018, AJ, 156, 58, doi: 10.3847/1538-3881/aacb21
- Bally et al. (2020) Bally, J., Ginsburg, A., Forbrich, J., & Vargas-González, J. 2020, ApJ, 889, 178, doi: 10.3847/1538-4357/ab65f2
- Bally & Zinnecker (2005) Bally, J., & Zinnecker, H. 2005, AJ, 129, 2281, doi: 10.1086/429098
- Beccari et al. (2017) Beccari, G., Petr-Gotzens, M. G., Boffin, H. M., et al. 2017, A&A, 604, 1, doi: 10.1051/0004-6361/201730432
- Becklin & Neugebauer (1967) Becklin, E. E., & Neugebauer, G. 1967, ApJ, 147, 799, doi: 10.1086/149055
- Blaauw (1961) Blaauw, A. 1961, Bull. Astron. Institutes Netherlands, 15, 265
- Blaauw & Morgan (1954) Blaauw, A., & Morgan, W. 1954, ApJ, 119, 625, doi: 10.1086/145866
- Bressan et al. (2012) Bressan, A., Marigo, P., Girardi, L., et al. 2012, MNRAS, 427, 127, doi: 10.1111/j.1365-2966.2012.21948.x
- Broos et al. (2013) Broos, P. S., Getman, K. V., Povich, M. S., et al. 2013, ApJS, 209, 32, doi: 10.1088/0067-0049/209/2/32
- Chatterjee & Tan (2012) Chatterjee, S., & Tan, J. J. C. J. 2012, ApJ, 754, 152, doi: 10.1088/0004-637X/754/2/152
- Cody & Hillenbrand (2014) Cody, A. M., & Hillenbrand, L. A. 2014, ApJ, 796, 129, doi: 10.1088/0004-637X/796/2/129
- Cutri & al. (2013) Cutri, R., & al., E. 2013, VizieR Online Data Cat.
- Da Rio et al. (2010) Da Rio, N., Robberto, M., Soderblom, D. R., et al. 2010, ApJ, 722, 1092, doi: 10.1088/0004-637X/722/2/1092
- Da Rio et al. (2014) Da Rio, N., Tan, J. C., & Jaehnig, K. 2014, ApJ, 795, 55, doi: 10.1088/0004-637X/795/1/55
- Da Rio et al. (2016) Da Rio, N., Tan, J. C., Covey, K. R., et al. 2016, ApJ, 818, 59, doi: 10.3847/0004-637x/818/1/59
- Da Rio et al. (2017) —. 2017, ApJ, 845, 105, doi: 10.3847/1538-4357/aa7a5b
- Evans et al. (2018) Evans, D., Riello, M., De Angeli, F., et al. 2018, A&A, 616, A4, doi: 10.1051/0004-6361/201832756
- Evans II et al. (2003) Evans II, N., Allen, L., Blake, G., et al. 2003, Publ. Astron. Soc. Pacific, 115, 965, doi: 10.1086/376697
- Eyer et al. (2019) Eyer, L., Rimoldini, L., Rohrbasser, L., et al. 2019. https://arxiv.org/abs/1912.07659
- Farias & Tan (2018) Farias, J. P., & Tan, J. C. 2018, A&A, 612, 1, doi: 10.1051/0004-6361/201732472
- Farias et al. (2017) Farias, J. P., Tan, J. C., & Chatterjee, S. 2017, ApJ, 838, 116, doi: 10.3847/1538-4357/aa63f6
- Farias et al. (2019) —. 2019, MNRAS, 483, 4999, doi: 10.1093/mnras/sty3470
- Fujii & Zwart (2011) Fujii, M. S., & Zwart, S. P. 2011, Science, 334, 1380, doi: 10.1126/science.1211927
- Gaia Collaboration et al. (2016) Gaia Collaboration, Prusti, T., de Bruijne, J. H. J., et al. 2016, A&A, 595, A1, doi: 10.1051/0004-6361/201629272
- Getman et al. (2017) Getman, K. V., Broos, P. S., Kuhn, M. A., et al. 2017, Astrophys. J. Suppl. Ser., 229, 28, doi: 10.3847/1538-4365/229/2/28
- Gies & Bolton (1986) Gies, D. R., & Bolton, C. T. 1986, ApJS, 61, 419, doi: 10.1086/191118
- Gualandris et al. (2004) Gualandris, A., Portegies Zwart, S., & Eggleton, P. P. 2004, MNRAS, 350, 615, doi: 10.1111/j.1365-2966.2004.07673.x
- Hoogerwerf et al. (2001) Hoogerwerf, R., De Bruijne, J. H. J., & de Zeeuw, P. T. 2001, A&A, 365, 49, doi: 10.1051/0004-6361:20000014
- Jerabkova et al. (2019) Jerabkova, T., Beccari, G., Boffin, H. M., et al. 2019, A&A, 627, doi: 10.1051/0004-6361/201935016
- Jones & Walker (1988) Jones, B., & Walker, M. F. 1988, AJ, 95, 1755, doi: 10.1086/114773
- Kim et al. (2019) Kim, D., Lu, J. R., Konopacky, Q., et al. 2019, AJ, 157, 109, doi: 10.3847/1538-3881/aafb09
- Koenig & Leisawitz (2014) Koenig, X. P., & Leisawitz, D. T. 2014, ApJ, 791, doi: 10.1088/0004-637X/791/2/131
- Kounkel et al. (2018) Kounkel, M., Covey, K., Suárez, G., et al. 2018, AJ, 156, 84, doi: 10.3847/1538-3881/aad1f1
- Kroupa (2001) Kroupa, P. 2001, MNRAS, 322, 231, doi: 10.1046/j.1365-8711.2001.04022.x
- Kroupa et al. (2018) Kroupa, P., Jeřábková, T., Dinnbier, F., Beccari, G., & Yan, Z. 2018, A&A, 612, A74, doi: 10.1051/0004-6361/201732151
- Kuhn et al. (2019) Kuhn, M. A., Hillenbrand, L. A., Sills, A., Feigelson, E. D., & Getman, K. V. 2019, ApJ, 870, 32, doi: 10.3847/1538-4357/aaef8c
- Lindegren et al. (2018) Lindegren, L., Hernández, J., Bombrun, A., et al. 2018, A&A, 616, A2, doi: 10.1051/0004-6361/201832727
- Luhman (2018) Luhman, K. L. 2018, AJ, 156, 271, doi: 10.3847/1538-3881/aae831
- Marrese et al. (2019) Marrese, P. M., Marinoni, S., Fabrizio, M., & Altavilla, G. 2019, A&A, 621, A144, doi: 10.1051/0004-6361/201834142
- Marton et al. (2019) Marton, G., Ábrahám, P., Szegedi-Elek, E., et al. 2019, MNRAS, 487, 2522, doi: 10.1093/mnras/stz1301
- McBride & Kounkel (2019) McBride, A., & Kounkel, M. 2019, ApJ, 884, 6, doi: 10.3847/1538-4357/ab3df9
- McKee & Tan (2003) McKee, C. F. C., & Tan, J. C. J. 2003, ApJ, 585, 850, doi: 10.1086/346149
- Megeath et al. (2012) Megeath, S. T., Gutermuth, R., Muzerolle, J., et al. 2012, AJ, 144, 192, doi: 10.1088/0004-6256/144/6/192
- Nakamura & Li (2007) Nakamura, F., & Li, Z.-Y. Z. Z.-Y. 2007, ApJ, 662, 395, doi: 10.1086/517515
- Nishimura et al. (2015) Nishimura, A., Tokuda, K., Kimura, K., et al. 2015, Astrophys. J. Suppl. Ser., 216, 18, doi: 10.1088/0067-0049/216/1/18
- Oh & Kroupa (2016) Oh, S., & Kroupa, P. 2016, A&A, 590, A107, doi: 10.1051/0004-6361/201628233
- Palla et al. (2005) Palla, F., Randich, S., Flaccomio, E., & Pallavicini, R. 2005, ApJ, 626, L49, doi: 10.1086/431668
- Palla et al. (2007) Palla, F., Randich, S., Pavlenko, Y. V., Flaccomio, E., & Pallavicini, R. 2007, ApJ, 659, L41, doi: 10.1086/516733
- Perets & Šubr (2012) Perets, H. B., & Šubr, L. 2012, ApJ, 751, doi: 10.1088/0004-637X/751/2/133
- Pojmanski (1998) Pojmanski, G. 1998. https://arxiv.org/abs/9802330
- Poveda et al. (1967) Poveda, A., Ruiz, J., & Allen, C. 1967, Bol. los Obs. Tonantzintla y Tacubaya, 4, 86
- Rebull et al. (2000) Rebull, L. M., Hillenbrand, L. A., Strom, S. E., et al. 2000, AJ, 119, 3026, doi: 10.1086/301393
- Rodriguez et al. (2005) Rodriguez, L. F., Poveda, A., Lizano, S., & Allen, C. 2005, ApJ, 627, L65, doi: 10.1086/432052
- Rodríguez-Ledesma et al. (2009) Rodríguez-Ledesma, M. V., Mundt, R., & Eislöffel, J. 2009, A&A, 502, 883, doi: 10.1051/0004-6361/200811427
- Ryu et al. (2017) Ryu, T., Leigh, N. W. C., & Perna, R. 2017, MNRAS, 470, 2, doi: 10.1093/mnras/stx1156
- Schoettler et al. (2020) Schoettler, C., de Bruijne, J., Vaher, E., & Parker, R. J. 2020, 20, 1. https://arxiv.org/abs/2004.13730
- Schoettler et al. (2019) Schoettler, C., Parker, R. J., Arnold, B., et al. 2019, MNRAS, 487, 4615, doi: 10.1093/mnras/stz1487
- Schönrich et al. (2010) Schönrich, R., Binney, J., & Dehnen, W. 2010, MNRAS, 403, 1829, doi: 10.1111/j.1365-2966.2010.16253.x
- Tan et al. (2014) Tan, J., Beltrán, M., Caselli, P., et al. 2014, in Protostars Planets VI, ed. H. Beuther, R. S. Klessen, C. P. Dullemond, & T. Henning, 149, doi: 10.2458/azu_uapress_9780816531240-ch007
- Tan (2004) Tan, J. C. 2004, ApJ, 607, L47, doi: 10.1086/421721
- Tan (2006) —. 2006, Proc. Int. Astron. Union, 2, 258, doi: 10.1017/S1743921307001573
- Tan et al. (2006) Tan, J. J. C. J., Krumholz, M. M. R., & McKee, C. F. C. 2006, ApJ, 641, L121, doi: 10.1086/504150
- Turon et al. (1992) Turon, C., Crézé, M., Egret, D., et al. 1992, Bull. d’Information du Cent. Donnees Stellaires, 41, 9
- van Leeuwen (2009) van Leeuwen, F. 2009, A&A, 497, 209, doi: 10.1051/0004-6361/200811382
- Wang et al. (2019) Wang, L., Kroupa, P., & Jerabkova, T. 2019, MNRAS, 484, 1843, doi: 10.1093/mnras/sty2232
- Wang et al. (2015) Wang, L., Spurzem, R., Aarseth, S., et al. 2015, MNRAS, 450, 4070, doi: 10.1093/mnras/stv817
- Wang et al. (2010) Wang, P., Li, Z. Y., Abel, T., & Nakamura, F. 2010, ApJ, 709, 27, doi: 10.1088/0004-637X/709/1/27
- Wright et al. (2010) Wright, E. L., Eisenhardt, P. R., Mainzer, A. K., et al. 2010, AJ, 140, 1868, doi: 10.1088/0004-6256/140/6/1868
- Zari et al. (2018) Zari, E., Hashemi, H., Brown, A. G., Jardine, K., & De Zeeuw, P. T. 2018, A&A, 620, 1, doi: 10.1051/0004-6361/201834150