Doppler imaging and differential rotation of Coronae Borealis using SONGJournal: ApJBased on observations made with the Hertzsprung SONG telescope operated on the Spanish Observatorio del Teide on the island of Tenerife by the Aarhus and Copenhagen Universities and by the Instituto de Astrofísica de Canarias.
Abstract
We present new Doppler images of both components of the double-lined binary CrB, based on the high-resolution spectroscopic data collected during 11 nights in 2015 March–April. The observed spectra form two independent data sets with sufficient phase coverage. We apply the least-squares deconvolution to all observed spectra to obtain high signal-to-noise mean profiles, from which we derive the Doppler images of both components of CrB simultaneously. The surfaces of both F9 and G0 components are dominated by pronounced polar spots. The F9 component exhibits a weak spot at latitude 30° and its mid-to-low latitudes are relatively featureless. The G0 star shows an extended spot structure at latitude 30°, and its surface spot coverage is larger than that of the F9 star, which suggests a higher level of magnetic activity. With the cross-correlation method, we derive a solar-like surface differential rotation on the G0 star of CrB for the first time, and the surface shear rate is rad d-1 and . We do not obtain a clear surface shear law for the F9 star due to the lack of mid-to-low latitude features, but detect a systematic longitude shift of high-latitude spots, which indicates a slower rotation with respect to the co-rotating frame.
Keywords:
Stellar activity (1580), Close binary stars (254), Doppler imaging (400), Starspots (1572)I Introduction
Solar-like stars with a convection envelope show cool starspots caused by strong local magnetic field on stellar surfaces. Doppler imaging is a powerful technique for the study of spot activity on rapidly rotating stars. Recently, various active single and binary stars have been investigated by means of the Doppler imaging technique (Strassmeier 2009). Unlike that on the Sun, persistent large high-latitude or polar spots are detected on many active stars with different stellar parameters (e.g. Collier Cameron & Unruh 1994; Rice & Strassmeier 2001; Hackman et al. 2019). The magnetic flux is affected by dominant Coriolis force within the convection zone of rapid rotators to form high-latitude magnetic fields (Schüssler et al. 1996; Granzer et al. 2000). The rising magnetic flux-tube can also be affected by the tidal force to emerge at preferred longitudes (Holzwarth & Schüssler 2003), which are present on many active binary systems (e.g. Berdyugina et al. 1998, Oláh 2006).
Differential rotation plays an important role in the stellar dynamo. Up to now, the solar-like latitude-dependent surface shear is detected on both of single and binary stars, with the help of the Doppler imaging (e.g. Barnes et al. 2000; Dunstone et al. 2008; Kriskovics et al. 2014; Özdarcan et al. 2016). Some stars show anti-solar differential rotations (e.g. Weber 2007; Kővári et al. 2007; Kővári et al. 2017; Harutyunyan et al. 2016), which means the equator rotates slower than the stellar pole. Gastine et al. 2014 suggested that the direction of differential rotation is determined by the Rossby number and the domination of the Coriolis force.
CrB (TZ CrB, HD 146361, HR 6063) is a component of the multiple system Coronae Borealis. Other components include a solar-like star CrB and an M dwarf binary (Raghavan et al. 2009). CrB is an active, double-lined binary, consisting of an F9 and a G0 stars, with an orbital period of about 1.14 d and an inclination degree of 28° (Strassmeier & Rice 2003; Raghavan et al. 2009). Both components of CrB are young stars, which are on or close to zero main sequence. The components are very similar in mass, stellar radius, effective temperature and evolutionary status (Strassmeier & Rice 2003).
Since both of the components are rapid rotators, CrB is an ideal target for Doppler imaging and the two stars can be imaged simultaneously. Strassmeier & Rice 2003 presented the first Doppler images of both stellar components of CrB, and revealed dominant cool polar spots as well as equatorial warm belts. The warm belt are located at the trailing hemisphere of each star with respect to the orbital motion. Donati et al. 1992 detected magnetic signatures for the G-type star from the Stokes V profiles, but did not for the F-type component. The Stokes V variations are mainly located in the profile core rather than in the wings, which suggests high-latitude magnetic field on the G-type component (Donati et al. 1992). The surface magnetic fields of both components were detected by Rosén et al. 2018 with the Zeeman-Doppler imaging technique, based on the polarization spectra data collected in 2014 and 2017, and the field strength of the G0 star is significant stronger than that of the F9 star during their observing seasons.
We continued to monitor spot activity of a series of active binaries (Gu et al. 2003; Xiang et al. 2014; Xiang et al. 2015; Xiang et al. 2016; Xiang et al. 2020). In this work, we present the Doppler images of both components of CrB, based on the spectral data collected in 2015 March-April. We shall describe the observations and data reduction in the Section 2. The surface images will be given and discussed in Section 3 and 4, respectively. We shall summarize the final results in Section 5.
II Observations and data reduction
High-resolution spectroscopic observations of CrB were carried out with the 1m Hertzsprung SONG telescope at the observatorio del Teide, Tenerife, Spain, from 2015 March 27 to April 15. Stellar Observations Network Group (SONG) plans to construct a global network of 1m robotic telescopes, and the Hertzsprung SONG telescope is the first node (Andersen et al. 2014; Andersen et al. 2019). The telescope is equipped with a high-resolution èchelle spectrograph (Grundahl et al. 2017). The resolution of the observed spectra is 75 000 and the coverage is 4400–6900Å. For each frame, the exposure time was set to 600s, which is corresponding to 0.6 per cent of the rotational period of CrB.
A total of 361 spectra were collected during the observing run. The 1D spectra were extracted with the SONG pipeline (Corsaro et al. 2012; Antoci et al. 2013). CrB has a nearly integral-day period, which makes it difficult to observe effectively. We have observations of 11 nights, which are sufficient for two independent Doppler images. Thus these observed spectra were split into two data sets. One contains 179 spectra spanning from 2015 March 27 to April 7, and the other one contains 182 spectra spanning from 2015 April 8 to April 15. Both data sets provide a very good phase coverage and dense sampling for the Doppler imaging of CrB. The largest phase gap in the first data set is 0.04, and in the second data set is 0.05. We summarize the observations of CrB of each night in 2015 in Table 1.
| UT Start | UT End | No. of frames | Exp. time |
|---|---|---|---|
| 03-27 23:49 | 03-28 06:18 | 39 | 600 |
| 03-31 23:02 | 04-01 06:13 | 39 | 600 |
| 04-02 22:57 | 04-03 06:17 | 44 | 600 |
| 04-04 22:35 | 04-05 03:10 | 28 | 600 |
| 04-06 23:58 | 04-07 04:48 | 29 | 600 |
| 04-08 22:19 | 04-09 06:10 | 47 | 600 |
| 04-10 22:41 | 04-11 06:00 | 44 | 600 |
| 04-11 22:07 | 04-12 06:05 | 12 | 600 |
| 04-12 23:22 | 04-13 06:02 | 33 | 600 |
| 04-14 00:13 | 04-14 00:33 | 3 | 600 |
| 04-14 22:46 | 04-15 05:55 | 43 | 600 |
We applied the Least-Squares Deconvolution (LSD; Donati et al. 1997) to combine all available atomic lines to obtain an average line profile with much higher signal-to-noise ratio (SNR). The stellar lines were extracted from the Vienna Atomic Line Database (VALD; Kupka et al. 1999) for a model atmosphere of = 6000K and log g = 4.5. The values of and log g of CrB are taken from Strassmeier & Rice 2003. The central wavelength and depth of spectral lines were used to create a line list which is required by the LSD computation. The lines within the regions of strong chromospheric (e.g. Na Double, Hα) and telluric lines were removed from the list. We also derived the deconvolved telluric line profiles from the observed spectra to estimate the instrument shifts in the wavelength calibration and corrected them (Collier Cameron 1999).
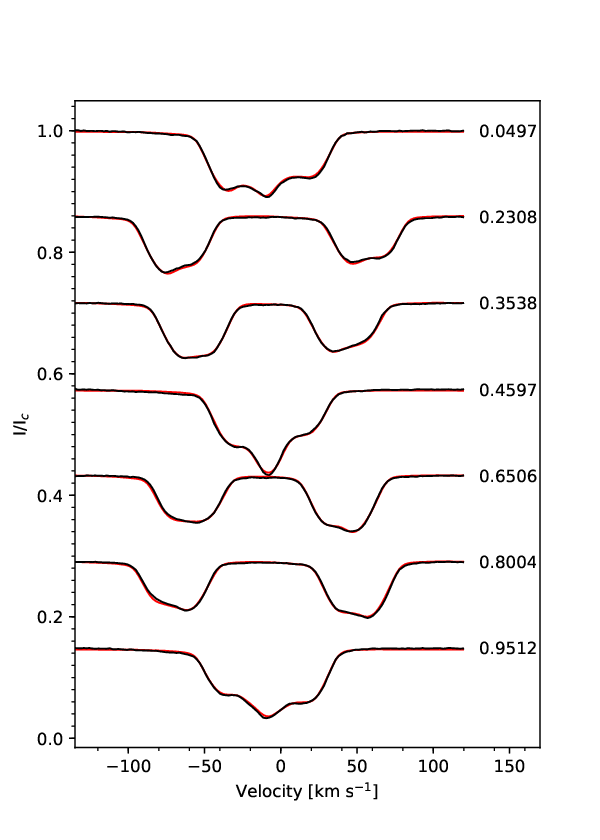
We show examples of the resulting LSD profiles of CrB and the corresponding modeled profiles in Fig. 1. The line profiles of both components exhibit significant distortions, which indicates the presence of starspots on the two stars. We also show the phased time-series LSD profiles of two data sets in gray-scale in Fig. 2. In order to show spot signatures more clearly, an unspotted profile was subtracted from each observed profile. The time-series LSD profiles of the two components were dominated by strong signatures around the line center, which implies pronounced polar spots on the surfaces of both stars of CrB.
Three inactive, slowly-rotating template stars, HR 4540 (F9V), HR 4277 (G1V) and HR 5616 (K2III), were also observed with the same instrument setup during the observing run. Since our Doppler imaging code employs the two-temperature model, which treats the surface of a star as a combination of two components, hot photosphere and cool spot, it requires a pre-calculated lookup table containing the local intensity of each component at each limb angle. Thus the spectra of template stars were deconvolved in the same manner to mimic the photospheres and spots of two stars. We used linear interpolation of the limb-darkening coefficients derived by Claret et al. 2012 and Claret et al. 2013 for UBVRI passbands to obtain the values at the centroidal wavelength for the photosphere and spot temperatures of each component star, and 30 limb angles were used for producing the lookup tables.


III Doppler imaging
III.1 Stellar parameters
A reliable stellar surface reconstruction demands accurate system parameters, and errors in these parameters lead to spurious features (Collier Cameron & Unruh 1994). The parameters of CrB have been well determined by Strassmeier & Rice 2003 and Rosén et al. 2018. Thus, in our case, we adopted the refined orbital elements, including the mass ratio (q), the radial velocity amplitudes of two stars (K), the inclination degree (i), the conjunction time (T0), and the orbital period, derived by Rosén et al. 2018, and list them in Table 2. We fine-tuned the radial velocity of the mass center of the binary system () with the minimization method (Barnes et al. 2000), and the result is also shown in Table 2. Note that this value is the zero point for our data set and not the true value, since we cannot determine the systematic instrument shift in our data sets without the radial velocity standard. We also tried to determine the projected equator rotational speed () through the same method. The result of both components is = 26 km s-1, which is well in accordance with that derived by Strassmeier & Rice 2003.
| Parameter | Value | Ref. |
|---|---|---|
| 0.9724 | a | |
| (km s-1) | 61.366 | a |
| (km s-1) | 63.106 | a |
| (°) | 28 | a |
| (km s-1) | -12.4 | DoTS |
| T0 (HJD) | 2450127.9054 | a |
| Period (d) | 1.13979045 | a |
| 1 (km s-1) | b | |
| 2 (km s-1) | b |
Note. — References: a. Rosén et al. 2018; b. Strassmeier & Rice 2003.
III.2 Spot images
We use the Doppler imaging code DoTS (short for DOppler Tomography of Stars) developed by Collier Cameron 1992; Collier Cameron 1997 to perform the maximum entropy iterations to both data sets. The residuals between the observed LSD and modeled profiles were displayed in grey scale in Fig. 3. Fig. 4 shows the reconstructed surface images of the two components of CrB. The mean spot filling factor as a function of latitude is plotted beside each image. Note that longitude 0° on the F9 star faces longitude 180° on the G0 star in our Doppler images. To show the relationship of the spot position on the surfaces of the two components of CrB more clearly, we display 3D images of both components of CrB at key orbital phases 0, 0.25, 0.5, 0.75 for two data sets in Fig. 5 and Fig. 6, respectively.


Our new Doppler images show a relatively simple spot pattern on the F-type component of CrB. The main feature of the F9 star is a pronounced polar spot, which is consistent with what we see in the time-series LSD profiles (Fig. 2). A very weak spot feature is present at both images of F9 star, but its longitude was changed from 300° to 270° during our observations. The surface of the G-type component of CrB is also dominated by a polar spot, and it also shows an intermediate-latitude, extended spot structure between longitudes 30 and 210, connecting to the polar cap. The polar spot on each component is asymmetric with respect to the rotational axis, which is in good agreement with the results of Strassmeier & Rice 2003 and Rosén et al. 2018.


In order to determine the reliability of the surface features in our new Doppler images of CrB, we also performed an odd-even test on the reconstructions. We split each data set into two subsets which respectively consist of odd-numbered and even-numbered LSD profiles. Then we derived the surface images of the two components from the independent subsets. As shown in Fig. 7, the reconstructed spot patterns in each image pair are nearly identical for each star, which demonstrates that our image reconstructions are reasonably reliable and that the dense sampling is helpful for the Doppler imaging.


III.3 Differential rotation
The Doppler imaging can spatially resolve the stellar disc and thus can be used to measure the surface differential rotation. One can obtain the surface shear rate with either the cross-correlation (Donati & Collier Cameron 1997) or the image shear method (Petit et al. 2002). The cross-correlation method requires observations spanning at least two rotational cycles and good phase coverage. The advantage of this method is that it does not need any prior knowledge of the differential rotation law.
Two Doppler images several rotational period apart may show latitude-dependent rotation pattern. Actually, some clues can be seen directly from our Doppler images. The appendages of polar spots moved to less longitude between the two observation epochs, indicating a slower rotation of the high-latitude feature with respect to the co-rotating frame.
The first 39 spectra of data set No. 1 are collected on 2015 March 27, when is 4 days before the second observing night of 2015 March 31. This time interval is much larger than the rest and thus may introduce more errors in the estimate of the differential rotation. Hence, for the cross-correlation study, we firstly derived the Doppler images of the two components from data set No. 1 without the spectra of March 27. The new surface images are shown in Fig. 8 and the phase coverage is still sufficient. Then we used these images and the ones derived from data set No. 2 to calculate the cross-correlation function of each latitude stripe on each component (Fig. 9). The peak of the cross-correlation function of each latitude was determined by fitting a Gaussian profile. We tried to fit the peaks with a solar-like surface shear curve as follows
| (1) |
where is the latitude and is the rotational speed at equator and is the difference between the equator and the stellar pole. The points between latitudes 20° and 70° were used, because the Doppler imaging technique has a poor longitude resolution at higher latitudes and is insensitive to the latitude of spots near the stellar equator, and latitudes below 20° were relatively featureless. The G0 component of CrB shows a clear solar-like differential rotation, and the surface shear rate is rad d-1 and . However, we failed to fit the cross-correlation map of the F9 component. It is probably due to that most spots on the F9 star are concentrated at high-latitude and no significant spot is present at mid-to-low latitudes.


IV Discussion
We have presented new Doppler images of both components of the double-lined binary CrB, based on two data sets with very good phase coverage collected in 2015 March and April. The maximum entropy reconstructed images show that the surfaces of both components are dominated by pronounced polar spots. On each star, the polar spot is asymmetric with respect to the stellar pole. At latitude 30°, the G0 star also exhibits an extended spot structure connecting to the polar spot whereas the F9 star only shows a weak feature.
The epoch of our observations is just between two observing seasons of Rosén et al. 2018. The spot patterns in our surface images are compatible to their reconstructed brightness distributions, especially for high latitude features. The polar spots on two components are revealed by all Doppler images. This may indicate a long lifetime for the polar spots on two stars, at least three years, which is common on active binaries (e.g. Strassmeier 2009). The spot configurations of mid-to-low latitudes in our images are different to those in their images, which should be due to the spot evolution.
Our Doppler images of the two components of CrB are very compatible to those of Strassmeier & Rice 2003. They revealed the coexistence of dominant polar cool spots on both stars and the presence of a mid-to-high latitude cool spot on the F9 star. They also found equatorial warm belt on the trailing hemisphere of each star with respect to the orbital motion. Since our Doppler imaging code uses the two-temperature model, we cannot reconstruct any hot spot on the stellar surface. The spot structure at latitude 30° on the G0 star is facing the F9 star, as seen in Fig. 5 and 6. This is somewhat similar to the spot distribution of the two components of ER Vul (Xiang et al. 2015). However, considering the images of Rosén et al. 2018 in 2014 and 2017, the spot longitude distributions of both stars seem to be chaotic and they do not show any clear preferred active longitudes, which are found on many active binary and single stars (Strassmeier 2009). Apparently, any conclusive result on that requires more reproducible observations.
The spot coverages of the northern hemispheres of the F9 and G0 components of CrB, derived from the reconstructed surface images, are 4.5% and 10.5%, respectively. The G0 star showed a higher level of spot activity than the F9 star in 2015. This difference is consistent with the results of Donati et al. 1992 and Rosén et al. 2018. Donati et al. 1992 only detected magnetic signatures on the G0 star but not on the F9 star, based on the polarisation spectra data collected in 1990 and 1991. Rosén et al. 2018 modeled the Stokes V profiles of CrB and detected magnetic field of both components, but the field strength on the G0 star is larger than that on the F9 star.
Considering the similarity of the two components of CrB, it is interesting to see this persistent difference of magnetic activity levels of two stars in various observation seasons. The F9 and G0 stars have very close effective temperature, stellar mass, radius and evolutionary status (Strassmeier & Rice 2003), which means that they should have similar depth of the convection envelope. The rotational periods of the two stars are equal to each other due to the tidal lock. These are believed to be the most important factors of the stellar dynamo, which generates magnetic field on stars. Rosén et al. 2018 inferred that the significant difference in magnetic field strengths of the two stars is not likely caused by their long-term activity cycle, because the same difference was also revealed by Donati et al. 1992 in 1990–1991 and it seems to be persistent for 30 years, and that the strength difference is probably related to the different regimes of the stellar dynamo with low Rossby numbers, which can produce either a strong, dipole magnetic field or a weak, complex field on stars as revealed by Gastine et al. 2013.
The two solar-like components (G0V + G2V) of ER Vul are very similar to those of CrB. The rotational period of ER Vul is 0.7d, shorter than that of CrB. Piskunov et al. 2001 presented the Doppler images of both components of ER Vul and found large temperature variations and the presence of hot spots at sub-stellar points on the two stars. In our previous work (Xiang et al. 2015), we also derived Doppler images of ER Vul for 2006 and 2008 observing seasons. The spot patterns are more complex than those on CrB. Both components of ER Vul show spots at various latitudes, from the equator to the stellar pole, and most mid-to-low latitude spots are concentrated at the hemisphere facing another star.
Another similar star is AF Lep, which is a single star with a similar spectral type (F8/9) and rotational period (1.0 d). The surface images derived by Järvinen et al. 2015 indicate the presence of a dominant high-latitude spot, similar to that on F9 star of CrB. Their theoretic models suggested that the radiative interior and the convection zone at the equator should have a same rotational speed to produce a high-latitude magnetic field.
A difference between the photometric and orbital periods was found by Strassmeier & Rice 2003 and Rosén et al. 2018. Rosén et al. 2018 estimated that the rotational periods of the F9 and G0 star are 0.039 and 0.024 d longer than the orbital period. They attribute this to the surface differential rotation and the magnitude should be 0.1–0.19 rad d-1. The larger rotational period may indicate that the dominant high-latitude features rotate more slowly than the orbital co-rotation (Rosén et al. 2018). The slower rotation of high-latitudes features can be directly seen in our Doppler images. Although we cannot derive a clear differential rotation law for the F9 star due to the lack of mid-to-low latitude spots, we found that the high-latitude features were about 50° backward with respect to the co-rotating frame, corresponding to 6° per day. This is consistent with the estimate of Rosén et al. 2018.
Through the cross-correlation method, we derived a solar-like latitude-dependent rotation for the G0 star. The estimate is rad d-1, which is in good agreement with the inference of Strassmeier & Rice 2003 and Rosén et al. 2018. The results indicate that the stellar equator of the G0 star rotates faster than the pole and laps it once every 35 d. Note that error estimate is just statistical, and the spot evolution may induce more errors in the estimate of the surface shear, since our observing run spans 15 nights. Further multi-site observations are needed to study the surface differential rotation of CrB.
Recently, surface differential rotation on various single and binary stars has been detected, and the relationship between the surface shear rate and stellar parameters were investigated by many authors (Barnes et al. 2005; Collier Cameron 2007; Kővári et al. 2017). The surface differential rotation rate increases with the decrease of the depth of the stellar convection zone (Barnes et al. 2005; Marsden et al. 2011). The shear rate found on the G0 component of CrB is in good agreement with the relations between the differential rotations and the effective temperatures derived by Barnes et al. 2005.
V Conclusion
We obtained spectra of the double-lined binary CrB with the 1m Hertzsprung SONG telescope during 11 nights in March and April, 2015. The time-series LSD profiles derived from the observed spectra formed two independent, well-sampled data sets from which we derived two Doppler images of each component of CrB.
Our new Doppler images show dominant polar spots on both of the F9 and G0 star components of CrB, similar to those derived by Strassmeier & Rice 2003 and Rosén et al. 2018. These polar spots are asymmetric about the stellar rotational pole. The spot images also show a weak feature at intermediate latitude on the F9 star and an extended spot structure on the G0 star. The spot coverage of the G0 star is larger than that of the F9 star, which may indicate that the G star had a higher level of the magnetic activity than the F star during our observing seasons.
Differential rotation, as an important ingredient in generating stellar magnetic field, is difficult to be quantified. The surface differential rotations of only tens of active stars have been measured by means of Doppler imaging, which can spatially resolve the stellar disk. These measurements require relatively long time-span observations covering several rotational cycles and sufficient phase sampling. Differential rotation rates of a variety of stars are needed to investigate the relations to the stellar parameters, such as the rotational periods and effective temperatures, to better understand the stellar dynamo.
The cross-correlation of latitude stripes of two independent Doppler images of the G0 star reveals a solar-like surface differential rotation. The shear rate is rad d-1, which means the equator of the G0 star rotates faster than the stellar pole and laps it once every 35 d. The relative differential rotation rate of the G0 star is . The cross-correlation map for the F9 star, however, does not show a clear differential rotation law, due to the lack of mid-to-low latitude features, but its high-latitude spots rotate slower with respect to the co-rotating frame.
The near 1-d period of CrB makes it difficult to obtain complete phase coverage at only one site. In the future, with more spectroscopy telescopes of SONG network at global sites, active stars with such integral-day rotational periods will be observed more effectively. This will greatly help to investigate their starspot activity and surface differential rotation.
VI Acknowledgements
This work is supported by National Natural Science Foundation of China (grant Nos. 10373023, 10773027, 11333006, 11603068, and U1531121) and Chinese Academy of Sciences project (No. KJCX2-YW-T24). Funding for the Stellar Astrophysics Centre is provided by The Danish National Research Foundation (Grant DNRF106). A special thanks goes to Antonio Pimienta and the team of operators at Observatorio del Teide who have contributed to the maintenance and running of the Hertzsprung SONG Telescope. We are very grateful to the anonymous referee for valuable comments and suggestions that significantly improved the clarity and quality of this paper. This work has made use of the VALD database, operated at Uppsala University, the Institute of Astronomy RAS in Moscow, and the University of Vienna.
References
- Andersen et al. (2019) Andersen, M. F., Handberg, R., Weiss, E., et al. 2019, Publications of the Astronomical Society of the Pacific, 131, 045003, doi: 10.1088/1538-3873/aaff7c
- Andersen et al. (2014) Andersen, M. F., Grundahl, F., Christensen-Dalsgaard, J., et al. 2014, in Revista Mexicana de Astronomia y Astrofisica Conference Series, Vol. 45, 83. https://ui.adsabs.harvard.edu/abs/2014RMxAC..45...83A
- Antoci et al. (2013) Antoci, V., Handler, G., Grundahl, F., et al. 2013, Monthly Notices of the Royal Astronomical Society, 435, 1563, doi: 10.1093/mnras/stt1397
- Barnes et al. (2005) Barnes, J. R., Collier Cameron, A., Donati, J.-F., et al. 2005, MNRAS, 357, L1, doi: 10.1111/j.1745-3933.2005.08587x
- Barnes et al. (2000) Barnes, J. R., Collier Cameron, A., James, D. J., & Donati, J. F. 2000, MNRAS, 314, 162, doi: 10.1046/j.1365-8711.2000.03237.x
- Berdyugina et al. (1998) Berdyugina, S. V., Berdyugin, A. V., Ilyin, I., & Tuominen, I. 1998, A&A, 340, 437
- Claret et al. (2012) Claret, A., Hauschildt, P. H., & Witte, S. 2012, A&A, 546, A14, doi: 10.1051/0004-6361/201219849
- Claret et al. (2013) —. 2013, A&A, 552, A16, doi: 10.1051/0004-6361/201220942
- Collier Cameron (1992) Collier Cameron, A. 1992, in Lecture Notes in Physics, Vol. 397, Surface Inhomogeneities on Late-Type Stars, ed. P. Byrne & D. Mullan (Springer Berlin / Heidelberg), 33–45, doi: 10.1007/3-540-55310-x_131
- Collier Cameron (1997) Collier Cameron, A. 1997, MNRAS, 287, 556. http://adsabs.harvard.edu/abs/1997MNRAS.287..556C
- Collier Cameron (1999) Collier Cameron, A. 1999, in Astronomical Society of the Pacific Conference Series, Vol. 185, IAU Colloq. 170: Precise Stellar Radial Velocities, ed. J. B. Hearnshaw & C. D. Scarfe, 233
- Collier Cameron (2007) —. 2007, Astronomische Nachrichten, 328, 1030, doi: 10.1002/asna.200710880
- Collier Cameron & Unruh (1994) Collier Cameron, A., & Unruh, Y. C. 1994, MNRAS, 269, 814
- Corsaro et al. (2012) Corsaro, E., Grundahl, F., Leccia, S., et al. 2012, A&A, 537, A9, doi: 10.1051/0004-6361/201117158
- Donati & Collier Cameron (1997) Donati, J.-F., & Collier Cameron, A. 1997, MNRAS, 291, 1
- Donati et al. (1997) Donati, J.-F., Semel, M., Carter, B. D., Rees, D. E., & Collier Cameron, A. 1997, MNRAS, 291, 658
- Donati et al. (1992) Donati, J.-F., Semel, M., & Rees, D. E. 1992, A&A, 265, 669
- Dunstone et al. (2008) Dunstone, N. J., Hussain, G. A. J., Collier Cameron, A., et al. 2008, MNRAS, 387, 1525, doi: 10.1111/j.1365-2966.2008.13338.x
- Gastine et al. (2013) Gastine, T., Morin, J., Duarte, L., et al. 2013, A&A, 549, L5, doi: 10.1051/0004-6361/201220317
- Gastine et al. (2014) Gastine, T., Yadav, R. K., Morin, J., Reiners, A., & Wicht, J. 2014, MNRAS, 438, L76, doi: 10.1093/mnrasl/slt162
- Granzer et al. (2000) Granzer, T., Schüssler, M., Caligari, P., & Strassmeier, K. G. 2000, A&A, 355, 1087
- Grundahl et al. (2017) Grundahl, F., Andersen, M. F., Christensen-Dalsgaard, J., et al. 2017, ApJ, 836, 142, doi: 10.3847/1538-4357/836/1/142
- Gu et al. (2003) Gu, S.-H., Tan, H.-S., Wang, X.-B., & Shan, H.-G. 2003, A&A, 405, 763, doi: 10.1051/0004-6361:20030671
- Hackman et al. (2019) Hackman, T., Ilyin, I., Lehtinen, J. J., et al. 2019, A&A, 625, A79, doi: 10.1051/0004-6361/2018347630
- Harutyunyan et al. (2016) Harutyunyan, G., Strassmeier, K. G., Kunstler, A., Carroll, T. A., & Weber, M. 2016, A&A, 592, A117, doi: 10.1051/0004-6361/201628642
- Holzwarth & Schüssler (2003) Holzwarth, V., & Schüssler, M. 2003, A&A, 405, 303. http://adsabs.harvard.edu/abs/2003A%26A...405..303H
- Järvinen et al. (2015) Järvinen, S. P., Arlt, R., Hackman, T., et al. 2015, A&A, 574, A25, doi: 10.1051/0004-6361/201424229
- Kővári et al. (2007) Kővári, Z., Bartus, J., Strassmeier, K. G., et al. 2007, A&A, 474, 165, doi: 10.1051/0004-6361:20078039
- Kővári et al. (2017) Kővári, Z., Oláh, K., Kriskovics, L., et al. 2017, AN, 338, 903, doi: 10.1002/asna.201713400
- Kriskovics et al. (2014) Kriskovics, L., Kővári, Z., Vida, K., Granzer, T., & Oláh, K. 2014, A&A, 571, A74, doi: 10.1051/0004-6361/201424263
- Kupka et al. (1999) Kupka, F., Piskunov, N., Ryabchikova, T. A., Stempels, H. C., & Weiss, W. W. 1999, A&AS, 138, 119
- Marsden et al. (2011) Marsden, S. C., Jardine, M. M., Velez, J. C. R., et al. 2011, MNRAS, 413, 1939, doi: 10.1111/j.1365-2966.2011.18272.x
- Oláh (2006) Oláh, K. 2006, Astrophysics and Space Science, 304, 145, doi: 10.1007/s10509-006-9096-x
- Özdarcan et al. (2016) Ozdarcan, O., Carroll, T. A., Kunstler, A., et al. 2016, A&A, 593, A123, doi: 10.1051/0004-6361/201628545
- Petit et al. (2002) Petit, P., Donati, J. F., & Collier Cameron, A. 2002, MNRAS, 334, 374, doi: 10.1046/j.1365-8711.2002.05529.x
- Piskunov et al. (2001) Piskunov, N., Vincent, A., Duemmler, R., Ilyin, I., & Tuominen, I. 2001, in Astronomical Society of the Pacific Conference Series, Vol. 223, 11th Cambridge Workshop on Cool Stars, Stellar Systems and the Sun, ed. R. J. Garcia Lopez, R. Rebolo, & M. R. Zapaterio Osorio, 1285
- Raghavan et al. (2009) Raghavan, D., McAlister, H. A., Torres, G., et al. 2009, ApJ, 690, 394, doi: 10.1088/0004-637x/690/1/394
- Rice & Strassmeier (2001) Rice, J. B., & Strassmeier, K. G. 2001, A&A, 377, 264, doi: 10.1051/0004-6361:20011002
- Rosén et al. (2018) Rosén, L., Kochukhov, O., Alecian, E., et al. 2018, A&A, 613, A60, doi: 10.1051/0004-6361/201731706
- Schüssler et al. (1996) Schüssler, M., Caligari, P., FerrizMas, A., Solanki, S. K., & Stix, M. 1996, A&A, 314, 503
- Strassmeier (2009) Strassmeier, K. G. 2009, A&ARv, 17, 251, doi: 10.1007/s00159-009-0020-6
- Strassmeier & Rice (2003) Strassmeier, K. G., & Rice, J. B. 2003, A&A, 399, 315, doi: 10.1051/0004-6361:20021789
- Weber (2007) Weber, M. 2007, Astron Nachr, 328, 1075, doi: 10.1002/asna.200710869
- Xiang et al. (2014) Xiang, Y., Gu, S.-H., Cameron, A. C., & Barnes, J. R. 2014, MNRAS, 438, 2307, doi: 10.1093/mnras/stt2345
- Xiang et al. (2015) —. 2015, MNRAS, 447, 567, doi: 10.1093/mnras/stu2458
- Xiang et al. (2016) Xiang, Y., Gu, S.-H., Cameron, A. C., Barnes, J. R., & Zhang, L.-Y. 2016, MNRAS, 456, 314, doi: 10.1093/mnras/stv2642
- Xiang et al. (2020) Xiang, Y., Gu, S., Wolter, U., et al. 2020, MNRAS, 492, 3647, doi: 10.1093/mnras/staa063