RESULTS ON TOTAL AND ELASTIC CROSS SECTIONS IN PROTON-PROTON COLLISIONS AT = 200 GeV OBTAINED WITH THE STAR DETECTOR AT RHIC
Abstract
We report the first results on differential, total and elastic cross sections in proton-proton collisions at the Relativistic Heavy Ion Collider (RHIC) at GeV. The data were obtained with the Roman Pot Detector subsystem of the STAR experiment. The data used for this analysis cover the four-momentum transfer squared () range (GeV/c)2. The Roman Pot system was placed downstream of the STAR detector. During the data taking the Roman Pots were moved to 8, the vertical distance of from the beam center. They were operated during standard data taking procedure. The results include values of the exponential slope parameter (B), elastic cross section () and the total cross section () obtained by extrapolation of the elastic differential cross section () to the optical point at (GeV/c)2. The detector setup and analysis procedure are reviewed. All results are compared with the world data.
1 The Experiment
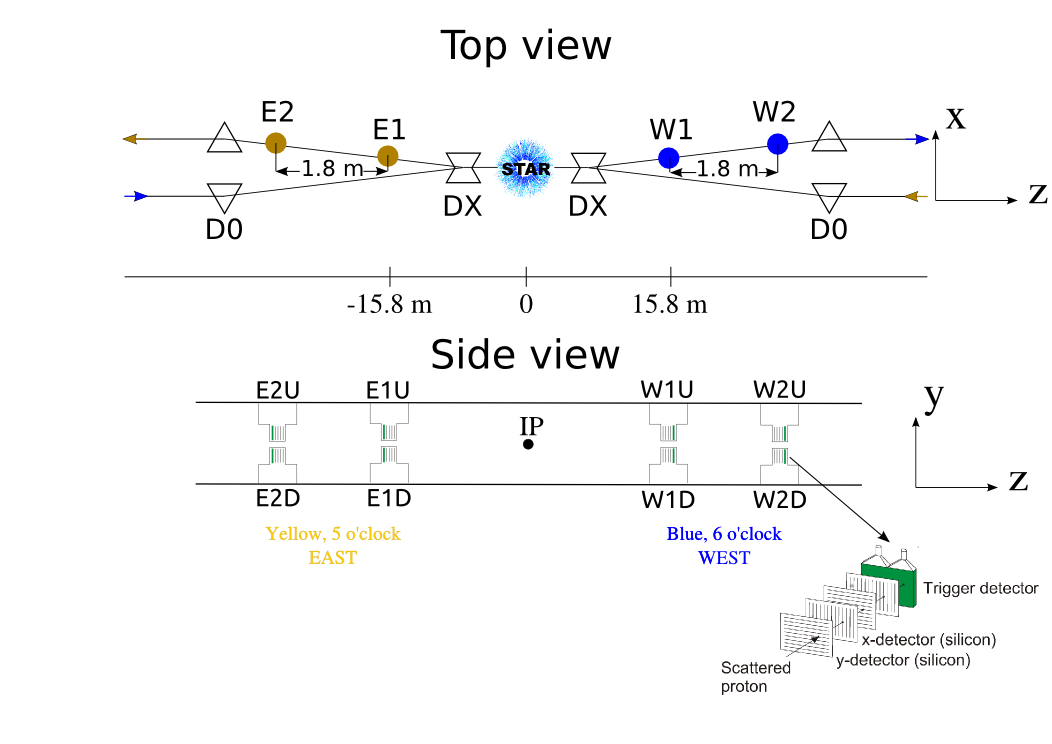
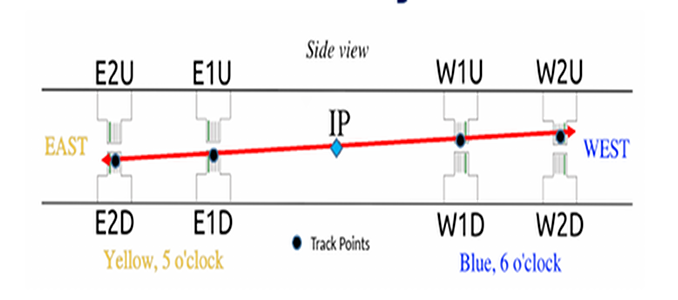
Results presented here are based on data collected with pp2pp Roman Pots [1] part of the STAR detector [2] at RHIC. The Roman Pots (RPs) setup Fig. 1 consisted of four stations with two of them (W1,W2) placed at 15.8 and 17.6 meters downstream, (West) from interaction point (IP) and other two (E1,E2) symmetrically upstream, (East) from IP. Each RP station consists of two Roman Pots ( one above and the other below beam line) each equipped with package of 4 silicon strip detector (Si) planes, two planes for measuring X and the other two for Y positions of the particle track. The scintillation counter placed behind Si planes and read by two PMTs was used to trigger on candidate events. Candidate event had to fulfill the trigger condition, from here referred to as RP_ET, requiring presence of the signal in at least one Roman Pot (RP) on each side of IP.
2 Data Set
Data were taken with nominal beam conditions , luminosity . There were approximately 6.7 millions events
fulfilling trigger condition RP_ET recorded for integrated luminosity 1.8pb-1. The geometrical acceptance was constrained by the closest possible approach
of the detector to the beam and, the aperture of the beam line elements (DX magnet) in front of the detector. The closest achieved distance of the first strip
was mm corresponding to minimum four-momentum transfer 0.03 GeV2. The aperture of DX magnet sets the maximum achievable
four-momentum transfer 0.25 GeV2. The detector acceptance as function of four-momentum transfer is shown
in fig.2.


2.1 Event Reconstruction
All events collected with trigger RP_ET underwent reconstruction procedure. First, in all RPs in each detector Si plane clusters - continuous set of strips with
signal above threshold - were formed. Next, clusters found in two X-planes were matched by comparing their positions and
and finding the pair with minimum distance smaller then 200 (twice Si detector strip pitch).
Analogous procedure was repeated for two Y-planes. Unmatched clusters, if any, were considered as detector noise or random background and were neglected.
Pairs of clusters matched in x and y-plane defined space points and coordinates of the proton track. These were used to calculate
the local angles and in (x,z) and (y,z) planes as:
| (1) |
where subscripts RPs(RPs) denote RP stations 1(2) at same side of and () are z-positions of the stations. For small scattering angles in this experiment, to a good approximation the four-momentum transfer was calculated with formula:
| (2) |
where is proton momentum, scattering angle and calculated as in eq.1. The RPs system was positioned and aligned with respect to nominal beam trajectory, hence the angles and provide direct measurement of the projections of scattering angle on (x,z) and (y,z) plane, respectively.
2.2 Elastic Scattering Event Selection
The hardware trigger requiring signal in at least one RP on each side of IP was very inclusive. The clean pattern indicating elastic scattering ( see right sub-figure in fig.1 ) is presence of two back to back protons in the event. This requires signal only in top RP1 and/or RP2 at one side of and only in bottom RP1 and/or RP2 on the other side. Calculation of the track direction angles (eq.1) requires points in two stations on the each side of IP.
The data sample used to obtain this results consist only of events with four reconstructed points, four points (4PT) events, and fulfilling West-East co-linearity condition:
| (3) |
with rad was dominated by the beam angular divergence (rad for each beam). The kinematic range of four-momentum transfer versus azimuth angle for this sample (4PT-COL) is shown in fig.3.
For the 4PT-COL events, scattering angles at the IP were obtained from the linear fit using four and points. The four-momentum transfer t for those events was then calculated using Eq.2, where local angles were replaced respectively with .
Additionally geometrical cut was imposed to reduce background by staying away from acceptance boundaries and maintain relatively flat, slow varying acceptance corrections (see data labeled as ET-4RP-COL-GEO in fig.2). It was required that the scattered proton angle and azimuth angle obey following limits:
| (4) |


2.3 Monte Carlo Corrections
The beam line elements and all RP detectors were implemented in detail in Geant4[[7]] based Monte Carlo application. The events were generated according to standard formula for the elastic scattering differential cross section with the slope GeV-2, the parameter =0.128 and West-Yennie [4] Coulomb phase. The beam angular divergence and the interaction point position uncertainty were included in the generator.
The experimental differential distributions was corrected using “bin by bin” method with the formula :
| (5) |
where and are true MC distribution and reconstructed based on MC event sample which passed the same reconstruction procedure and selection criteria as those applied for experimental data. The corrections obtained this way account for limited geometrical acceptance, effects of the scattering angle reconstruction resolution ( smearing ) and impact of the secondary scattering of the final state proton off the material on the way from to detector Si planes.
3 Results
The corrected differential cross section ( ) was fitted with standard formula [3, 5, 6] :
| (6) |
with =0.128 from COMPETE [9] model. The Coulomb and interference terms were neglected as their contribution in the fit range 0.045 0.135 GeV2 is negligibly small within this experiment’s precision. The data and fit results are shown in Fig.4.

The total cross section was calculated using the optical theorem as :
| (7) |
and the total elastic cross section was obtained by integrating fitted formula (6) over whole range, the elastic cross section integrated within the t-acceptance of this measurement () is also quoted. The inelastic cross section is simply result of subtraction =. All results with their statistical and systematic uncertainties are shown in table 1.
| Quantity | Statistical | Systematic uncertainties | |||||
|---|---|---|---|---|---|---|---|
| name | units | Value | uncertainty | beam-tilt | luminosity | full | |
| [mb/GeV2] | 139.53 | 1.06 | n/a | ||||
| B | [GeV-2] | 14.32 | 0.09 | n/a | n/a | ||
| [mb] | 9.74 | 0.02 | n/a | ||||
| [mb] | 3.63 | 0.01 | n/a | ||||
| [mb] | 51.81 | 0.20 | |||||
| [mb] | 42.07 | 0.20 | |||||
4 Summary
The elastic differential cross section in pp scattering was measured with Roman Pots system of the STAR experiment at RHIC in range 0.045 0.135 GeV2 at =200 GeV. In this range the cross section is well described by exponential with the slope B = 14.320.09() GeV-2, in brackets full systematic errors are given. The elastic cross section integrated within detector acceptance = 3.630.01() mb, extrapolation of this measured cross section over undetected ( 60%) region results in value of the total elastic cross section =9.740.02()mb. Using optical theorem we found the value of total scattering cross section =51.810.20().


The results obtained with STAR are compared with the world data in Fig.5. We found they compare well and follow COMPETE prediction of dependence of cross section on .
Acknowledgments
This work was partly supported by the National Science Center of Poland under grant number UMO-2015/18/M/ST2/00162.
References
References
- [1] S. Bultmann et al., Nucl. Instrum. Methods 535, 415 (2004).
- [2] visit https://www.star.bnl.gov
- [3] B. Z. Kopeliovich, I. K. Potashnikova and B. Povh, Phys. Rev. D 86, 051502 (2012) [arXiv:1208.5446 [hep-ph]].
- [4] Geofrey B. West and D.R. Yennie, Phys. Rev.172,1413.
- [5] V. Barone, E. Predazzi, High-Energy Particle Diffraction, Texts and Monographs in Physics, Springer-Verlag; (2002), ISBN: 3540421076.
- [6] S. Donnachie, G. Dosch, P. Landshoff, Pomeron Physics and QCD; Cambridge University Press; (1998), ISBN: 9780521675703.
- [7]
S. Agostinelli et al., Nucl. Instrum. Meth. A 506 (2003) 250-303.
or visit http://geant4.web.cern.ch/geant4 - [8]
M. Tanabashi et al., (Particle Data Group), Phys. Rev. D98, 030001 (2018),
http://pdg.lbl.gov/2018/hadronic-xsections/hadron.html - [9] J. R. Cudell, et al., ( COMPETE Collaboration), Phys. Rev. Lett. 89 (2002) 201801.
- [10]
U. Amaldi et al. [CERN-Pisa-Rome-Stony Brook Collaboration],
Phys. Lett. 62B, 460 (1976).
U. Amaldi et al., Phys. Lett. B43, 231 (1973). - [11] G. Barbiellini et al., Phys. Lett. 39B, 663 (1972).
- [12] M. Ambrosio et al., Phys. Lett. 115B, 495 (1982).
- [13] N. A. Amos et al., Phys. Lett. 120B, 460 (1983).
- [14] S. L. Bueltmann et al., Phys. Lett. B 579, 245 (2004)
- [15] G. Antchev et al. [TOTEM Collaboration], Nucl. Phys. B 899, 527 (2015) doi:10.1016/j.nuclphysb.2015.08.010 [arXiv:1503.08111 [hep-ex]].
- [16] G. Antchev et al. [TOTEM Collaboration] and references therein, Eur. Phys. J. C 79, no. 2, 103 (2019) doi:10.1140/epjc/s10052-019-6567-0 [arXiv:1712.06153 [hep-ex]].
- [17] G. Antchev et al. (TOTEM collaboration), Phys. Rev. Lett. 111 no. 1, (2013) 0112001.
- [18] G. Antchev et al., (TOTEM collaboration), EPL 101 no. 2, (2013) 21002.
- [19] G. Aad et al.(ATLAS collaboration), Nucl. Phys. B889 (2014) 486.
- [20] M. Aaboud et al., (ATLAS collaboration), Phys. Lett. B761 (2016) 158.