A Fast Radio Burst discovered in FAST drift scan survey
Abstract
We report the discovery of a highly dispersed fast radio burst, FRB 181123, from an analysis of 1500 hr of drift-scan survey data taken using the Five-hundred-meter Aperture Spherical radio Telescope (FAST). The pulse has three distinct emission components, which vary with frequency across our 1.0–1.5 GHz observing band. We measure the peak flux density to be Jy and the corresponding fluence Jy ms. Based on the observed dispersion measure of 1812 cm-3 pc, we infer a redshift of . From this, we estimate the peak luminosity and isotropic energy to be erg s-1 and erg, respectively. With only one FRB from the survey detected so far, our constraints on the event rate are limited. We derive a 95% confidence lower limit for the event rate of 900 FRBs per day for FRBs with fluences Jy ms. We performed follow-up observations of the source with FAST for four hours and have not found a repeated burst. We discuss the implications of this discovery for our understanding of the physical mechanisms of FRBs.
Subject headings
pulsars: individual (FRB181123 (catalog )) — Radio: stars — stars: neutron — Binaries:general — gravitation – relativityI. Introduction
Fast Radio Bursts (FRBs) are bright millisecond-duration radio bursts that are cosmological in origin. They were discovered over a decade ago (Lorimer et al. 2007) and have been studied ever since at major radio observatories including Parkes (Lorimer et al. 2007; Keane et al. 2012; Thornton et al. 2013; Zhang et al. 2019b), Arecibo (Spitler et al. 2014), Green Bank (Masui et al. 2015), Molonglo (Caleb et al. 2017; Farah et al. 2018). Recently, two new facilities with a wide field of view have been discovering FRBs in large numbers: the Australian Square Kilometre Array Pathfinder; ASKAP (Shannon et al. 2018) and the Canadian Hydrogen Intensity Mapping Experiment; CHIME (Amiri et al. 2019b). Most FRBs seemed to be one-off events, while some are repeating (Spitler et al. 2016). CHIME has been particularly effective at finding repeating FRBs, with 17 published so far (Amiri et al. 2019a; Andersen et al. 2019). The origin of these FRBs remains a hot topic of debate and speculation (Platts et al. 2019).
The Five-hundred-meter Aperture Spherical radio Telescope (FAST; Nan et al. 2011) is the largest telescope in the world (Jiang et al. 2019). Due to the FAST’s superior sensitivity, Lorimer 2018 and Zhang 2018 predicted that it would be able to detect FRBs of significantly higher dispersion measure (DMs) than those from less-sensitive telescopes. Since high-DM sources are most likely very luminous, FAST surveys could help to constrain the high-end of the FRB luminosity function and enable more cosmological applications from FRBs (Zhang 2018). As a first step toward this goal, we report here a highly dispersed FRB from commissioning observations of FAST. In §2, we describe the observations and method used in discovering the FRB event, in §3.1, we present the FRB detection, in §3.2 we derive the constraint on the FAST FRB event rate, in §4. We summarize the results and discuss the implication of this first blind-search FRB discovery.
II. Observations
II.1. FAST Drift scan survey
The Commensal Radio Astronomy FAST Survey (CRAFTS11 1 http://crafts.bao.ac.cn, Li et al. 2018) is a multi-purpose all-sky survey designed to obtain data streams for pulsar searching, transients searching, HI imaging and HI galaxies simultaneously. The survey began testing in August 2017, initially using a single-beam wide-band receiver covering 270–1620 MHz. After May 2018, the survey started using the FAST L-band Array of Nineteen Beams (FLAN), which covers 1050–1450 MHz band with a system temperature of about 20 K (Li et al. 2018). The drift scan survey typically happens at night (Beijing time from 9 pm to 8 am), during which time no other observations are scheduled. A total of 138 nights of observations were conducted, and 1500 hours of 19-beam observations were taken from May 2018 to November 2018, when the burst event was discovered. Data taken subsequently are still being processed. While we report on FRB searches here, we note that the CRAFTS survey has already discovered over 100 new pulsars22 2 http://crafts.bao.ac.cn/pulsar (Qian et al. 2019; Zhang et al. 2019a).
The original FAST data were written in PSRFITS format (Hotan et al. 2004) with two polarizations and 8-bit sampling at 196.608 s intervals and with 4096 spectral channels between 1000 and 1500 MHz. Due to the large data volume, we sum the two polarizations and compress the data to 1-bit before further processing. In the following sections, the signal searching and significance calculations are both based on the single bit summed data, and we include a degradation factor of 33% to account for the loss in signal-to-noise during data compression. The resulting system parameters we adopt are an average system temperature of 23 K including contributions from cosmic microwave background, the foreground sky, earth atmosphere and radiation from the surrounding terrain and an effective telescope gain of 10 K/Jy for beam 17 (15 K/Jy before digitization loss) (Jiang et al. 2019; Jiang et al. 2020).
II.2. Single Pulse Search System
FRB 181123 was identified by a novel GPU-based single-pulse search system that integrates the PICS AI software (Zhu et al. 2014) for selecting single-pulse candidates with the FAST multibeam data. This system uses GPUs to dedisperse the original data streams from each beam into eight subbands for 4096 trial DMs in the range 8.7—9211 pc cm-3. The DM step DM is determined by:
| (1) |
here the left hand side is the pulse broadening across the whole band due to one DM step, the right hand side is the pulse broadening in the lowest channel composed of sample time 196.608 s, an assumed minimal pulse width ms, and the inter-channel DM smearing , where MHz is the channel width; Here MHz2pc-1cm3s is the dispersion constant, is a manually chosen sparseness parameter, MHz, and MHz. The dedispersed time series in each subband are downsampled by a small factor (usually 8) in the GPUs to match the expected typical pulse width of ms. The code outputs the dedispersed time series in each subband for each DM trial to memory. We then search for threshold-crossing burst events in a summed time series combining all subbands in CPUs with multiple levels of possible burst widths. While searching for bursts, the code uses multi-level wavelets33 3 https://github.com/PyWavelets/pywt (Lee et al. 2019) to reduce red noise and search for significant bursts that pass a threshold of 7. This burst search normally results in thousands of detections in each dataset. The code then takes the detected signal position in time and DM for each candidate and extracts from the dedispersed subband time series a segment of data that contains the burst signals. This segment of data contains eight frequency subbands and time bins chosen such that the data segment contains 32 times the burst width of data. We refer to these segments as dedispersed snapshots of the burst. Despite some exceptions, most pulsar-like bursts are wide-band signals, their snapshots often contain a full or partial vertical line, which is distinguishable from that of narrow-banded radio frequency interference (RFI). We then employ the CNN classifier in PICS (Zhu et al. 2014) that was trained using the frequency-vs-phase subplot of the PRESTO44 4 https://github.com/scottransom/presto (Ransom 2011) candidate plots.
The image pattern of a real pulse in our snapshots resembles those in the frequency versus phase subplot in pulsar candidates, i.e., a vertical line. Our experiments show that the PICS-CNN classifier was able to rank the most pulsar-like burst snapshot to the top of all snapshots. We pick only the top candidates from these snapshots (usually with a zero-to-one score 0.96, as determined by experiments) to form the final output candidate list. These candidates were subsequently plotted and inspected by eye. This GPU single-pulse search system (enabled by PICS) helped in the discovery of over 20 new pulsars in the FAST drift scan survey, including those reported in Qian et al. 2019 and Zhang et al. 2019a. This PICS-aided search system uses non-standard ranking criteria. Although successful in finding some pulsars, it does not necessarily detect all pulses that cross the event threshold. A careful study of the recall of this system will be presented in a later contribution (Zhu et al., in prep.) For now, we assume that this system does not find all true signals that cross the threshold. Meanwhile, we also searched the data using the more standard HEIMDALL55 5 http://sourceforge.net/projects/heimdall-astro (Barsdell et al. 2012) pipeline and will report the results in future publication.
III. Results
III.1. FRB 181123
FRB 181123 was detected with a significance of 19 in beam 17 of the multibeam receiver on MJD 58445. More detailed parameters with uncertainties are summarized in Table 1. We searched time series from other beams that are dedispersed with the same DM but found no signal above during the same time. From the logged position of the receiver cabin at the time, we infer that the FRB came from the direction of .06, .47 with a positional uncertainty of 3’ based on the full width of the FAST beam at the center frequency of 1250 MHz. The observed DM for this FRB (1812 pc cm-3) is substantially greater than the maximum DM expected from the Galaxy in this direction pc cm-3 (Yao et al. 2017).
Figure 1 shows a more detailed look at the time–frequency spectrum of FRB 181123, along with the dedispersed pulse profile. The burst shows a multi-peak pulse profile with three distinguishable peaks separated by few milliseconds (labeled as P1, P2, and P3). The measured parameters of these peaks are presented in Table 1. From Gaussian fits to the pulse profiles, we infer that P2 arrives about 5.6 ms after P1, and P3 arrives about 4 ms trailing P2 in the observer’s frame, these correspond to 1.9 ms and 1.4 ms delays in the rest frame of the FRB. Using the radiometer equation to convert our data to a Jansky scale, we measure the specific peak flux to be 65 mJy for P1 and find a specific fluence of 0.2 Jy ms for all three peaks. FRB 181123’s flux and multi-peak pulse profile resemble those from some previously discovered FRBs (Champion et al. 2016). In particular, the two smaller peaks P2, P3, show narrow band features that resemble the down-drift pattern seen in the repeating bursts of FRB 121102 (Gajjar et al. 2018; Hessels et al. 2019; Li et al. in prep.).
Hessels et al. 2019 presented a detailed analysis of the complex time-frequency structures seen in the repeating bursts of FRB 121102. We followed their approach and estimated the drift rate between FRB 181123’s P2 and P3 to be MHz ms-1 (Figure 1, right panel) in the observer’s frame and MHz ms-1 in the rest frame of the FRB; the estimated drift rate has significant uncertainty, and it could be underestimated because we only see part of the spectrum of P2 and P3. Nevertheless, our estimated drift rate of MHz ms-1 fits well to the range measured in FRB 121102 Hessels et al. 2019) around the rest frame emission frequency of 3–4.4 GHz, enhancing the similarities between FRB 181123 and FRB 121102.
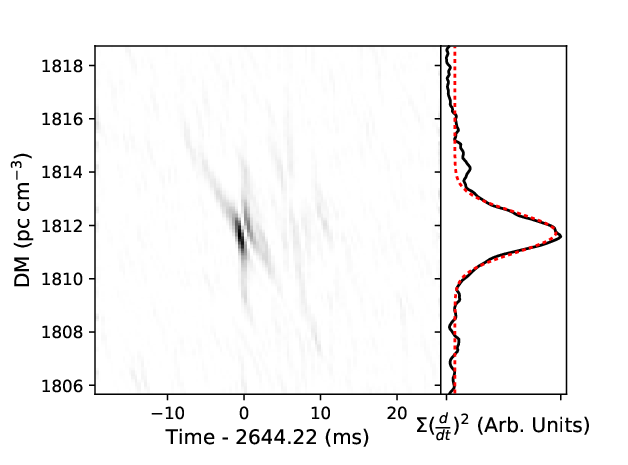
Figure 2 shows the results of a fine frequency-time structure analysis applied to FRB 181123, following the approach in Hessels et al. 2019. We found significant fine structures, characterized by the square of Gaussian-smoothed forward-difference time derivatives (i.e. the changes between every consecutive time bins), in the dedispersed bursts around the position of P1 and minor structures in P2 and P3. These fine structures allow us to derive the optimal DM as 18121 pc cm-3. This estimation is consistent with, and slightly more constrained than, what we we derived from using the S/N. Unlike Gajjar et al. 2018 and Hessels et al. 2019, we did not observe FRB 181123 in a coherent-dedispersion mode, thus the intra-channel smearing due to a DM of is 0.5 ms to 2 ms in our observing band. Hence, DM smearing will not allow us to resolve structure finer than 0.5 ms despite our 0.196608 ms sampling interval. The measured widths of P1, P2, and P3 are consistent with this DM-smearing width and show no significant evidence of scattering tails.
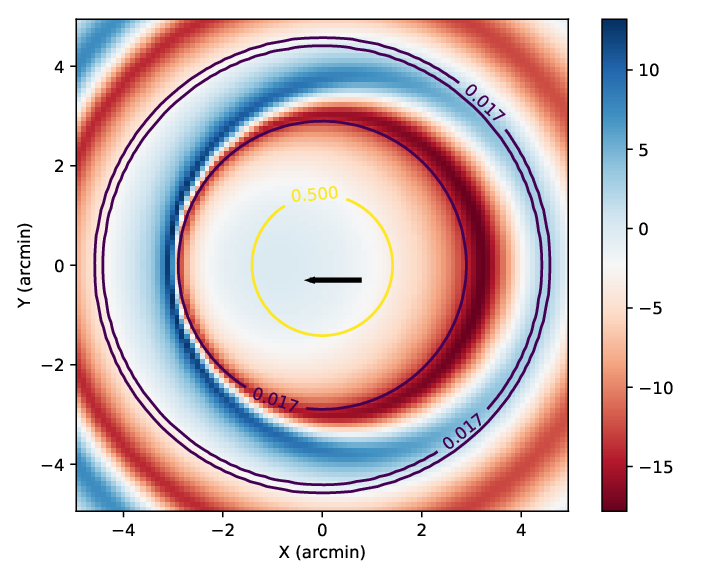
As can be seen in the frequency structure plot in Figure 1, P1 of FRB 181123 is brighter at the lower frequency part of the band. From P1’s on-pulse minus off-pulse spectrum shown in the middle panel of Figure 1, we find that the best-fit FRB spectrum index is . Spitler et al. 2014 detected the first burst of FRB 121102 in the sidelobe of the Arecibo beam. They argue that the sidelobe position varied with frequency and caused the detected burst spectrum to be steep and up-swinging (with spectral index 7–11). The same argument could be applied conversely to FRB 181123, in which case the FRB is likely detected by the main beam instead of the sidelobe. In contrast to the original observation of FRB 121102 (Spitler et al. 2014), FRB 181123 is detected in a drift scan where the beam was moving across the sky while the burst arrived, further changing the observed burst spectral index. We use a theoretical antenna power pattern to evaluate how these two factors change the FRB’s spectral shape (Figure 3). The antenna power pattern of a uniformly illuminated dish,
| (2) |
where
| (3) |
Here and represent the source position with respect to the beam center, is the dish diameter, is the observing frequency, is the speed of light and is a Bessel function of the first kind (Wilson et al. 2012). We integrate along the drifting path of the FRB
| (4) |
to get an approximated power for two subbands: the bottom band (1000–1250 MHz) and the top band (1250–1500 MHz), here is the gain of the telescope as a function of frequency , and is a normalizing factor with MHz. For convenience, we assume to be flat while in practice it varies slightly with (Jiang et al. 2020). The result of this integration depends on the assumed starting position of the FRB (i.e. its position at 1500 MHz), and the FRB’s DM value. We then use the ratio between the integrated power in the up and bottom band to derive an approximation for the extra spectral index: , where MHz and MHz. As shown in Figure 3, if FRB 181123 were detected in the sidelobe, its spectrum would likely have been significantly impacted. But, we observed a relatively flat burst spectrum, and the main peak P1’s signal persists across the whole band. This suggests that FAST likely caught the FRB in the main lobe. Admittedly, the observed antenna pattern of FAST (Jiang et al. 2020) may be quantitatively different from a theoretical one, but our conclusion should still be valid.
The observed dispersion measure of FRB 181123 ( pc cm-3) includes contributions from the intergalactic medium (IGM) – DMIGM, from the Galaxy – DMGal and from the host galaxy of the FRB – DMhost. We assume DM based on Yao et al. 2017 and DM pc cm-3 (Xu & Han 2015; Yang & Zhang 2016), where is the redshift of the host galaxy. Zhang 2018 derived how one could estimate the upper limit of FRB luminosity based on its observed DM. They also derived a DM– relation that correctly accounts for the integrated dispersion effect for objects in cosmological distances assuming homogeneous IGM, and provided an approximated formula DM pc cm-3 for . We follow their calculations closely and solve for the redshift of FRB 181123 using the equation pc cm-3. The best solution is 1.93 and DM pc cm-3. Note that we kept 3 significant digits for and DMIGM to show the exact solution to the above equation.
To quantify the uncertainties on the above estimate, we now step through the relevant contributions. We note that the estimated DMGal has 50% uncertainty (Yao et al. 2017), DMhost may contain 100% uncertainty, together they contribute 5% relative uncertainty to the estimated DMIGM. Furthermore, due to inhomogeneity in the IGM, objects from the same DMIGM could be from different (Pol et al. 2019), according to Walker et al. 2018, this could increase the uncertainty in our estimated by an additional factor of 10%. In the above derivations, we assumed probable distributions of DMGal and DMhost, but we could still underestimate them substantially and thus overestimate DMIGM and . Therefore, we treat the FRB’s derived redshift, luminosity, and energy as upper limits.
Assuming the CDM cosmological parameters with km s-1 kpc and (Planck Collaboration et al. 2016), the luminosity distance of a object is Gpc 66 6 https://docs.astropy.org/en/stable/cosmology. Based on equation (8) and (9) in Zhang 2018, FRB 181123’s peak luminosity is erg s-1 and the isotropic energy erg, both limits contain relative uncertainties of %. These values are comparable to those derived in Table 1 of Zhang 2018 from previously discovered FRBs.

| Parameter | Value aaNumber in parentheses indicates 1- uncertainty in the least significant digit. |
|---|---|
| Date (UTC) | 2018 Nov 23 |
| Time (UTC) | 17:49:09 |
| MJD arrival timebbThe topocentric arrival time of the first peak (P1) in MJD. | 58445.74246675 |
| Right ascensionccCoordinates obtained from the position of the receiver cabin when P1 arrived. We assume a position error circle of 3’ radius. | 05h06m06s.76 |
| DeclinationccCoordinates obtained from the position of the receiver cabin when P1 arrived. We assume a position error circle of 3’ radius. | 18°0935.7 |
| Gal. long. | 184.06 |
| Gal. lat. | –13.47 |
| DM (pc cm-3) | 1812(2) |
| P1 pulse arrival timeddPulse arrival time at the top edge of the band (1500 MHz) since the start of the particular data file.(s) | 2.64422(4) |
| P1 pulse height (mJy) | 65(3) |
| P1 pulse width (ms) | 1.05(6) |
| P2 pulse arrival timeddPulse arrival time at the top edge of the band (1500 MHz) since the start of the particular data file. (s) | 2.6499(1) |
| P2 pulse height (mJy) | 24(3) |
| P2 pulse width (ms) | 0.6(2) |
| P3 pulse arrival timeddPulse arrival time at the top edge of the band (1500 MHz) since the start of the particular data file. (s) | 2.6538(1) |
| P3 pulse height (mJy) | 19(2) |
| P3 pulse width (ms) | 1.2(2) |
| P1 Spectral indexee | –3.3(5) |
| P2-P3 frequency drift rateffMeasured in the observer’s frame. | –140 MHz ms-1 |
III.2. A lower bound on the FAST event rate
Since the PICS-aided GPU searching system is an experimental pipeline, it probably does not find all events that cross the 7 threshold. A more thorough search is currently being conducted using standard software such as HEIMDALL. With one detection from a pipeline of recall , we can only calculate a lower bound on the FAST event rate for the given detection threshold of 7, i.e., 25 mJy ms for 1-bit polarization-summed data. Assuming that the FRB events follow a Poisson distribution, the probability density distribution of the first detected event should follow an exponential distribution, i.e., Poisson distribution of zero events until the first detection. In this case, the cumulative distribution function of an exponential distribution follows , where is the event rate, and is the time to the first detection. Here we would like to find the 95% confidence limits for the event rate giving one event in 1500 hours. We find that when event per 1000 hour (i.e. 0.3 event per year). Considering that our search system does not have a 100% recall rate, no upper bound can be set. Due to small number statistics, the lower limit of event per 1000 hour is not yet constraining to most theoretical predictions (Li et al. 2017; Luo et al. 2018; Luo et al. 2020).
Nevertheless, this first detection attests to FAST’s potential to systematically detect FRBs in the future, and such detections will put far more stringent constraints on the FRB-rate at high DM. Lorimer 2018 and Zhang 2018 showed that the FAST event rate, especially the rate of high-DM FRBs, would help determine the luminosity function of FRBs. Detection of very high DM ( pc cm-3) could probe FRB at more than (Zhang 2018), and help shed light on the cosmological distribution of the FRBs.
IV. Discussion and Summary
FRB 181123 shows a clear multi-peak profile. Its two smaller peaks, P2 ( ms from P1), and P3 ( ms from P2) show narrow band features that resemble the down-drifting pattern seen in the bursts of repeating FRB 121102 (Gajjar et al. 2018; Hessels et al. 2019), 181128, 181222 and 181226 (Andersen et al. 2019). Although multiple sub-bursts and fine pulse structures have also been observed from (so far) non-repeating FRBs (Champion et al. 2016; Farah et al. 2018; Cho et al. 2020), the combination of multiple sub-bursts (or components) with millisecond spacing and down-drifting pattern have mostly been seen from repeating FRBs. This suggests that FRB 181123 could be a repeating FRB source. To test this, we conducted follow-up observations toward the position of the FRB using FAST. So far, we observed the position during for four independent sessions each with one-hour integration on 2020 February 2, 28, and 29 and 2020 March 27. We have not detected any repeating bursts above the fluence level 0.012 Jy ms (7 limit; we used 8-bit digitization and two polarization in the follow-up observations, thus reached a lower detection threshold than in the original 1-bit data). The non-detection of repeating bursts from FRB 181123 may be due to one of the following four reasons (Palaniswamy et al. 2018, e.g.): 1. The waiting times for producing repeating bursts may be longer than the duration of our follow up; 2. Faint repeating bursts may be produced in our observing window, but are below the detection threshold. This requires that the peak fluxes of the putative repeating bursts are lower than that of FRB 181123 by a factor of more than six77 7 A similar case has been observed in FRB 171019 (Kumar et al. 2019), whose repeating bursts are much fainter than the originally detected burst.; 3. The burst activity may be intermittent (e.g. changing due to unidentified periodic activity) like in FRB 121102, and our follow up observations may be taken when the source is not active; 4. The source is an intrinsically non-repeating FRB. It is possible that either of the first three reasons are at play. We plan to continue monitoring the FRB in the coming months and hopefully will eventually detect some bursts if the FRB is a repeater.
The last possibility is difficult to prove, but if true, a catastrophic event has to be able to produce multiple peaks during the emission process. This is challenging for most models, even though in some scenarios this may be possible. For example, the “blitzar” model (Falcke & Rezzolla 2014) suggests that an FRB could originate from the final flash of a supermassive neutron star collapsing into a black hole by magnetic braking. Detailed simulations (Most et al. 2018) showed that this scenario can produce a series of sub-ms pulses whose amplitudes decay exponentially with time. The observed duration of the sub-pulses of FRB 181123, when corrected for the redshift factor, may be consistent with this model. The down-drifting feature seen in sub-pulses may be understood within the generic bunching curvature radiation model invoking open field lines (Wang et al. 2019), which is invoked in the blitzar model during the magnetospheric ejection phase (Most et al. 2018).
FAST’s sensitivity makes it one of the most effective telescope at detecting FRBs from high redshift, therefore its FRB detection rate is an important observable. Li et al. 2017 predicted that the FRB detection rate for the FAST 19-beam would be detections per 1000 hours, based on an all-sky event rate of day-1 that crosses an energy threshold of 0.03 Jy ms. From a different approach, by measuring the event rate density of the luminosity function presented in Luo et al. 2018, Luo et al. 2020 predicted an all-sky event rate of – day-1 for events with flux higher than 5 mJy, which correspond to 1.5–15 events per 1000 hours given the field of view of the FAST 19-beam. With one detection of FRB 181123, we can place a lower bound of event per 1000 hour, which can be translated to an all-sky rate of day-1.
If FRB 181123 is a one-off FRB, not a repeater, it may be possible that at least some energetic FRBs may form a distinct category from the repeaters. Then one may use this event to estimate the event rate density of these energetic events and compare it with some models predicting one-off FRBs, e.g. those models invoking compact star mergers. Equation (10) in Zhang 2018 shows how the fluence () of a putative FRB scales with redshift:
| (5) |
where and denote the luminosity distances corresponding to redshift and , and is the spectra index of the FRB. Following this equation, we find that a FRB like FRB 181123 could be detected with 0.025 Jy ms fluence at a redshift of . For the value of we used the observed spectral index of P1. The resulting redshift corresponds to a comoving volume of 1800 Gpc3. So far, we have made a single detection of an FRB event above erg in energy in a volume of 1800 Gpc3. For the total amount of data we searched, we could infer the 95% confidence lower limit event rate of 900 per day, and an event rate density lower limit of Gpc-3yr-1 for FRBs with energy erg. This lower limit is underestimated because we can only observe a fraction of the FRBs, some (maybe most) FRB events have a lower isotropic energy than erg, some FRBs may be beamed and likely not beaming towards us. Interestingly, this lower limit is already in mild tension with the black hole-black hole (BH-BH) merger event rate density ( Gpc-3yr-1) inferred from LIGO observations (Mapelli & Giacobbo 2018) (regardless whether BH-BH mergers can make FRBs), but could be consistent with neutron star - neutron star (NS-NS) merger event rate density ( Gpc-3 yr-1; Abbott et al. 2017). More detections may be made in the same dataset we used and the true event rate density may be better constrained to a (much) higher value than our limit. This could lead to better constraints on the event rate density of energetic events (Luo et al. 2020), giving tighter constraints on the consistency with the compact star merger models (Wang et al. 2020, see also). FAST is a very sensitive telescope. The FRB sample from FAST blind search would likely be composed of many high DM, high redshift events with higher isotropic energy than samples from other telescopes. Therefore, the FAST blind search FRB sample may become relevant for testing catastrophic models for “one-off” FRBs.
References
- Abbott et al. (2017) Abbott, B. P., Abbott, R., Abbott, T. D., et al. 2017, Phys. Rev. Lett., 119, 161101
- Amiri et al. (2019a) Amiri, M., Bandura, K., Bhardwaj, M., et al. 2019a, Nature, 566, 235
- Amiri et al. (2019b) —. 2019b, Nature, 566, 230
- Andersen et al. (2019) Andersen, B. C., Bandura, K., Bhardwaj, M., et al. 2019, ApJ, 885, L24
- Astropy Collaboration et al. (2013) Astropy Collaboration, Robitaille, T. P., Tollerud, E. J., et al. 2013, A&A, 558, A33
- Astropy Collaboration et al. (2018) Astropy Collaboration, Price-Whelan, A. M., Sipőcz, B. M., et al. 2018, AJ, 156, 123
- Barsdell et al. (2012) Barsdell, B. R., Bailes, M., Barnes, D. G., & Fluke, C. J. 2012, MNRAS, 422, 379
- Caleb et al. (2017) Caleb, M., Flynn, C., Bailes, M., et al. 2017, MNRAS, 468, 3746
- Champion et al. (2016) Champion, D. J., Petroff, E., Kramer, M., et al. 2016, MNRAS, 460, L30
- Cho et al. (2020) Cho, H., Macquart, J.-P., Shannon, R. M., et al. 2020, ApJ, 891, L38
- Falcke & Rezzolla (2014) Falcke, H., & Rezzolla, L. 2014, A&A, 562, A137
- Farah et al. (2018) Farah, W., Flynn, C., Bailes, M., et al. 2018, MNRAS, 478, 1209
- Gajjar et al. (2018) Gajjar, V., Siemion, A. P. V., Price, D. C., et al. 2018, ApJ, 863, 2
- Hessels et al. (2019) Hessels, J. W. T., Spitler, L. G., Seymour, A. D., et al. 2019, ApJ, 876, L23
- Hotan et al. (2004) Hotan, A. W., van Straten, W., & Manchester, R. N. 2004, PASA, 21, 302
- Jiang et al. (2019) Jiang, P., Yue, Y., Gan, H., et al. 2019, Science China Physics, Mechanics, and Astronomy, 62, 959502
- Jiang et al. (2020) Jiang, P., Tang, N.-Y., Hou, L.-G., et al. 2020, RAA accepted, arXiv:2002.01786
- Keane et al. (2012) Keane, E. F., Stappers, B. W., Kramer, M., & Lyne, A. G. 2012, MNRAS, 425, L71
- Kumar et al. (2019) Kumar, P., Shannon, R. M., Osłowski, S., et al. 2019, ApJ, 887, L30
- Lee et al. (2019) Lee, G., Gommers, R., Waselewski, F., Wohlfahrt, K., & OLeary, A. 2019, Journal of Open Source Software, 4, 1237
- Li et al. (2018) Li, D., Wang, P., Qian, L., et al. 2018, IEEE Microwave Magazine, 19, 112
- Li et al. (2017) Li, L.-B., Huang, Y.-F., Zhang, Z.-B., Li, D., & Li, B. 2017, Research in Astronomy and Astrophysics, 17, 6
- Lorimer (2018) Lorimer, D. R. 2018, Nature Astronomy, 2, 860
- Lorimer et al. (2007) Lorimer, D. R., Bailes, M., McLaughlin, M. A., Narkevic, D. J., & Crawford, F. 2007, Science, 318, 777
- Luo et al. (2018) Luo, R., Lee, K., Lorimer, D. R., & Zhang, B. 2018, MNRAS, 481, 2320
- Luo et al. (2020) Luo, R., Men, Y., Lee, K., et al. 2020, MNRAS, arXiv:2003.04848
- Mapelli & Giacobbo (2018) Mapelli, M., & Giacobbo, N. 2018, MNRAS, 479, 4391
- Masui et al. (2015) Masui, K., Lin, H.-H., Sievers, J., et al. 2015, Nature, 528, 523
- Most et al. (2018) Most, E. R., Nathanail, A., & Rezzolla, L. 2018, ApJ, 864, 117
- Nan et al. (2011) Nan, R., Li, D., Jin, C., et al. 2011, International Journal of Modern Physics D, 20, 989
- Palaniswamy et al. (2018) Palaniswamy, D., Li, Y., & Zhang, B. 2018, ApJ, 854, L12
- Planck Collaboration et al. (2016) Planck Collaboration, Ade, P. A. R., Aghanim, N., et al. 2016, A&A, 594, A13
- Platts et al. (2019) Platts, E., Weltman, A., Walters, A., et al. 2019, Phys. Rep., 821, 1
- Pol et al. (2019) Pol, N., Lam, M. T., McLaughlin, M. A., Lazio, T. J. W., & Cordes, J. M. 2019, ApJ, 886, 135
- Qian et al. (2019) Qian, L., Pan, Z., Li, D., et al. 2019, Science China Physics, Mechanics, and Astronomy, 62, 959508
- Ransom (2011) Ransom, S. 2011, PRESTO: PulsaR Exploration and Search TOolkit, Astrophysics Source Code Library, ascl:1107.017
- Shannon et al. (2018) Shannon, R. M., Macquart, J. P., Bannister, K. W., et al. 2018, Nature, 562, 386
- Spitler et al. (2014) Spitler, L. G., Cordes, J. M., Hessels, J. W. T., et al. 2014, ApJ, 790, 101
- Spitler et al. (2016) Spitler, L. G., Scholz, P., Hessels, J. W. T., et al. 2016, Nature, 531, 202
- Thornton et al. (2013) Thornton, D., Stappers, B., Bailes, M., et al. 2013, Science, 341, 53
- Walker et al. (2018) Walker, C. R. H., Ma, Y. Z., & Breton, R. P. 2018, arXiv e-prints, arXiv:1804.01548
- Wang et al. (2020) Wang, M.-H., Ai, S.-K., Li, Z.-X., et al. 2020, ApJ, 891, L39
- Wang et al. (2019) Wang, W., Zhang, B., Chen, X., & Xu, R. 2019, ApJ, 876, L15
- Wilson et al. (2012) Wilson, T. L., Rohlfs, K., & Huttemeister, S. 2012, Tools of Radio Astronomy, 5th edition
- Xu & Han (2015) Xu, J., & Han, J. L. 2015, Research in Astronomy and Astrophysics, 15, 1629
- Yang & Zhang (2016) Yang, Y.-P., & Zhang, B. 2016, ApJ, 830, L31
- Yao et al. (2017) Yao, J. M., Manchester, R. N., & Wang, N. 2017, ApJ, 835, 29
- Zhang (2018) Zhang, B. 2018, ApJ, 867, L21
- Zhang et al. (2019a) Zhang, L., Li, D., Hobbs, G., et al. 2019a, ApJ, 877, 55
- Zhang et al. (2019b) Zhang, S. B., Hobbs, G., Dai, S., et al. 2019b, MNRAS, 484, L147
- Zhu et al. (2014) Zhu, W. W., Berndsen, A., Madsen, E. C., et al. 2014, ApJ, 781, 117